
Identifying a reliable bullish continuation signal with a clear, measurable profit target is crucial for systematic trading. The Cup and Handle pattern is a classic technical setup, highly regarded for its distinctive shape and strong signaling power.
This guide provides the complete, structural methodology required to calculate the pattern’s profit objective and integrate it into a robust strategy for objective risk management.
Key Takeaways
- The cup and handle is a famous bullish pattern.
- It consists of two parts: a U-shaped cup and a smaller corrective “handle.”
- A confirmed break is a signal when the price moves above resistance, ideally with increasing volume.
- The target is calculated by adding the depth of the cup to the confirmation point.
- The pattern is effective across multiple markets, including stocks, forex, and crypto.
1. What Is the Cup and Handle Pattern?
The Cup and Handle is a bullish continuation chart pattern that signals a potential strengthening of an existing uptrend. First popularized by legendary investor William J. O’Neil in his 1988 book, How to Make Money in Stocks, it remains one of the most widely used and often effective formations in technical analysis, provided specific entry rules are met.
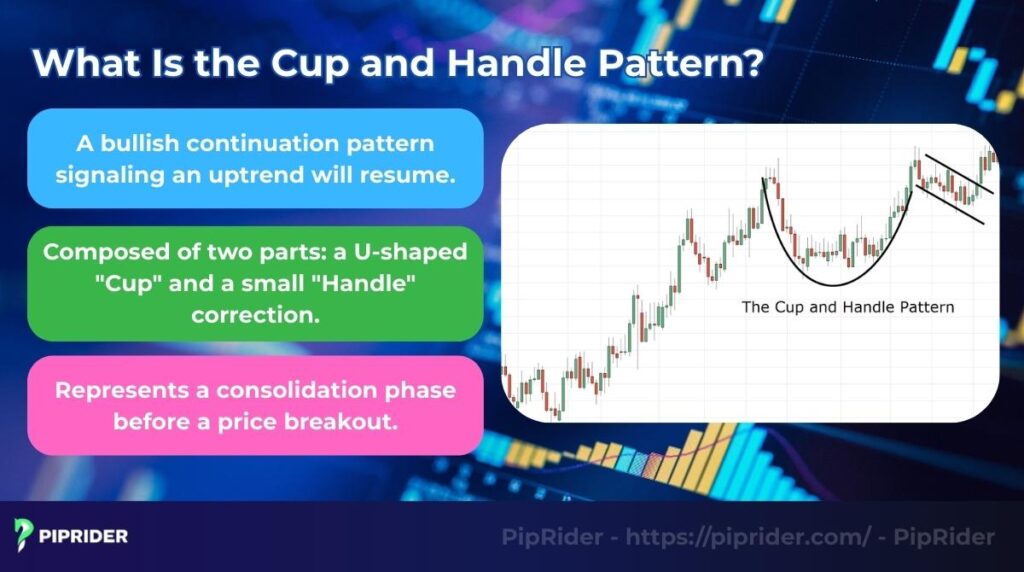
In essence, the pattern represents a period of consolidation followed by a potential move upward. What does a cup and handle mean in stocks or forex? It signifies that after a price rally, the asset is taking a healthy pause to “build energy” before potentially resuming its advance.
The Professional’s Reality Check: While historically powerful, the Cup and Handle is a probabilistic signal, not a guaranteed win. Like any technical setup, it can and does fail (resulting in a “failed breakout”), which is why strict risk management and confirmation are non-negotiable.
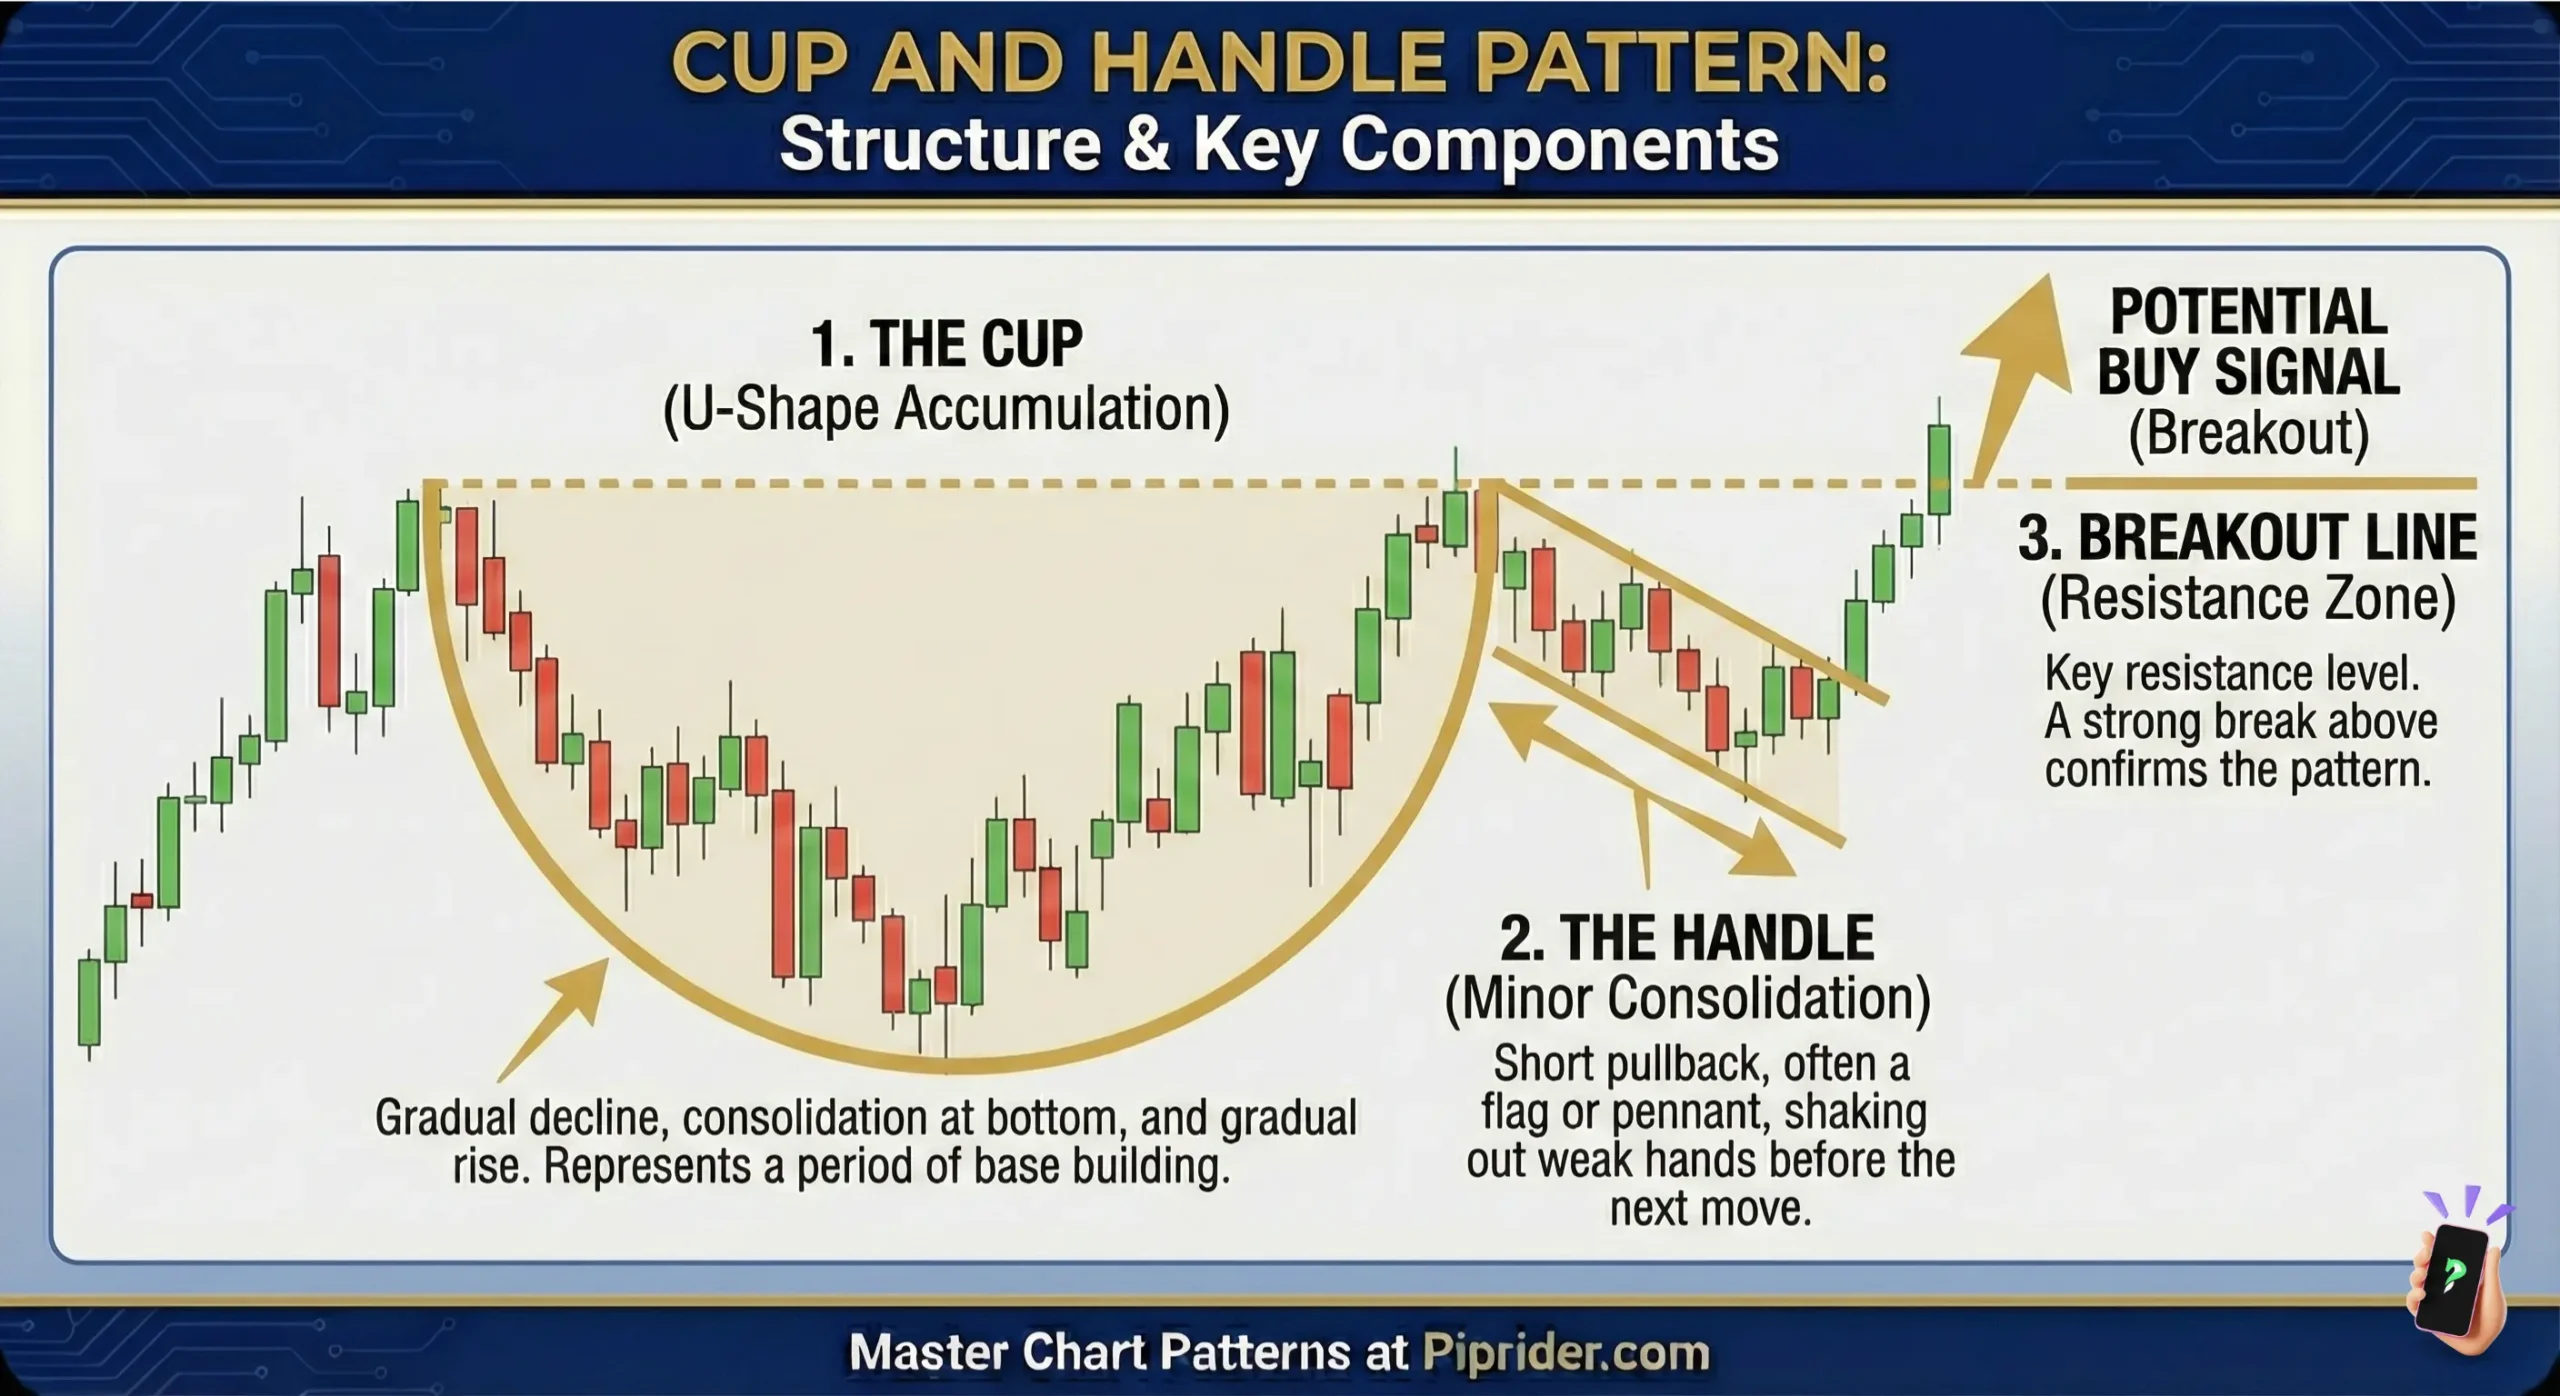
The Psychology Behind the Formation:
- The ‘Cup’: Forms a “U” shape, showing a gradual price decline followed by stabilization. This indicates that initial selling pressure is fading and a stable price bottom is being established by institutional buyers.
- The ‘Handle’: A shorter, slight downward drift. This represents a final, shallow pullback as the last “weak-handed” sellers exit before buyers take full control to push price above the resistance rim.
2. How to Identify a Cup and Handle Pattern
To find a valid pattern on a price chart, traders look for three key features:
- The “U”-Shaped Cup: The initial price decline and recovery should form a gradual, rounded “U” shape. A sharp “V” shape is typically not a valid cup, as it indicates a volatile reversal rather than a period of consolidation.
- The Short “Handle”: After the cup is formed, the price should drift sideways or slightly down, forming a shallow downward-sloping handle that resembles a bull flag. Traders familiar with flag pattern trading will recognize this structure as a pause where selling pressure exhausts itself before the breakout.
- The Breakout: The pattern is confirmed when the price breaks decisively above the resistance level formed by the top of the cup, signaling that buyers have taken full control.
- The “Candle Close” Rule: For a breakout to be considered “decisive,” the candle body must close above the resistance line on your chosen timeframe. Never enter a trade based solely on a “wick” (shadow) that pokes above the level and quickly retreats, as this is a classic sign of a false breakout (fakeout) where sellers are still defending the rim.
Timeframe and Confirmation are Key
- Timeframe: This pattern is most reliable on longer timeframes like the daily and weekly charts. It is less effective on very short timeframes due to market noise.
- Confirmation: A valid move must be accompanied by a significant increase in buying activity. This surge confirms strong buying interest and a higher probability of a sustained upward move. A move on low activity is a major red flag.
Note for Spot FX Traders: Since the Forex market is decentralized (OTC), “real” centralized volume data does not exist. Instead, platforms display Tick Volume as a proxy for activity. For the highest confirmation in Forex, prioritize a daily candle close above resistance, combined with volatility expansion (ATR) and high liquidity during the London/New York session overlaps.
Valid Cup & Handle Rules: A Quick Checklist
Before committing capital, use this professional filter to distinguish between a high-probability pattern and a “junk” formation. A valid Cup and Handle must satisfy these six structural rules:
✅ Pro-Trader Filtering Checklist
- 1. Prior Trend: A clear, established uptrend (ideally 30% or more) must precede the cup. As a continuation pattern, it requires a strong trend to resume.
- 2. Cup Depth: The correction from the left rim to the bottom should ideally be between 15% and 30%. Cups deeper than 50% often indicate too much selling pressure to overcome.
- 3. Cup Geometry: The base must be a smooth, rounded “U” shape. Avoid “V” shapes, as they represent volatile price action rather than healthy institutional accumulation.
- 4. Rim Symmetry: Both edges (rims) of the cup should be approximately at the same price level. If the right rim is significantly lower than the left, the bullish thesis is weakened.
- 5. Handle Position & Duration: The handle must form in the upper half (top 50%) of the cup’s depth and ideally last at least 1-2 weeks on a daily chart. A “sagging” handle is a major red flag.
- 6. Breakout Confirmation: A valid signal requires a daily close above resistance accompanied by a surge in activity (Real Volume for stocks; Tick Volume or ATR expansion for Forex).
3. Types of Cup and Handle Patterns
While the core structure of this pattern remains the same, it can appear in different contexts and timeframes. Understanding these variations helps traders adapt their strategy to specific market conditions and asset classes.
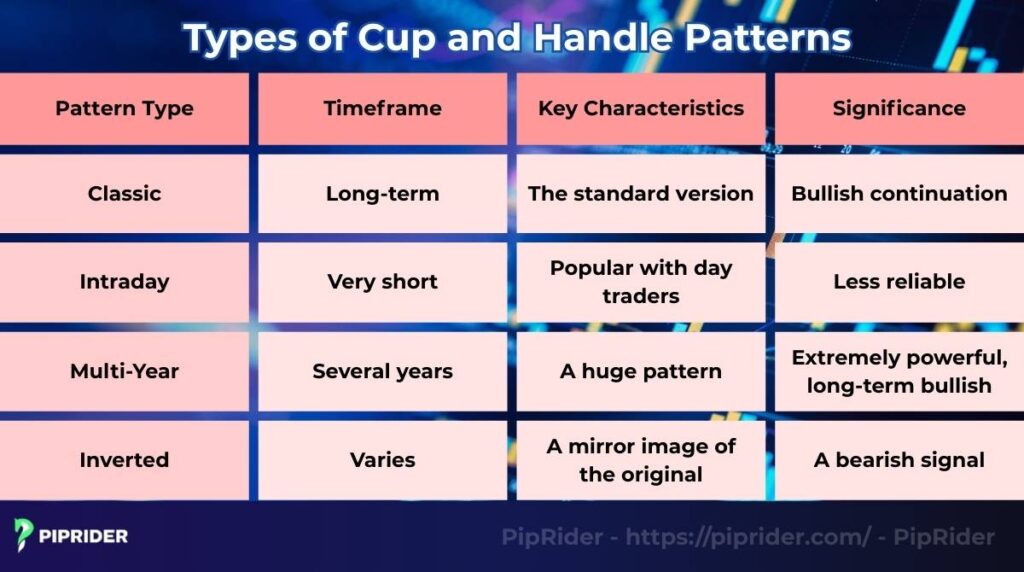
3.1. The Classic Cup and Handle
This is the standard version of the pattern, first popularized by William O’Neil. It is a long-term bullish continuation pattern that typically forms over 7 to 65 weeks on a daily or weekly chart. The classic pattern appears after a significant prior uptrend (at least 30%) and represents a period of healthy institutional consolidation before the trend resumes.
- Pro Tip: To time the breakout from this macro consolidation precisely, savvy traders often zoom into lower timeframes to find micro Continuation Candlestick Patterns forming within the handle itself.
3.2. The Intraday Cup and Handle
The pattern can also form on much shorter timeframes, such as the 5-minute or 15-minute charts. This intraday variation is popular with day traders as it forms and resolves within a single trading session. However, as noted in our “Common Mistakes” section, these shorter-term patterns are generally less reliable and highly prone to false signals due to rampant market noise.
3.3. The Multi-Year Cup and Handle
On the other end of the spectrum, a multi-year cup and handle can form on a weekly or monthly chart, taking several years to complete its base. When an asset successfully breaks out from this massive structure, it is considered an extremely powerful, long-term bullish signal, frequently acting as the launching pad for a secular bull market.
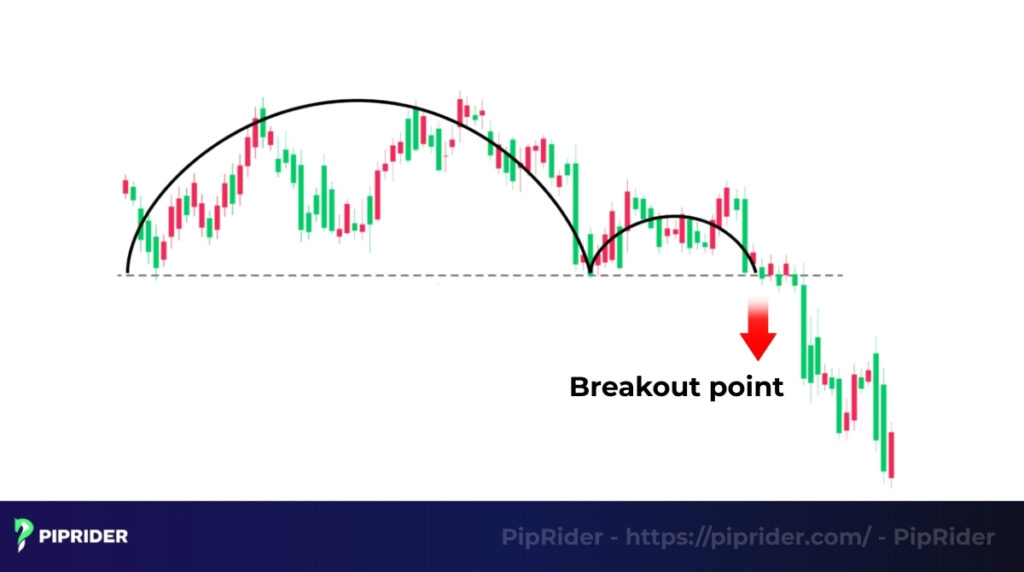
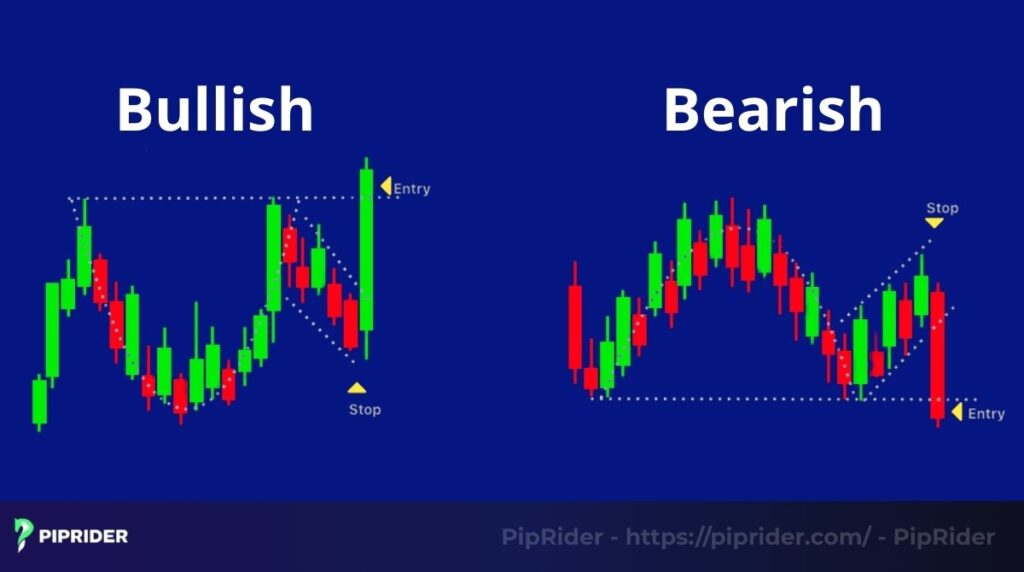
3.4. The Inverted Cup and Handle (Bearish Version)
This is the strict bearish counterpart of the pattern. It features an upside-down “U” shape (indicating distribution) followed by a slight upward-drifting handle (a weak corrective bounce).
- The Signal: A decisive breakdown below the handle’s support line confirms that sellers have overwhelmed the buyers. Depending on its location, this can act either as a top reversal (initiating a new downtrend) or a bearish continuation (accelerating a prior sell-off).
4. How to Trade the Cup and Handle Pattern
Trading this pattern involves a clear, systematic approach. This section will break down the key steps for entry, stop loss placement, and profit-taking.
4.1. Entry Points: Conservative vs. Aggressive
Traders have two main entry options for a cup and handle pattern, each with a different risk profile.
- Conservative Entry (Breakout): Wait for the price to break and close above the handle’s resistance level. Waiting for this move confirms bullish momentum but typically results in a higher entry price.
- Aggressive Entry (Early): Enter within the handle, often as the price bounces off its support trendline. An early entry offers a better price and a tighter stop-loss but carries the risk that the final upward push might fail to occur.
💡 Advanced Tip (Optional): For extra confirmation, you can overlay the Guppy Multiple Moving Average (GMMA). An aggressive expansion of the short-term moving averages away from the long-term group during the breakout provides strong visual validation of bullish momentum.
4.2. Stop Loss Placement
Placing correct stop-loss orders is critical when trading the cup and handle pattern. It defines your risk and protects your capital if the pattern fails. There are two primary placement options, each with a different risk profile.
- Below the Handle (Aggressive): The most common placement is just below the lowest point of the “handle.” This offers a tighter stop, which significantly improves the potential Risk/Reward ratio.
- Invalidation Trigger: A daily close below the handle’s low breaks the immediate higher-low structure, signaling that the short-term breakout thesis is wrong.
- Below the Cup (Conservative): A safer, more conservative placement is below the lowest point of the entire “cup.” This gives the trade much more room to fluctuate and protects against deep shakeouts.
- Invalidation Trigger: A drop below the cup’s absolute bottom completely invalidates the macro Cup and Handle pattern, confirming the setup has fundamentally failed.
💡 Advanced Tip (Optional): When using the aggressive stop, analyze the price action within the handle. If you spot a weak thrusting pattern where bearish candles repeatedly fail to close significantly lower, it confirms seller exhaustion. This controlled pullback justifies keeping your stop-loss tight.
4.3. Profit Taking (Target Calculation) & Trade Management
A key advantage of the pattern is that it provides a clear, logical method for setting a price objective. This removes guesswork and helps traders define their trade’s full potential from the start.
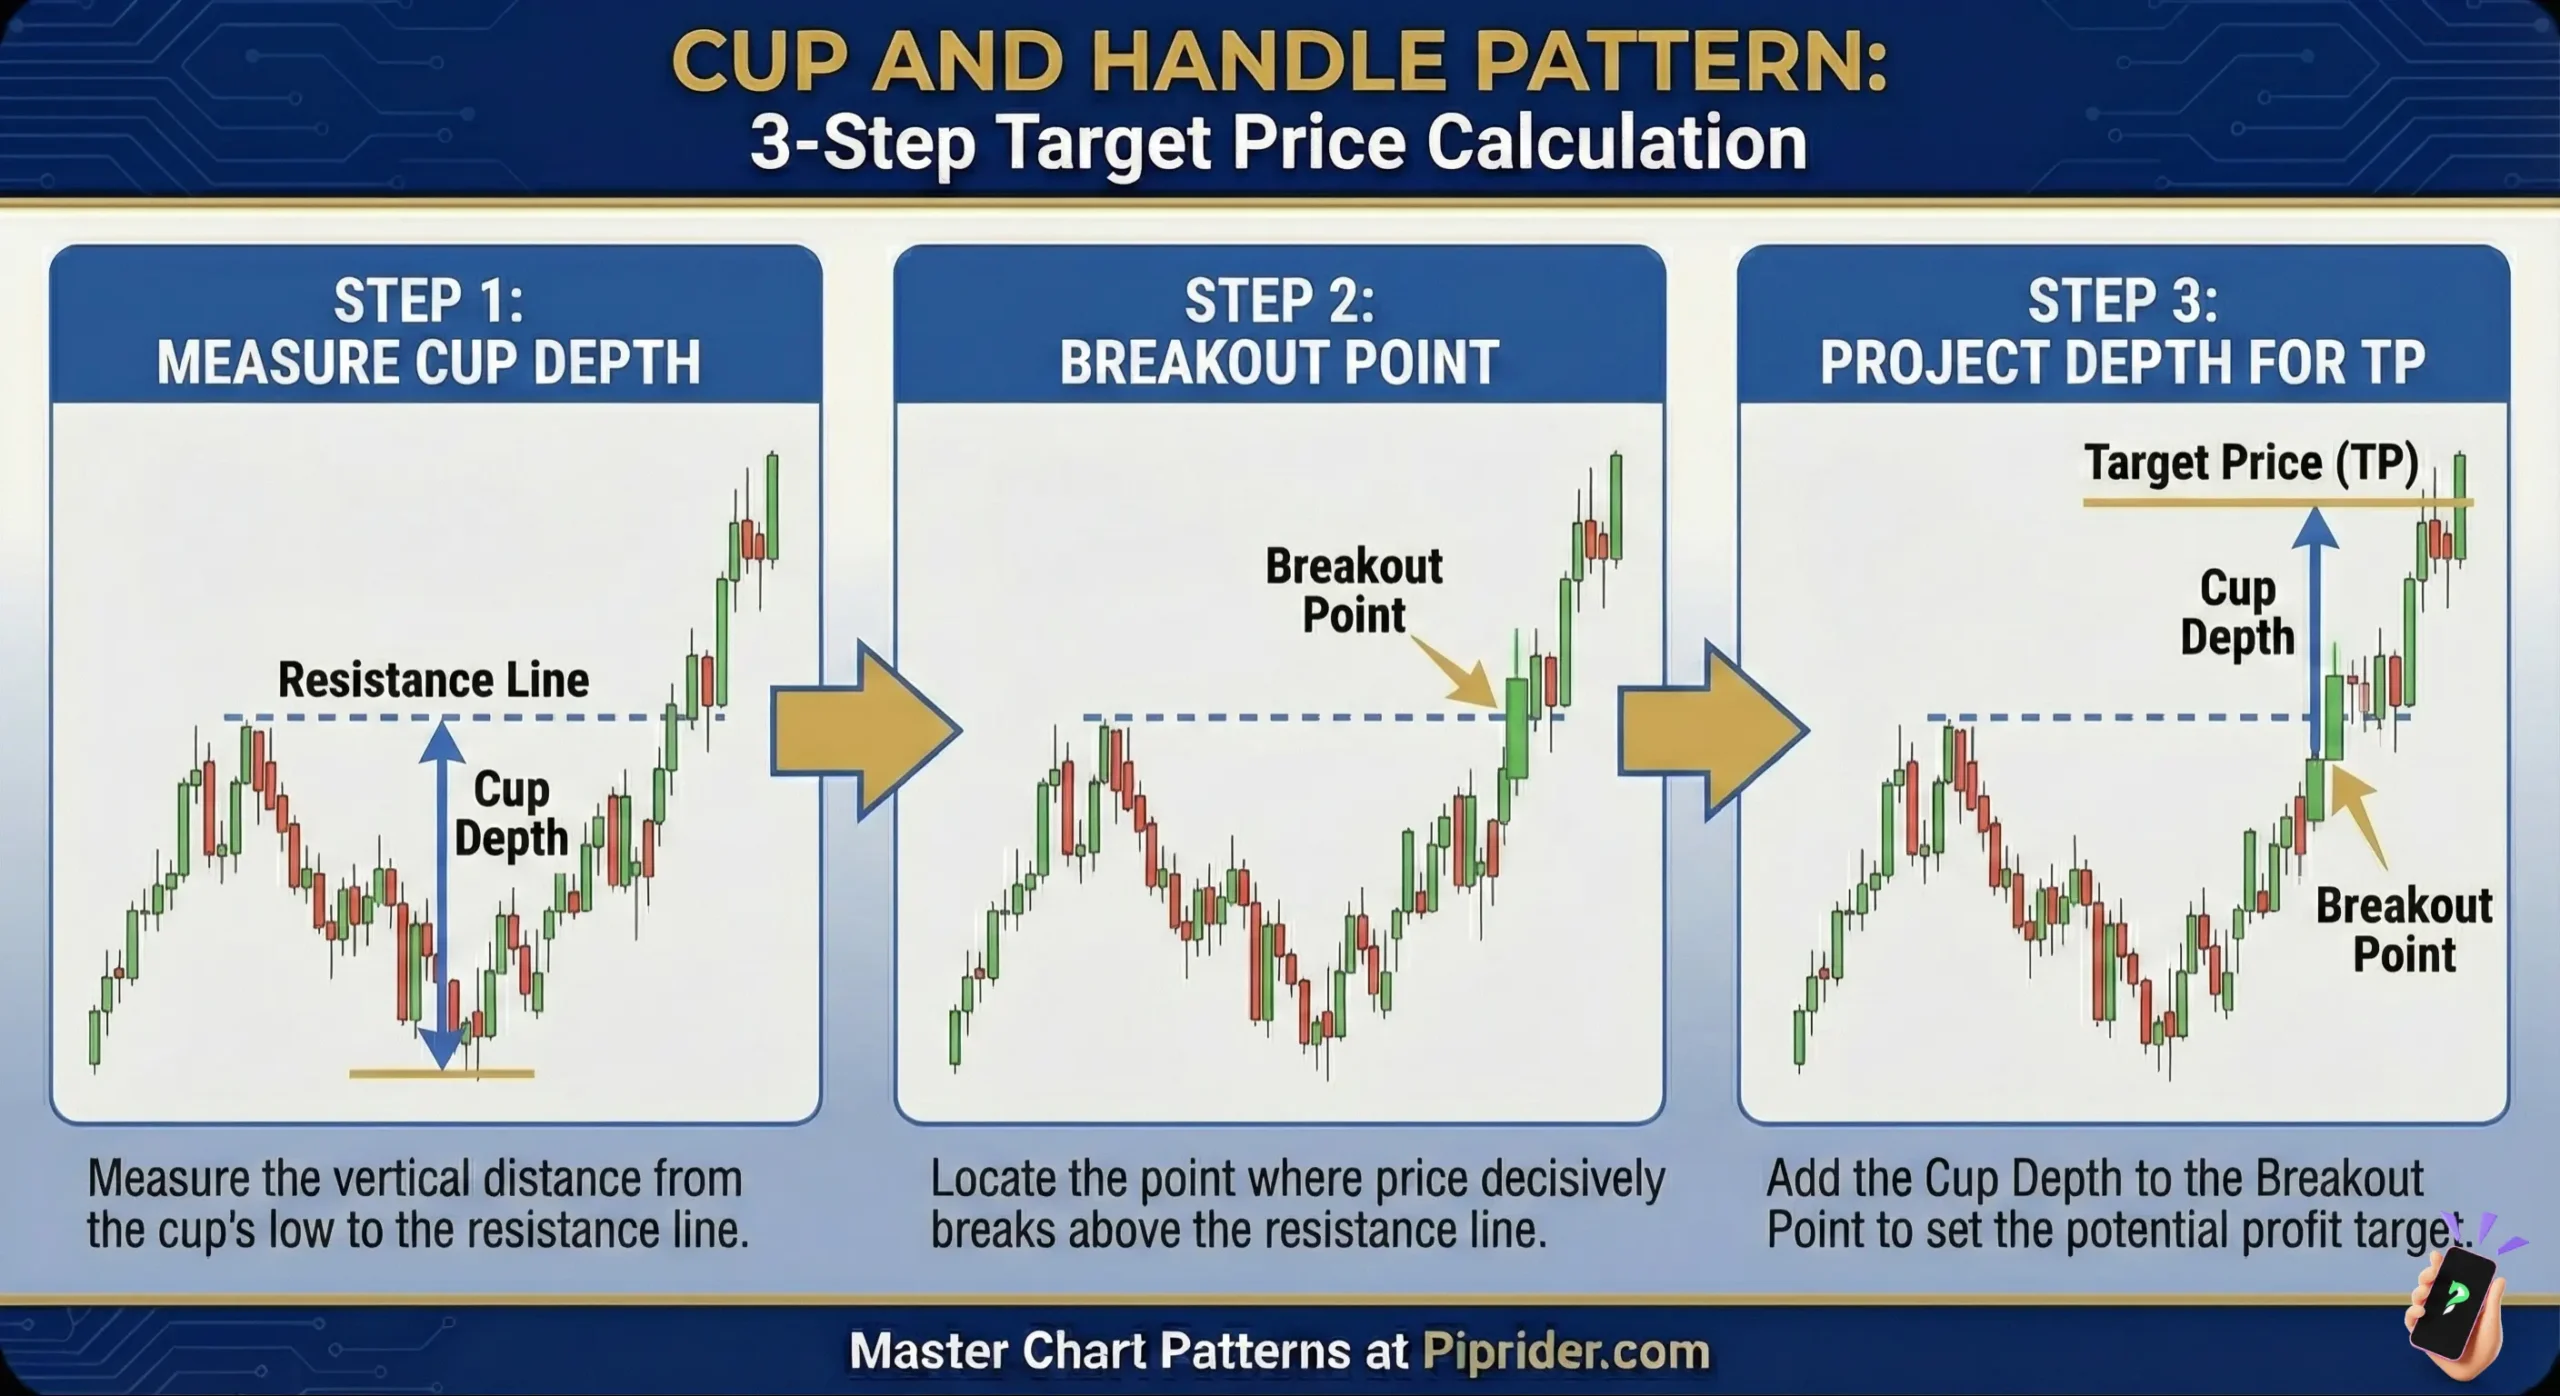
The Calculation Formula
The projected target price is found by adding the Cup Depth (D) to the Breakout Point (B):
The process for calculating this measured move is a simple two-step measurement:
- Measure the Cup Depth (D): Calculate the exact vertical distance (in pips, points, or percentages) from the absolute lowest point of the “cup” up to the rim/resistance level.
- Project the Distance Upward (Target): Take that measured distance (D) and add it to the breakout price.
A Note on Timeframe Proportionality: Consistency is crucial. If you identify the pattern on a Daily (D1) chart, the objective will likely take weeks or months to reach. Do not expect a macro target from a Weekly (W1) chart to be hit in a few intraday sessions.
The “False Breakout” Exit Rule (Capital Protection)
Professional traders do not stubbornly wait for their hard stop-loss to be hit if market behavior changes. You must have a contingency plan for a failed breakout (a “bull trap”).
- The Rule: If the price breaks above the rim but fails to hold, closing back below the resistance level within 1 to 2 candles, the bullish momentum has failed. Immediately reduce your position size or exit the trade entirely to preserve capital.
4.4. Real-World Forex Example: EUR/USD (Daily Chart)
To see how this applies to the currency markets, let’s analyze a classic setup on the world’s most traded pair. In late 2023, EUR/USD provided a textbook continuation setup after a long-term bottoming process.
The Setup & Technical Anatomy
| Component | Price Level / Value | Technical Description |
|---|---|---|
| The “Cup” | 1.0500 to 1.1000 | A rounded “U” base forming over several months of accumulation. |
| The “Handle” | 1.1000 down to 1.0920 | A shallow pullback (less than 33% of cup depth) exhausting last sellers. |
| Resistance (Rim) | 1.1000 | The major psychological level acting as the breakout trigger. |
| Cup Depth | 500 Pips | Calculated as: 1.1000 – 1.0500 = 0.0500 (500 pips). |
The Trade Plan (Execution)
To ensure a high-probability entry and objective risk management, the trade was structured as follows:
- Entry Strategy: A “Buy Stop” order was placed at 1.1015. Entering 15 pips above the rim confirmed that the breakout had enough momentum to clear the psychological resistance at 1.1000.
- Stop Loss (SL): Placed at 1.0910 (just below the handle’s low). This creates a logical safety net if the breakout fails and price returns inside the handle.
- Profit Target (TP): Using the measured move rule, the target was projected as follows:
The Outcome: The pair broke above 1.1000 accompanied by a visible expansion in the Average True Range (ATR). By prioritizing the daily candle close and session liquidity, the trade successfully reached the 1.1500 objective over the following months, yielding a strong Risk/Reward ratio of approximately 1:4.6.
4.5. Real-World Stock Example: NVIDIA (NVDA) – Pre-Split
To demonstrate the pattern’s power in centralized markets with real exchange volume, let’s look at NVIDIA (NVDA) in early 2024. Before its historic 10-for-1 stock split, the asset formed a massive consolidation base that signaled the next leg of its AI-driven rally.
The Setup & Technical Anatomy
| Component | Price Level / Value | Technical Description |
|---|---|---|
| The “Cup” | $750 to $950 | A multi-month rounded bottom (Feb–April 2024) indicating institutional accumulation. |
| The “Handle” | $950 down to $920 | An orderly pullback in May 2024 with declining volume before the final surge. |
| Resistance (Rim) | $950 | The critical psychological level and pre-split all-time high resistance. |
| Cup Depth | $200 | Calculated as: $950 (Rim) – $750 (Bottom) = $200. |
The Trade Plan (Execution)
- Entry Strategy: A buy stop order was placed at $955. This ensured the entry occurred only after a confirmed daily close above the $950 rim, filtering out intraday noise.
- Stop Loss (SL): Placed at $910 (just below the handle’s low). This protected capital against a failed breakout.
- Profit Target (TP): The minimum price objective was projected as follows:
The Outcome: In late May 2024, the price surged above $955 with a massive spike in Exchange Volume. NVDA reached the $1150 target within weeks, just before the company executed its 10-for-1 stock split in June, marking one of the most successful technical setups of the year.
5. Indicators to Confirm the Cup and Handle Pattern
While the cup and handle pattern is a powerful price action signal on its own, its reliability increases significantly when confirmed by other technical indicators. This alignment of signals, known as “confluence,” is exactly what professional traders look for before risking capital.
- Moving Averages (Trend Filter): A key confirmation is when the “handle” of the pattern forms above a major moving average, such as the 50-period Exponential Moving Average (EMA). This dynamic support proves the pullback is shallow and the primary uptrend remains fiercely intact.
- Relative Strength Index (Momentum): During the formation of the “handle,” the RSI provides valuable hidden insights. If the RSI respects the neutral zone (staying above the 40–50 level) and begins hooking upward as the price approaches the rim, it confirms that bullish momentum is reloading.
- Volume & Volatility (The Catalyst): Confirmation depends on your market. For centralized markets (stocks/crypto), a valid breakout requires a surge in real exchange volume, while the On-Balance Volume (OBV) indicator can confirm institutional accumulation during the cup’s base. For spot Forex, rely on Tick Volume spikes or a sudden expansion in the Average True Range (ATR) as your proxy for market participation.
- Bollinger Bands (Volatility Contraction): Bollinger Bands beautifully map the low-volatility period during the handle’s formation. A “Bollinger Band Squeeze”—where the bands contract tightly around the handle’s shallow pullback—often precedes an explosive, high-momentum breakout, adding a final layer of confirmation.
6. Advantages and Disadvantages of the pattern
Like many trading patterns, the cup and handle has a unique set of strengths and weaknesses. Understanding both is key to effectively incorporating it into your trading.
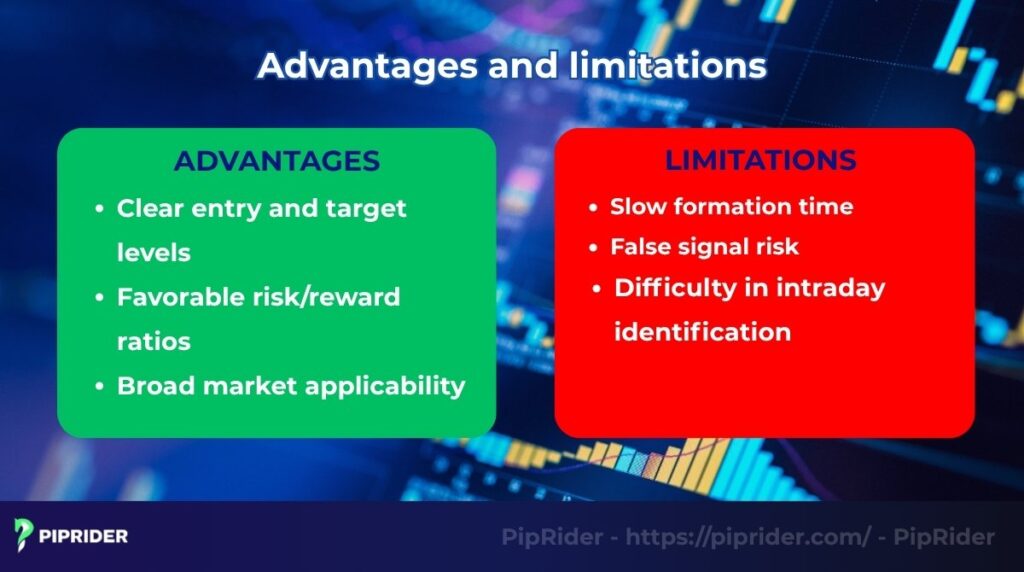
6.1. Advantages
When identified correctly, the pattern offers several distinct advantages for traders:
- Clear entry and target levels: The pattern provides a clear entry level for a trade and a logical, easy-to-calculate price target.
- Favorable risk/reward ratios: The structure often allows for a tight stop-loss relative to a large potential profit target.
- Broad market applicability: The psychology behind the pattern is universal, making it effective in stocks, forex, and crypto. A clear advantage is the powerful signal confirmed by volume.
6.2. Disadvantages
However, traders must also be aware of the pattern’s potential drawbacks:
- Slow formation time: A classic cup and handle can take months to form, requiring significant patience.
- False signal risk: Like any breakout pattern, it is susceptible to “false signals” that quickly reverse.
- Difficulty in intraday identification: The pattern is less reliable on lower timeframes due to higher market noise.
7. Common Mistakes to Avoid When Trading the Cup and Handle
When executing the cup and handle strategy, traders frequently experience reduced win rates due to structural misidentifications or poor risk management. The most common mistakes include anticipating the breakout, trading invalid base shapes, and ignoring volume confirmation.
To improve setup quality, ensure you avoid these six technical pitfalls:
- Premature Entry (Anticipating the Breakout): Entering the market while the “handle” is still forming increases exposure to a pattern failure. Correction: Always wait for a decisive candle close above the resistance line to confirm the breakout.
- Trading a “V-Shaped” Base: A valid pattern requires a rounded, “U-shaped” bottom, which indicates a gradual transfer of supply to institutional buyers (accumulation). A sharp “V” bottom reflects rapid volatility rather than a stable consolidation base.
- Accepting a Deep Handle Retracement: The handle must be a shallow pullback. If the price retraces more than 50% into the cup’s depth, it signifies sustained selling pressure rather than a temporary pause, invalidating the pattern’s structural logic.
- Ignoring Volume or Volatility Confirmation: A breakout on low activity has a high probability of reverting into a false breakout (bull trap). The move must be validated by a surge in exchange volume (for equities) or an expansion in tick volume and ATR (for spot forex).
- Applying to Intraday Timeframes Without Filters: The pattern loses reliability on lower timeframes (e.g., 1-minute or 5-minute charts) due to market noise. If traded intraday, setups must strictly align with the macro trend and occur during high-liquidity session overlaps (e.g., London/New York).
- Trading Without Defined Risk Parameters: Executing the setup without a predefined stop-loss (invalidation level) or a measured profit objective negates the mathematical advantage of the pattern.
8. FAQs
9. Summary: A Powerful Tool for Bullish Setups
The cup and handle pattern provides traders with a robust framework for identifying potential continuation moves, setting objective stop-losses, and calculating logical profit targets.
When confirmed with a surge in buying activity and aligned with other technical indicators, this classic formation helps traders avoid impulsive decisions. While no pattern guarantees a win, the Cup and Handle offers a highly structured, asymmetric Risk/Reward approach to the markets that has stood the test of time since William O’Neil first popularized it.
To continue developing your chart-reading skills and edge, we encourage you to explore more in-depth guides in our Analysis category on Piprider.
Disclaimer: The content provided in this article is for educational and informational purposes only and does not constitute financial or investment advice. Trading in financial markets, including stocks, forex, and cryptocurrencies, involves a high degree of risk and may not be suitable for all investors. Always conduct your own research or consult with a licensed financial advisor before making any trading decisions.
Infographic Section
-
Cup and Handle Pattern -
Cup and Handle Pattern: 3 step Target Price Calculation -
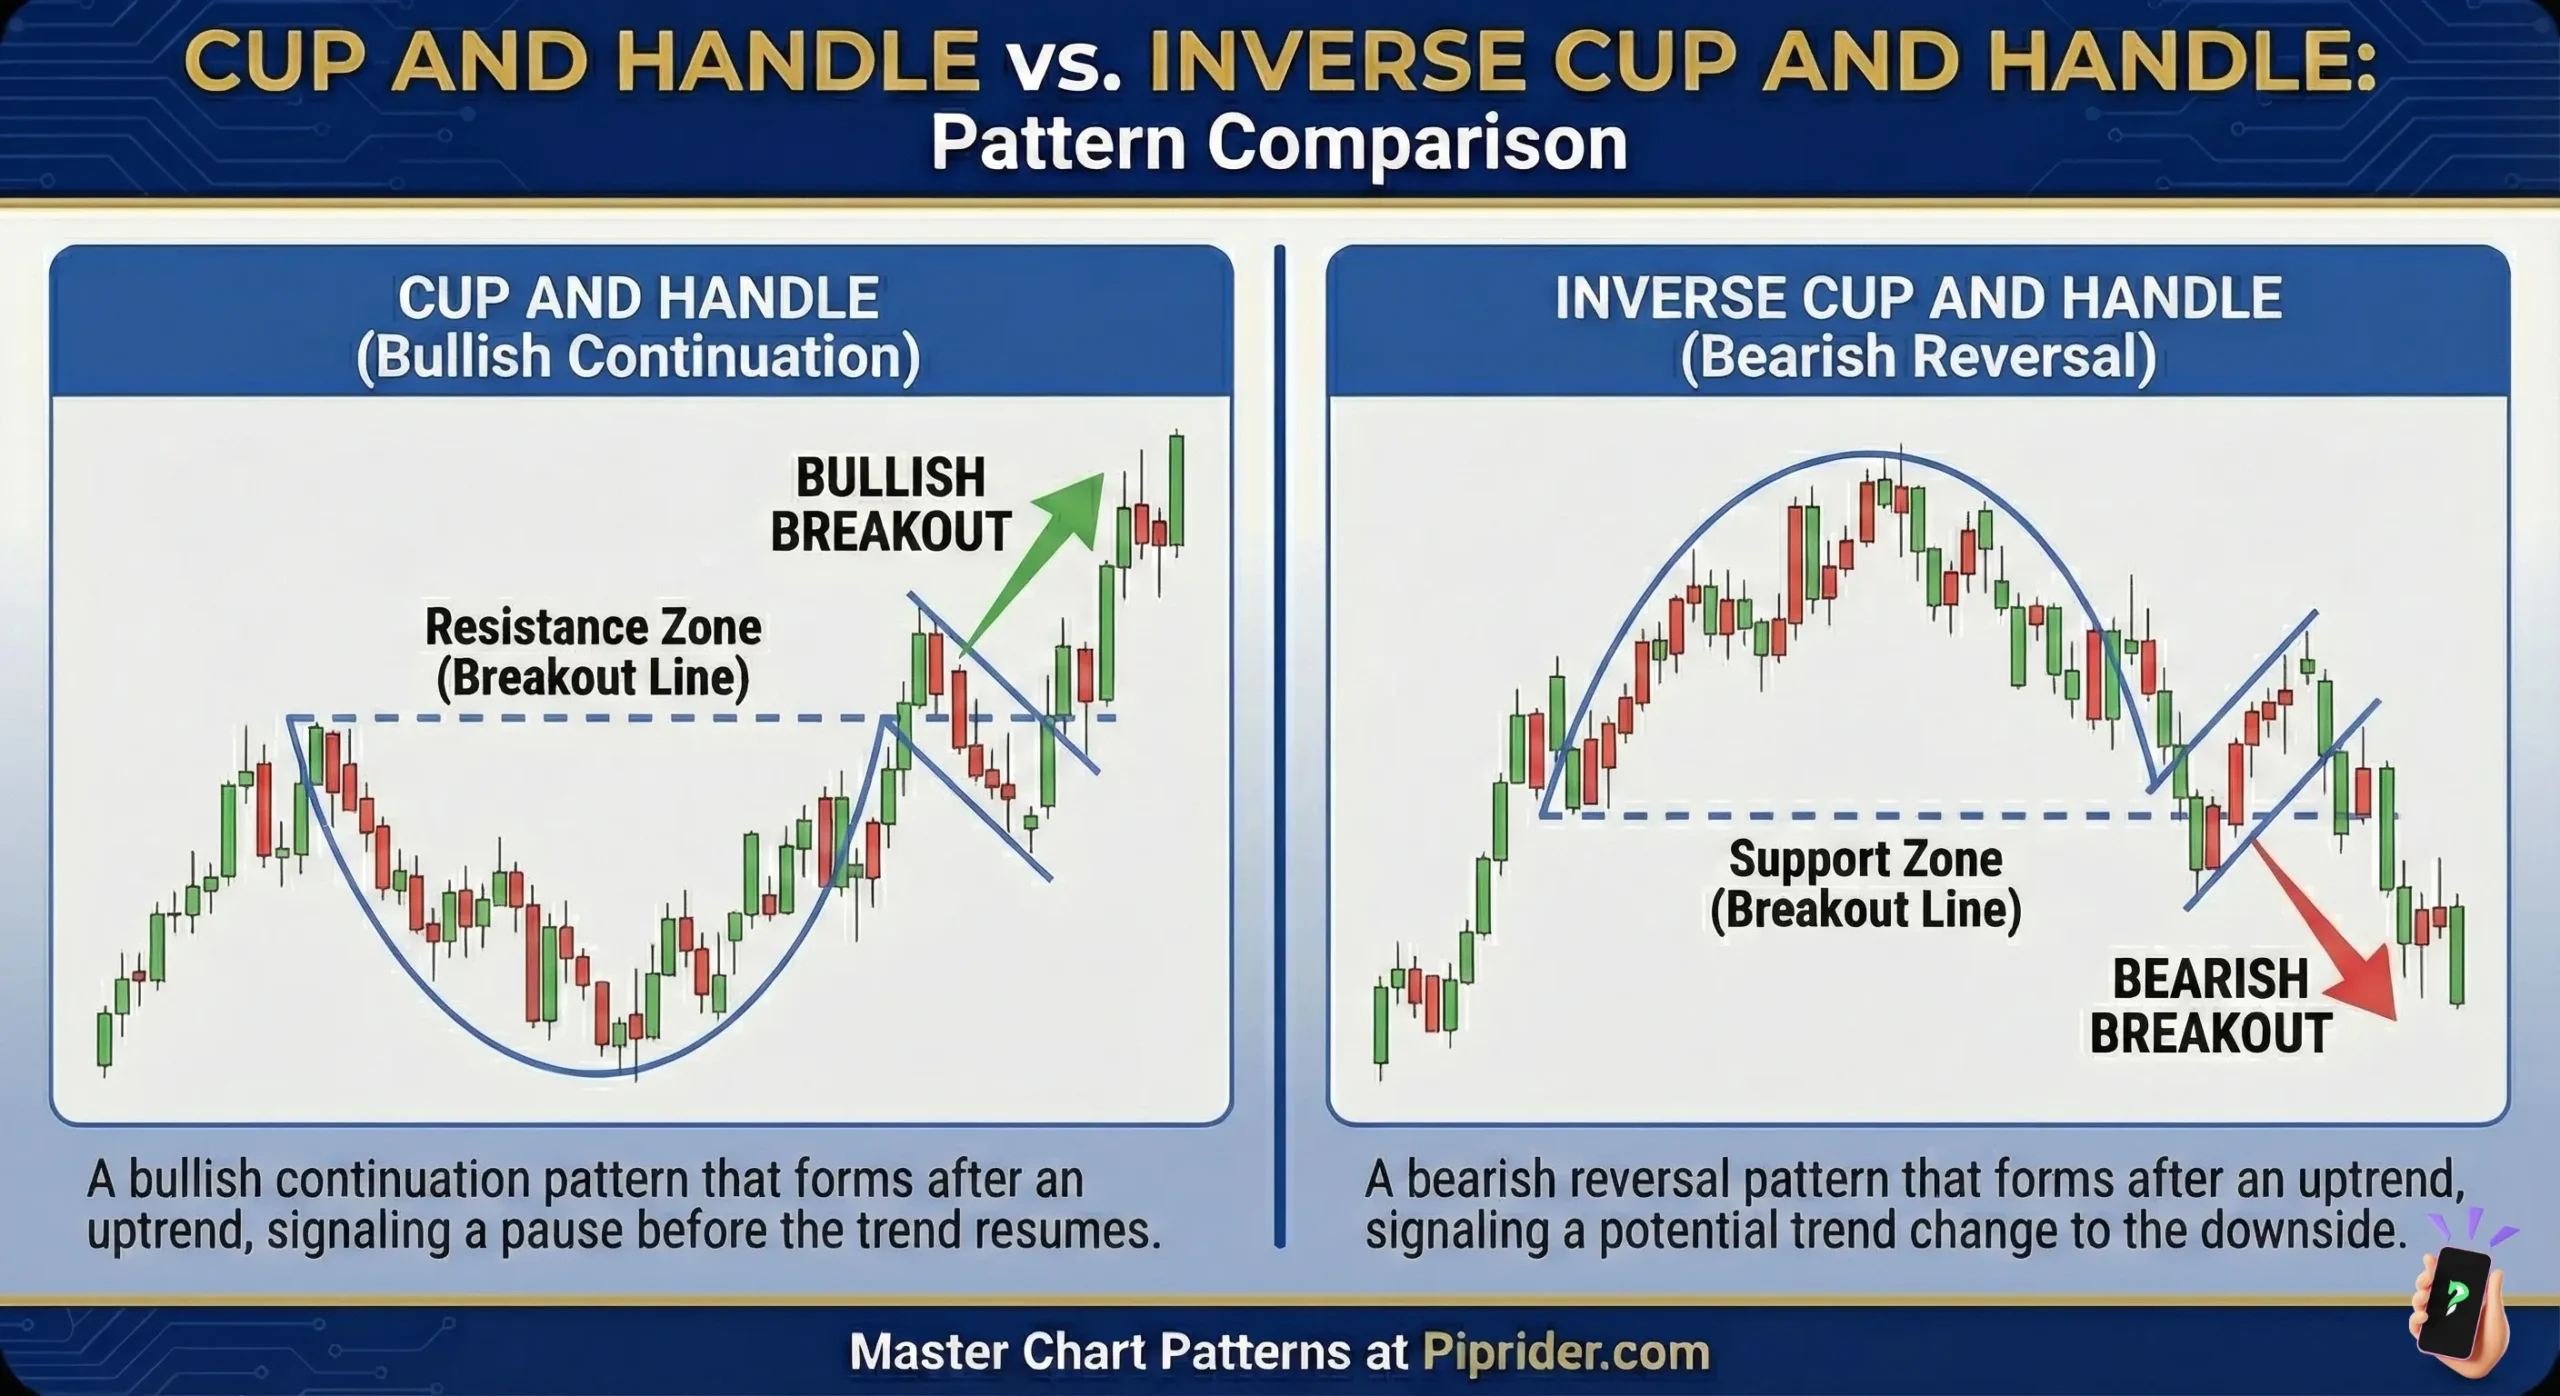
Cup & Handle vs. Inverse Cup & Handle


