
Manually drawing Support and Resistance lines is subjective, time-consuming, and prone to error. Professional traders solve this by using Forex Level Indicators to automate the process.
This comprehensive guide provides a curated shortlist of the best level tools, distinguishing between “Plotters” (which automatically draw zones for you, like Pivot Points) and “Confirmers” (which validate price reactions, like RSI).
Below, we break down exactly which indicators you need and how to combine them with Price Action to spot high-probability entries with precision.
Key Takeaways
-
Key levels are the foundation of market structure where significant price reactions occur.
-
Level plotters (like Pivot Points & Auto S/R) automatically draw these zones, saving you time.
-
Level confirmers (like RSI & MACD) validate the momentum when price hits a level.
-
A solid strategy combines an auto-drawn level with a specific price action trigger.
-
Avoid clutter by selecting just one tool from each category in our shortlist.
1. What are Forex levels? And why they are vital for traders
In trading, forex levels are specific price areas that act like magnetic zones, causing the market to react. The most basic forms are support (a price floor that props up the price) and resistance (a price ceiling that pushes it down) (BabyPips, n.d.).

A more advanced view is to see Forex levels not as thin lines, but as broader supply zones and demand zones. A supply zone is an area full of sellers, while a demand zone is packed with buyers.
💡 Pro Tip: Levels Are Zones, Not Lines
Novice traders draw levels as thin, precise lines (e.g., exactly at 1.0500). This is a mistake.
Institutional orders are not placed at a single price point but are clustered around a value. Therefore, always treat Support and Resistance as rectangular zones (e.g., 1.0490 to 1.0510). If price pierces your line but stays within the zone, the level is still valid.
For a trader, identifying these key price levels is a vital skill. Forex levels provide the context traders need to make sense of a market’s price movements, allowing them to plan the entries, place strategic stop-losses, and set logical profit targets.
To truly grasp their importance, compare analyzing a chart with and without levels. Without them, the chart is chaotic noise, a series of random up and down ticks.
From a price action (PA) perspective, not all levels are created equal. The most reliable levels share these signs:
- Sharp rejections: The price moves away from the level with speed and force, signaling a strong imbalance.
- Multiple touches: The level has been tested repeatedly in the past and has held firm, proving its significance over time.
- A role reversal: An old support level that, once broken, becomes a new resistance level (or vice versa). This “flip” is a powerful confirmation signal.
2. What are forex levels indicators and how do they work?
Strictly speaking, a “Forex Level Indicator” is not just a tool that draws a line. It is any technical instrument that helps you identify where the price is likely to react and how it behaves at that point.
Instead of thinking of them as a single type of tool, professional traders categorize them into three distinct groups based on their function:
- The Architects (Plotters): Tools that automatically calculate and draw static support and resistance zones based on historical formulas (e.g., Pivot Points, Auto S/R).
- The Guides (Dynamic): Tools that create moving levels that adapt to the trend speed (e.g., Moving Averages, Bollinger Bands).
- The Judges (Confirmers): Tools that do not draw levels on the main chart but validate whether a level will hold or break (e.g., RSI, MACD).
How do they work? At their core, these indicators operate by eliminating emotion. They apply mathematical algorithms to historical data (Highs, Lows, and Closing prices) to project objective data points.
- The Advantage: They provide an unbiased “map” of the market, instantly highlighting zones you might miss with the naked eye.
- The Disadvantage: They are derivative tools. If you rely on them blindly without checking the current market context (like news or strong momentum), you risk trading against the real flow of money.
3. Types of Tools for Trading Key Levels
The world of trading tools can be overwhelming. To use them effectively, we must categorize them by their specific function. Not all “level indicators” do the same job: some draw the map (plotters), some move with the market (dynamic), and others validate the trade (confirmers).
3.1. Level Plotters (Tools that Create Zones)
These are the true “level indicators.” They automatically calculate and draw static horizontal lines on your chart based on mathematical formulas or past price structure.
3.1.1. Pivot Points – Objective Intraday Support/Resistance
Unlike subjective trendlines, Pivot Points indicator are strictly mathematical and remain fixed throughout the day. The indicator calculates a central Pivot (PP) using the previous period’s data (Investopedia, 2025):
From this central baseline, it projects multiple Support (S1, S2) and Resistance (R1, R2) levels. Because these levels are visible to everyone and used by institutional algorithms, they become self-fulfilling prophecies. They are most effective for intraday trading, particularly during the high-volume London and New York sessions, where price often reacts sharply to these pre-defined zones.
3.1.2. Auto Support/Resistance Indicators
These are custom scripts (often based on Fractals or ZigZag logic) that scan historical data to find swing points where price has rejected multiple times. Instead of you spending hours drawing resistance lines, the tool instantly highlights the most tested supply and demand zones.
- Best for: Saving time and removing human bias in identifying zones.
3.1.3. Fibonacci Retracement (The Natural Ratio)
While Fibonacci Retracement is often drawn manually, auto tools exist. These project hidden levels based on the ‘golden ratio’ (38.2%, 50%, 61.8%). After a strong impulse move, these levels act as invisible barriers where a correction is likely to stop.
- Note: Even though it creates specific price targets, it is technically a “plotter.”
3.2. Dynamic Levels (Levels that Move)
Static lines stay in one place, but the market moves. Dynamic indicators adapt to price action, creating dynamic support and resistance zones that follow the trend.
3.2.1. Moving Averages (SMA/EMA)
In a strong trend, the price rarely moves in a straight line; it pulls back. A key Moving Average (like the 50 EMA or 200 SMA) acts as a “dynamic floor” in an uptrend. Traders watch for the price to touch the line and bounce off it, treating the average itself as a support level.
3.2.2. Bollinger Bands (Volatility Envelopes)
Bollinger Bands expand and contract based on market volatility. The upper and lower bands act as dynamic support and resistance (StockCharts, n.d.). When the price touches the outer band in a ranging market, it is statistically extended, often leading to a “snap back” toward the center.
3.2.3. Ichimoku Cloud (Future Zones)
The Ichimoku Cloud projects a shaded area forward in time. This cloud is not just a line; it is a thick zone of dynamic support and resistance. A price above the cloud signals a bullish trend (cloud acts as support), while below means bearish (cloud acts as resistance).
3.3. Level Confirmers (Momentum & Reaction)
Critical distinction: These tools do not draw lines. Instead, they act as a “lie detector” when price hits a level. Use them to filter out fakeouts.
3.3.1. RSI (Relative Strength Index)
Don’t just look for Overbought/Oversold signals. The real value is Divergence. If price hits a Support Level making a new Lower Low, but the RSI makes a Higher Low, it confirms that selling momentum is dead and the Support level is likely to hold.
3.3.2. MACD (Moving Average Convergence Divergence)
Use MACD to judge breakout strength. If price approaches a major Resistance level but the MACD Histogram is shrinking (getting closer to zero), it indicates “momentum decay.” This suggests the price lacks the energy to break through, signaling a potential reversal off the level.
3.3.3. Stochastic Oscillator
Stochastic Oscillator is your specialist for ranging markets. When price hits a static Resistance line, do not sell immediately. Wait for the Stochastic lines to cross down and exit the Overbought zone (StockCharts, n.d.). This specific “hook” confirms that the ceiling has officially rejected the price.
Summary Table: Choosing the Right Tool
| Category | Indicator | Function | Best Used For |
|---|---|---|---|
| Plotter | Pivot Points | Math-based S/R | Intraday targets & reversals. |
| Plotter | Auto S/R | Historical zones | Finding supply/demand zones quickly. |
| Plotter | Fibonacci | Ratio projections | Retracements in a trend. |
| Dynamic | Moving Averages | Trending S/R | Pullback entries (e.g., bounce off 50 EMA). |
| Dynamic | Bollinger Bands | Volatility limits | Reversals in sideways markets. |
| Confirmer | RSI / MACD | Momentum check | Spotting Divergence at a key level. |
| Confirmer | Stochastic | Turning point | Timing entries in a range. |
4. How to use level indicators effectively?
An indicator on its own is just a suggestion. A real, high-probability breakout signal only happens when the indicator’s level aligns with what the price itself is telling.
⚡ The Pro Level Trading Playbook
Save this checklist for your daily trading routine.
4.1. How to actually read an indicator’s signal
Reading an indicator’s signal requires distinguishing the alert from the execution trigger. The signal is not when the price simply touches a moving average or a pivot point; that is merely an alert of a potential setup.
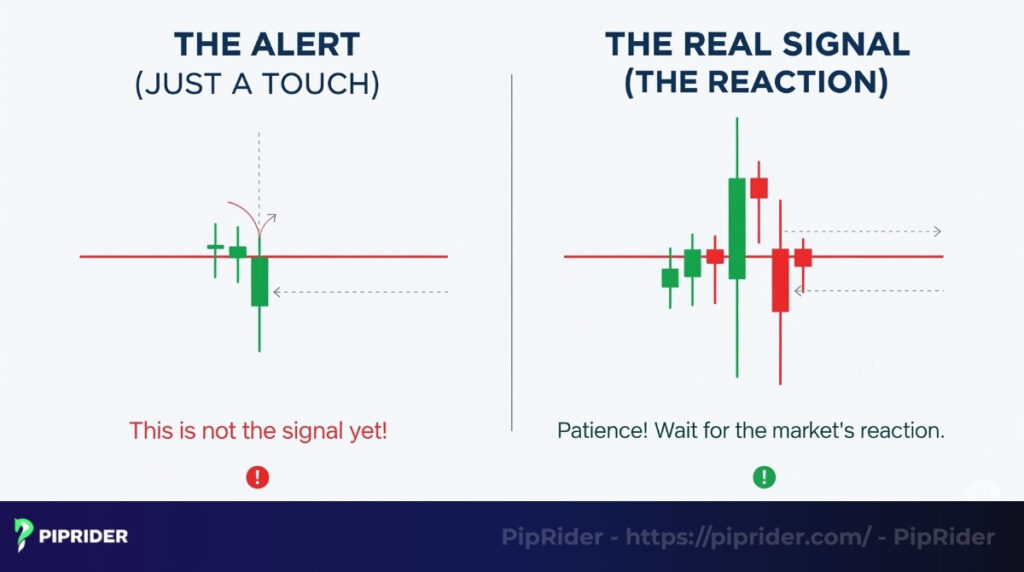
The true signal lies in the subsequent price action. A trader must assess the market’s reaction: Is the level being respected, causing a decisive rejection of the price? Or does the price slice right through without hesitation?
Patience is critical here. Entering the market the moment a level is touched often leads to premature entries and potential losses. The systematic approach requires waiting for the market to confirm its intended direction before committing capital.
4.2. Combining signals with price action (PA)
You should use price movement to confirm the indicator’s identified level.
- Confirmation Candles: When price hits a key support or resistance level, you must wait for a Pin Bar or a bullish engulfing candle. These chart patterns confirm that institutional buyers or sellers have stepped in and are rejecting the extreme prices. This rejection should also be corroborated by a spike in trading volume.
- Analyze Market Structure: Look for a clear Break of Structure (BoS) or trend failure. For instance, if a downtrend is making lower lows and lower highs, and then fails to make a new Lower Low (LL) at the support level, that provides a strong clue that the trend might be reversing.
4.3. How to read confluence zones
Confluence is when multiple technical confirmation signals all point to the same conclusion, creating a high-probability setup. It’s like having several expert opinions all agreeing.
- What to look for: A confluence zone could be a place on the chart where a horizontal resistance level lines up perfectly with the 200 EMA and a 61.8% Fibonacci retracement level.
- Why it works: When so many different factors align, traders know that many different types of traders are all watching the same spot. This increases the odds of a strong reaction. I always feel much more confident taking a trade in a clear confluence zone.
4.4. A Real-World Strategy Example: The “Pivot Bounce”
Let’s put it all together using a classic strategy: Trading a bounce off a Pivot Point in an uptrend.
Step 1: Identify the Level (The Map)
- You open your chart and see the price dropping towards the Daily Pivot S1 (Support 1).
- Tool: Standard Pivot Points.
Step 2: Apply the Filter ( The Context)
- Check the long-term trend. Is the price trading above the 200 EMA?
- Check: Yes. This confirms we are looking for buy setups only. Do not sell into support in an uptrend.
Step 3: Wait for the Trigger (The Confirmers)
- Do not place a “limit order” blindly at S1. Wait for price action.
- Observation: Price touches S1 and forms a Bullish Pin Bar (long wick at the bottom).
- Confirmation: At the same time, RSI (14) shows Bullish Divergence (Price made a lower low, RSI made a higher low).
Step 4: Execution (The Trade)
- ENTRY: Place a Buy Stop order 2 pips above the high of the Pin Bar.
- STOP LOSS: Place SL 5–10 pips below the low of the Pin Bar (and below the S1 line) to account for volatility.
- TAKE PROFIT:
- Target 1: The central Pivot Point (PP).
- Target 2: Resistance 1 (R1).
4.5. Important tip: Never rely 100% on an indicator
An indicator assists your decision-making, not to make the decision for you. Blindly following any indicator without understanding the context of the market and without waiting for movement of prices to confirm your idea is a recipe for disaster. Be a thinker, not a follower.
5. Common mistakes when using forex level indicators
Tools are only as good as the person using them, and indicators are no exception. But if traders abuse indicators without understanding their core logic, they can become ‘chart blind’ and lose the analytical edge.

Learning to avoid them and other pitfalls, such as false breakouts, will save a lot of frustration and, frankly, a lot of money. Let’s walk through the most common traps.
5.1. Over-relying on indicator and ignoring logic
This happens when a trader stops analyzing or thinking critically. Instead of asking why a setup makes sense or checking the broader market context, the trader relies solely on a “buy” or “sell” arrow.
The reality is that indicators cannot interpret news or fundamental data; they are merely one piece of the puzzle. Failing to verify a technical signal against the macro environment exposes the position to unnecessary risk.
5.2. Using too many indicators and creating “analysis paralysis”
Loading a chart with redundant tools, multiple moving averages, and several oscillators is a common error. The result is a screen cluttered with conflicting data and signals. When indicators send contradictory messages (e.g., MACD says sell, Stochastic says buy), the trader often freezes. This state of indecision, known as “analysis paralysis,” results directly from using too much conflicting data.
5.3. Not backtesting before using real money
Entering the market with real money based on an untested strategy found on a public forum is an act of gambling, not trading.
The danger lies in having no statistical data on the strategy’s historical performance. Without verifying whether the indicator combination works in trending versus ranging environments, a trader exposes their account to unnecessary and undefined risk.
5.4. How to fix these mistakes: Piprider’s advice
Avoiding these common pitfalls requires two core, disciplined principles:
- Simplify the Charts: The most important step is choosing a maximum of two non-correlated indicators (e.g., one trend filter and one oscillator) for confirmation. A clean chart supports clear, decisive thinking.
- Understand the Logic: You must understand the underlying logic of their tools. When the trader understands why a level (like the 200 EMA) is reliable, they can use it intelligently and confidently instead of blindly following a line.
6. How to install and download recommended indicators
Let’s get these tools onto the charts. It’s easier than you might think. PipRider will walk you through the process for the two most popular platforms, TradingView and MetaTrader 4 (MT4).
🛡️ Safety First: The “Vetting” Checklist
Before installing any auto support resistance indicator for MT4/MT5, run this safety check to protect your funds.
- 1. Check Source: Only download from MQL5 Market or TradingView. Avoid executable files from Telegram groups.
- 2. File Type: Prefer source code (.mq4 / .mq5). Be extremely cautious with .dll files (malware risk).
- 3. Virus Scan: Upload the file to VirusTotal.com. If even one vendor flags it, delete it immediately.
- 4. Sandbox Rule: Never install directly on a Live Account. Test on Demo first to ensure stability.
6.1. For TradingView users
On TradingView, adding an indicator is incredibly straightforward.
- Step 1: Find the “Indicators” button. You can find it located in the main toolbar at the top of the screen.
- Step 2: Search for an indicator. A window will pop up. Search for built-in classics like “Moving Average Exponential” or “RSI.” For custom tools made by the community, browse the “Community Scripts” tab.
- Step 3: Click to add. Just select the desired indicator from the list, and it will be applied to the chart immediately.
Tip: Once you have a setup you like (e.g., a 50 EMA and an RSI), save it as a “Chart Layout.” This lets you load the favorite toolset onto any chart with a single click.
6.2. For MetaTrader 4 (MT4) users
MT4 is a bit more ‘old school’, but it’s a workhorse. Installing a custom indicator usually involves adding a file (with a .ex4 or .mq4 extension) to the right folder.
- Step 1: Download the indicator file. Download the indicator file from a reputable source onto the computer.
- Step 2: Open data folder. In MT4, go to the top menu and click File -> Open Data Folder.
- Step 3: Place the file. A new window will open. Navigate to the MQL4 folder, and then into the Indicator folder.
- Step 4: Drag and drop your downloaded .ex4 file into this folder.
- Step 5: Refresh or restart. Close and reopen MT4, or right-click on “Indicator” in the “Navigator” panel and hit “Refresh.” Your new indicator will now be in the list, ready to be dragged onto a chart.
Tip: Be extremely careful where you download files from. Stick to well-known communities like the official MQL5 marketplace. Avoid any site selling a ‘guaranteed profit’ indicator for $99.
6.3. How to adjust basic indicator settings
Once an indicator is on your chart, you can almost always customize it.
- Move your cursor over the indicator’s name on the chart to reveal the settings icon (typically a small gear).
- The “Inputs” tab allows you to modify the indicator’s main parameters. For example, you can change a moving average’s Length from 50 to 200, or the RSI’s Length from the standard 14.
Tip: Don’t change settings randomly. Understand why you are changing them. Only adjust parameters if you are testing a specific strategy that calls for it. The default settings are often the standard for a good reason.
7. FAQs – Common questions about forex level indicators
Here are some quick, straight-to-the-point answers to the questions I get asked most often.
8. Conclusion and a look at advanced strategies
Ultimately, forex level indicators are powerful tools, but they are no substitute for a trader’s critical thinking. Use them to guide your analysis, not to replace it. This is the key takeaway we hope you remember.
When you are ready to elevate your trading, the next skill to master is multi-timeframe analysis. This technique involves finding a major key level on a daily or weekly chart and then hunting for precise entries on a lower timeframe, creating powerful confluence zones. Mastering this will truly change how you see the market and manage your risk.
Be sure to follow Piprider to read more useful articles about other Forex indicators at Learn Forex section.


