
The Half Trend indicator is a non-repainting technical tool designed to simplify trend identification using Average True Range (ATR) calculations. It excels at capturing sustained moves in strong trending environments but requires a secondary filter during sideways consolidation to avoid false signals. This guide covers how to filter out these false signals, apply dynamic risk management, and configure optimal settings for both Scalping and Swing trading.
Key Takeaways
- ATR-Based Logic: The indicator uses Average True Range to identify the trend direction, displayed as a color-coded line (Blue for Uptrend, Red for Downtrend).
- Non-Repainting: Unlike many custom tools, the Half Trend signals are permanent once the candle closes. They will not vanish or shift position later.
- Optimal Environment: The tool excels in strong trending markets but is prone to false signals in sideways (ranging) conditions.
- Mandatory Filter: To reduce “whipsaws,” always combine the Half Trend with a 200 EMA to ensure you are trading in the direction of the long-term momentum.
1. What is the half trend indicator?
The Half Trend is a custom technical analysis tool that identifies trend direction by combining the Average True Range (ATR indicator) with the market’s recent Highs and Lows.
Unlike standard Moving Averages that simply smooth out closing prices, the Half Trend applies a unique “Amplitude” filter. This sophisticated mechanism allows the indicator to ignore minor price spikes (noise) and only react when a legitimate trend reversal occurs.
Visually, the indicator is far simpler than complex overlays like the Guppy Multiple Moving Average. It appears as a single non-repainting “stepped” line that changes color to signal the market bias: Blue for an uptrend and Red for a downtrend. This makes it a dual-purpose tool used for both spotting entries and managing trailing stops.
2. How does the Half Trend indicator work?
While the Half Trend may look like a simple moving average, the logic under the hood is more sophisticated. Its calculation is designed to be both responsive to the trend and adaptive to market volatility.
The indicator’s algorithm is not a simple average of closing prices. Instead, the Half Trend uses calculations based on the ATR to measure a currency pair’s recent fluctuation. It then combines this with the moving average of the highest high and lowest low over a lookback period to draw a single, smoothed trend line that acts as a dynamic support level or resistance level.
3. The components of the Half Trend indicator
When you load the Half Trend indicator onto your chart, you will see two simple, intuitive components. These visual elements are designed to give you all the information you need at a single glance, making it incredibly user-friendly.
3.1. The main trend line
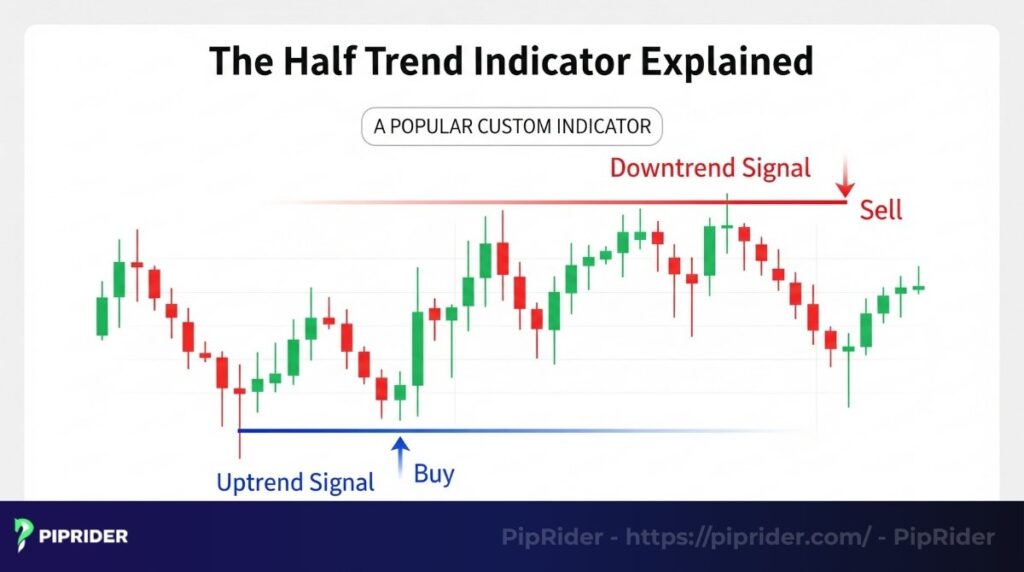
This is the central feature of the indicator. The prevailing trend is conveyed by its changing color. A blue line signifies that the market is in an uptrend, serving as a dynamic area of support. A red line indicates a downtrend, acting as a dynamic resistance level.
3.2. The buy/sell arrows
These arrows provide the explicit trading signals. An upward-pointing blue line appearing below a candle represents a buy prompt. A downward-pointing red arrow appearing above a candle represents a sell prompt.
4. Why is the “non-repainting” feature so important?
This is without a doubt the most vital quality of any reliable signal-based tool. For any trader who has been misled by indicators that appear perfect in hindsight, the “non-repainting” nature of Half Trend is a game-changer.
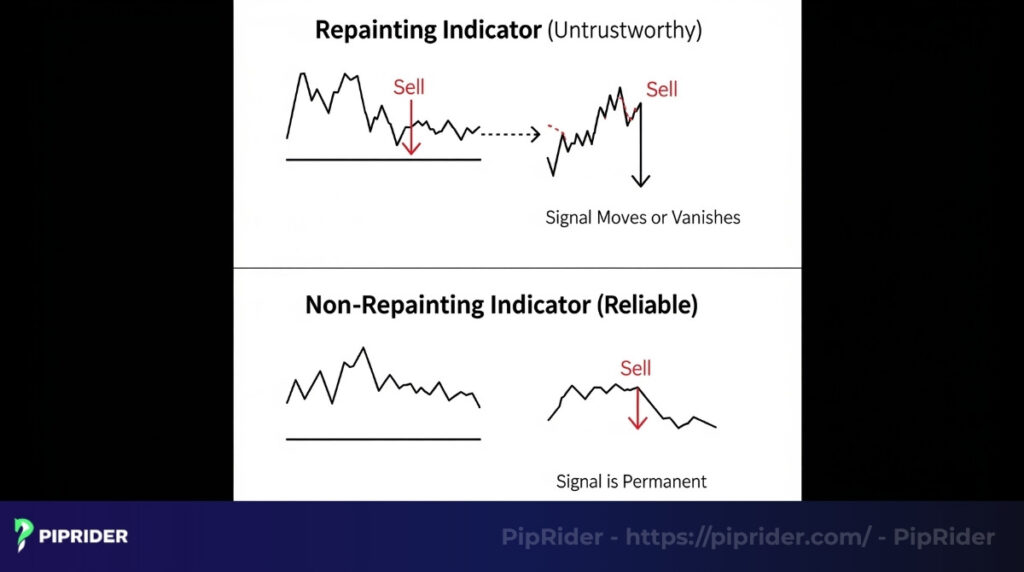
“Repainting” describes indicators whose past signals visually change or vanish after more candles have formed. This creates an illusion of flawless accuracy on historical charts but renders them completely untrustworthy for live decision-making.
The half trend is a lagging indicator, which means once a candle closes and an arrow is printed, that signal is locked in forever. This gives you absolute confidence that what you see during backtesting is what you would have seen in a live market.
5. Principles for applying the Half Trend indicator in trading
The beauty of the Half Trend lies in its dual functionality. It serves as both a high-level compass to determine your overall market bias and as a precise tool to pinpoint specific moments for action. A professional trader learns to use both functions in harmony.
5.1. As a high-level trend filter
We consider this the most fundamental and strategic role of the Half Trend. The color of the main trend line acts as our directional guide for an entire trading session, telling us which side of the market we should be focusing on. If the line is blue, the underlying momentum is a bullish trend; if it’s red, it’s a bearish trend.
For example, if we open the H4 chart of EUR/USD and the Half Trend line is blue, our entire mindset for that session becomes “buy-only.” We will completely ignore any potential sell setups or bearish patterns that appear.
This simple discipline is one of the most effective ways to ensure you are always trading in the direction of the dominant momentum shown by the momentum indicator.
5.2. For specific entry and exit points
This is the indicator’s more active, tactical function, provided by the colored arrows. While the trend line gives us the strategic context (the “what” and “why”), the arrows provide the tactical trigger for when to consider entering or exiting a trade.
In our experience, a blue arrow isn’t just a random symbol; it’s a confirmation that, according to the indicator’s ATR-based logic, a specific point of bullish momentum has been established.
Many traders use these arrows as their primary signal to enter a trade that aligns with the main trend line’s color. They can also be very effective as an exit signal; for instance, we often exit a long position as soon as the first red arrow appears, signaling a potential shift in momentum.
5.3. Best use cases for the Half Trend indicator
The Half Trend is a versatile tool, but we’ve found it to be most effective when applied in these specific ways:
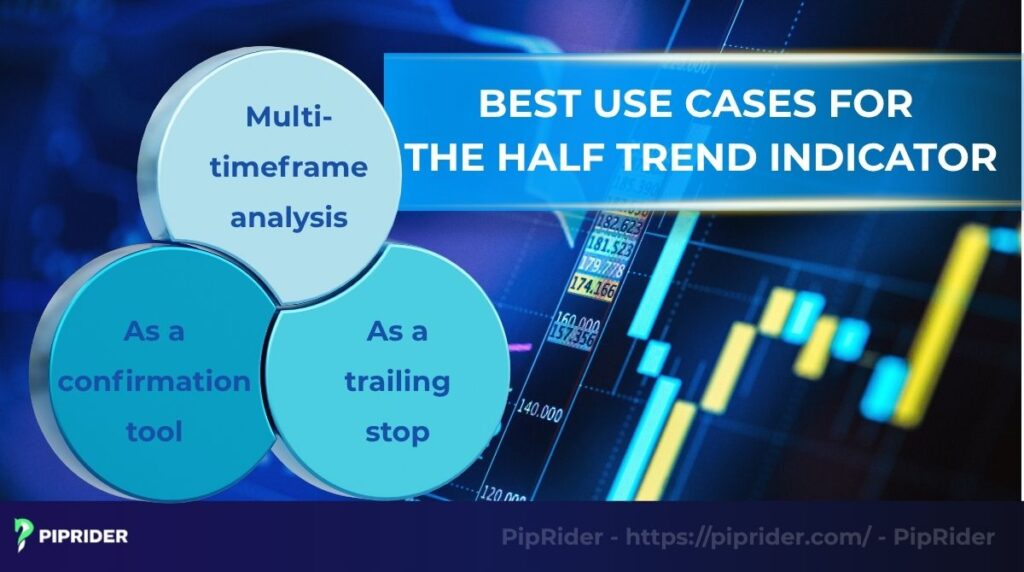
- Multi-timeframe analysis: Use the Half Trend on a higher time frame (e.g., H4 or Daily) to determine the overall trend bias, then drop down to a lower timeframe (e.g., M30 or H1) to look for an entry point (arrow) that aligns with that bias. This helps you filter out noise and trade with the “big money” flow.
- As a confirmation tool: The Half Trend should not be your only signal. We often combine it with other indicators for a stronger confirmation. For example, during a pullback in a blue trend, we’ll wait for the price to reach a key pivot point, then use a blue arrow from the Half Trend as our final signal to enter.
- As a trailing stop: Due to its sensitivity to fluctuation, the main Half Trend line itself can serve as a highly effective dynamic stop-loss or trailing stop. We often move our stop-loss order just below the Half Trend line on a long trade, allowing us to capture as much of the trend as possible while still protecting our capital.
6. A framework for trading with the half trend indicator
Now we move to a rules-based approach for executing trades. This simple framework provides clear conditions for entering a trade and a logical method for managing your initial risk management.
6.1. The sequence for a BUY trade
To generate a high-probability buy signal, we are looking for a clear shift from a bearish trend to a bullish trend momentum. This is confirmed by a sequence of three specific events on the chart.
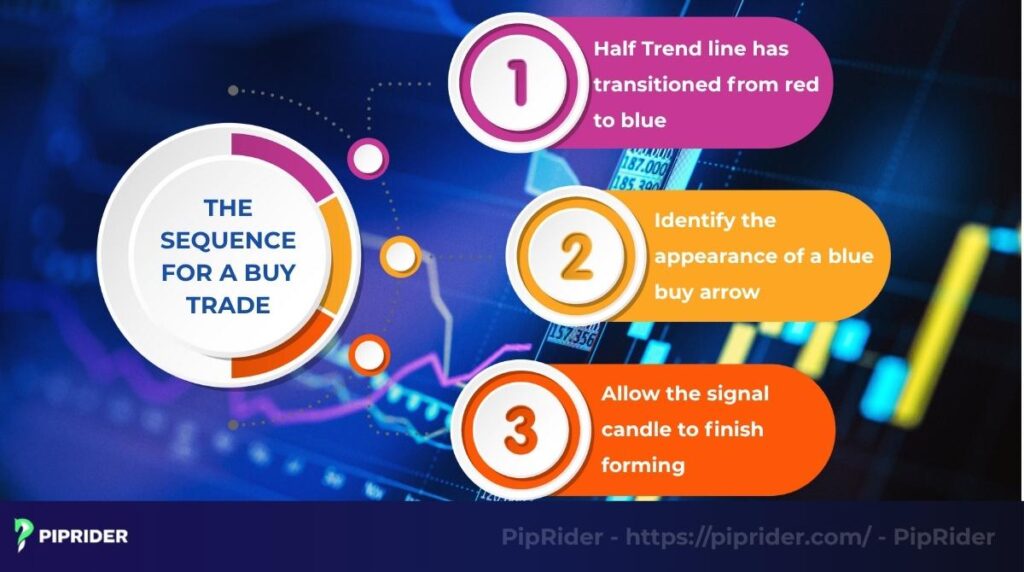
- Confirm that the main Half Trend line has transitioned from red to blue.
- Identify the appearance of a blue buy arrow below a price candle.
- Allow the signal candle (the one with the arrow) to finish forming. Once it closes, an entry point can be placed on the subsequent candle.
6.2. The sequence for a SELL trade
Similarly, a sell signal requires a clear shift from bullish to bearish momentum. We wait for the same three conditions, but in the opposite direction.
- Trend Transition: Confirm that the main Half Trend line has changed color from Blue to Red.
- Arrow Signal: Identify the appearance of a Red (Down) arrow above a price candle.
- Execution: Allow the signal candle to close completely to validate the arrow. Once closed, a Sell Entry can be placed at the open of the next candle.
6.3. A method for risk management
A signal is useless without a clear plan for what to do if you are wrong. The Half Trend line itself provides a logical and dynamic level for placing your protective stop loss.
Setting your stop loss: A common approach is to use the trend line as a reference point.
- For a buy trade, you would place your stop a few pips below the blue Half Trend line.
- For a sell trade, you would place it a few pips above the red Half Trend line. This provides a dynamic stop that trails the price direction as it progresses.
6.4. Exit Rules (Taking Profit)
Knowing when to get out is just as important as getting in. Here are three professional ways to secure profits using the Half Trend:
- The Reversal Signal: Simply close the position when an opposite colored arrow appears. This ensures you catch the full duration of the trend, though you may give back some profit at the very end.
- Fixed Risk:Reward (R:R): Set a hard Take Profit target at a 1:2 ratio (e.g., risk 20 pips to make 40 pips). This mathematical approach removes emotion from the exit.
- Trail the Line: Instead of a fixed target, manually move your Stop Loss along the stepped Half Trend line as price advances. You only exit when price finally crashes back through the line, guaranteeing you capture the core of a massive move.
7. Building a robust trading strategy with half trend
An indicator is not a strategy. To transform the Half Trend from a simple tool into a robust trading system, you must add layers of filtering and context. This section covers the essential filters for dealing with sideways markets and the unique characteristics of Forex.
7.1. Using a long-term trend filter: The 200 EMA rule
The Half Trend’s biggest weakness is that it can generate false signals in a sideways or ranging market. The professional solution to this problem is to add a long-term trend filter, like a 200-period moving average, to your chart.
7.1.1. The solution for ranging markets
The 200 EMA serves as a high-level directional guide. It divides the chart into two distinct territories: a bullish territory (when price is above the EMA) and a bearish territory (when price is below it).
7.1.2. The combination rule
To create a simple rule-based system, only take buy signals from the Half Trend when the price is trading above the 200 EMA. Conversely, consider sell signals only when price is trading below the 200 EMA. This simple filter will eliminate most of the low-probability, counter-trend signals.
7.2. Applying specific notes for the Forex market
While the Half Trend works in any market, applying it to Forex requires an awareness of the market’s unique characteristics. Here are some crucial notes for Forex traders.
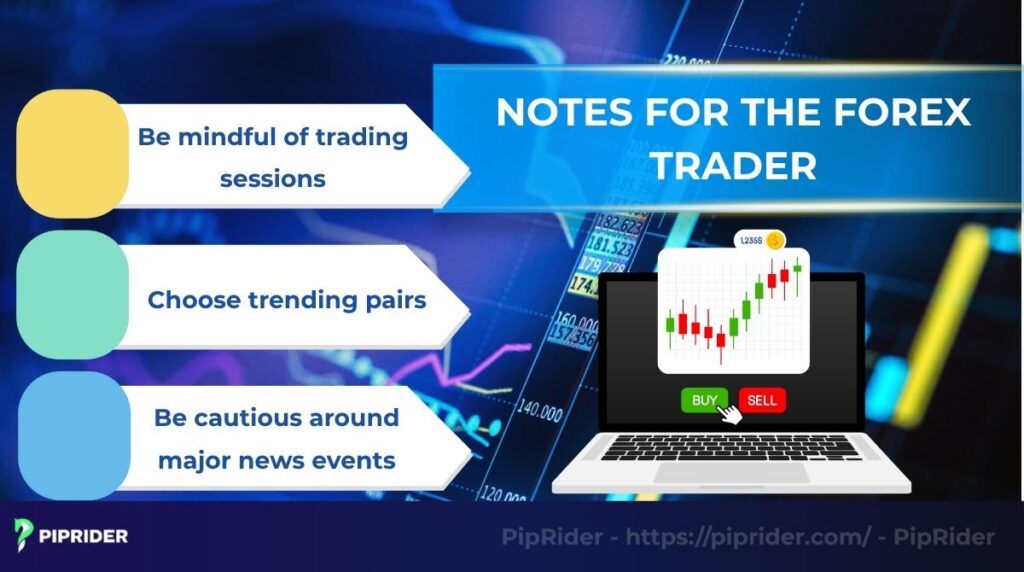
7.2.1. Be mindful of trading sessions
The Forex market’s 24-hour nature means its fluctuation changes drastically. The Asian session is often quiet and range-bound, which is a very difficult environment for trend indicators. The Half Trend will be most effective during the more volatile London and New York sessions.
7.2.2. Choose trending pairs
Not all currency pairs are created equal. Some pairs, like GBP/JPY or EUR/AUD, are known for strong trends, making them ideal for this indicator. Others, like EUR/CHF or AUD/NZD, are often range-bound and will generate more false signals. Do your homework on pair characteristics.
7.2.3. Be cautious around major news events
High-impact news (like NFP or central bank announcements) can cause extreme, unpredictable price fluctuations. This can easily lead to “whipsaws” where the Half Trend gives a sell signal right before a massive reversal. It’s often wiser to stay out of the market during these specific times.
8. The difference between half trend and supertrend indicators
Traders often compare the Half Trend to another popular trend indicator, the Supertrend indicator. While they share some similarities in their function and appearance, there is a key difference in their design that appeals to different types of traders.
- Similarities: Both are trend-following indicators that use ATR in their calculations. Functionally, both tools draw a line on the chart that can be used as a dynamic area of support or resistance.
- Key difference: The main difference is that the supertrend is typically just a single, color-changing line. The half trend, however, introduces the additional visual element of unambiguous buy and sell arrows. These arrows make the entry and exit points much clearer and more intuitive, which is a significant advantage for traders who prefer a very clean and explicit signal.
9. What is the best setting for the half trend indicator?
While there is no single “magic number” that works for every currency pair, professional traders adjust the Amplitude parameter to match market volatility. Using the wrong setting is the #1 reason traders fail with this tool.
9.1. Understanding the Parameters
Before changing any numbers, you must understand what they control. The Amplitude is the heart of the indicator—it dictates how much “noise” the algorithm ignores.
| Parameter | Default | How to Adjust |
| Amplitude | 2 | Increase: Smoother line, fewer signals, lagging. (Good for Trends) Decrease: Sensitive line, faster signals, more noise. (Good for Scalping) |
| Channel Deviation | 2 | Controls the ATR channel width. Increase: Wider Stop Loss (Avoids premature exits). Decrease: Tighter Stop Loss (Protects profit but risks stopping out early). |
9.2. Recommended Starting Ranges
Based on general market consensus and backtesting, here are the optimal starting ranges for different trading styles:
- For Short-Term / Day Trading (M15 – H1):
- Amplitude: 2 – 6
- Goal: To catch quick intraday moves. The default setting (2) is often best for keeping the stop-loss tight to the price action.
- For Long-Term / Swing Trading (H4 – D1):
- Amplitude: 8 – 12
- Goal: To filter out deep retracements. A higher amplitude prevents the indicator from flipping color during a normal pullback in a massive trend.
9.3. The “Noise” Warning (Timeframes)
The Half Trend indicator struggles with market noise. Therefore, it performs statistically better on higher timeframes.
- Best: H1, H4, and Daily (D1).
- Avoid: M1 to M5, unless you significantly increase the Amplitude (to 6+) to smooth out chaotic price spikes.
💡 Pro Tip:
Avoid “Curve Fitting” Do not change your settings after every losing trade to make the indicator look perfect on past data. Pick one setting (e.g., Amplitude 2) and stick to it for at least 100 trades to verify its true performance.
10. How to set up half trend on MT4 and TradingView
Since the Half Trend is a community-developed custom indicator, it does not come pre-installed on most trading terminals. Follow these simple steps to add it to your chart.
10.1. On TradingView
Setting up on TradingView is the easiest method as it requires no file downloads, just a quick search in the public library.
- Click the “Indicators” button on the top toolbar.
- Type “Half Trend” in the search bar.
- Warning: Be cautious of paid scripts in the library, as many are simply re-branded clones of the free code. Ensure you select the original open-source version by Everget to avoid paying for a tool that is 100% free.
- Click on the script to add it to your chart.
10.2. On MetaTrader 4 (MT4)
For MT4, you must first download the indicator file (usually named HalfTrend.ex4 or HalfTrend.mq4) from a trusted source.
- Open your MT4 platform and go to File > Open Data Folder.
- Navigate to the MQL4 > Indicators folder.
- Paste your downloaded file into this folder.
- Restart MT4. The indicator will now appear in the “Custom” list within the Navigator window.
10.3. On MetaTrader 5 (MT5)
The process for MT5 is nearly identical, but you must ensure you have the correct file version (.ex5 or .mq5) and place it in the right directory.
- Open MT5 and go to File > Open Data Folder.
- Navigate to the MQL5 > Indicators folder. (Note: Look for MQL5, not MQL4).
- Paste the file here.
- Restart MT5 or right-click the Navigator window and select “Refresh” to see the tool.
11. FAQs
12. Conclusion
The half trend indicator is an excellent, straightforward, and reliable trend-following tool, particularly well-suited for traders who value clarity and simplicity. Its non-repainting nature gives it a level of trustworthiness that many other custom indicators lack, and its visual signals are incredibly easy to interpret.
However, it is not a holy grail. Its true power is unlocked when you respect its main weakness, ranging markets, and combine it with a simple long-term trend filter like the 200 moving average. The half trend can also be a powerful tool for anticipating market reversals. The half trend may not be complex, but it is a powerful and robust support tool. We encourage you to test it on a demo account to feel its effectiveness for yourself. Another effective approach is to use the arrows to determine take-profit orders or profit targets.
For a more comprehensive overview of the best technical indicators, read more of Piprider’s articles. Don’t forget to leave your comment if you have any questions in the chat box below!


