Heikin Ashi candlesticks help me filter market “noise” and see the trend far more clearly than traditional Japanese candles. In my trading experience, learning how to read Heikin Ashi candlesticks correctly is the key to riding a trend longer and avoiding false signals. This A-Z guide explains exactly how to interpret their signals.
Key Takeaways
- Heikin Ashi is a “smoother” chart that uses an averaging formula to calculate its candle prices.
- Its main benefit is showing the trend clearly by reducing market noise and filtering out minor, false price movement.
- The main signals come from the candle’s colour (trend direction) and the length of its wicks (trend strength).
- Strong Bullish Trend: A series of green candles (with a full body) and no lower wicks/shadows.
- Strong Bearish Trend: A series of red candles with no upper wicks/shadows.
1. What Are Heikin Ashi Candlesticks?
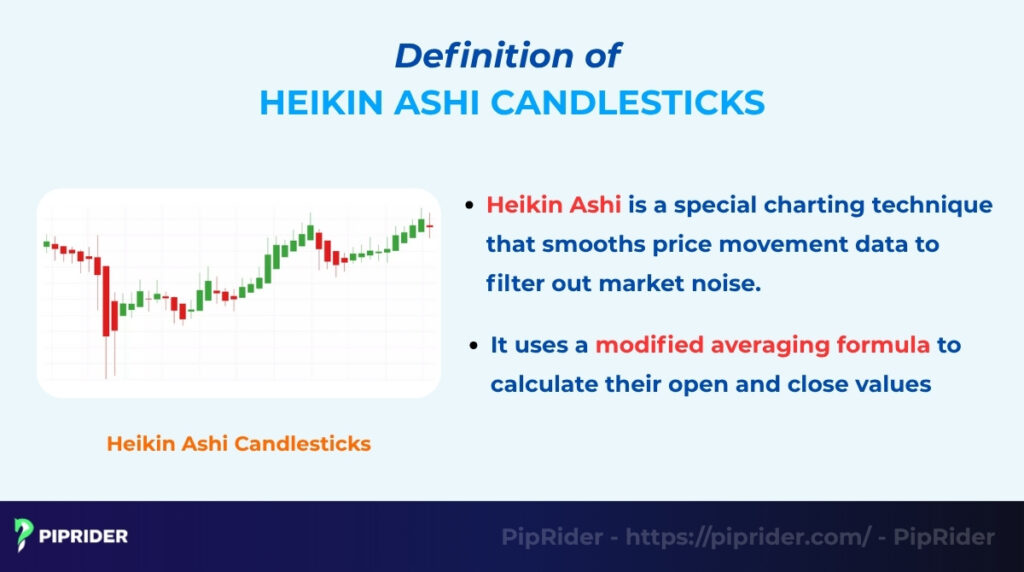
Heikin Ashi (which means “average bar” in Japanese) is a special charting technique that smooths price movement data to filter out market noise.
Unlike traditional Japanese candlesticks that show the exact open, high, low, and close (OHLC) prices, Heikin Ashi candles use a modified averaging formula to calculate their own set of price values (Corporate Finance Institute, n.d.). This averaging technique filters out volatile market noise, making it significantly easier for traders to identify the true underlying trend without getting shaken out by minor fluctuations (Investopedia, n.d.).
Heikin Ashi charts are most effective for trend-following, swing trading, and position trading. They help traders stay in a winning trade longer by filtering out the minor, scary pullbacks.
While some day trading professionals use them, they are generally not ideal for very fast scalping because the averaged signals are slightly delayed.
Heikin Ashi vs. Japanese Candlesticks
The main difference is clarity vs. speed.
- Japanese Candlesticks (Traditional): These show the exact price for the period. They are accurate for price but can be very “noisy”. A strong uptrend might still have several red candles that can confuse or “shake out” a trader.
- Heikin Ashi Candlesticks: These show an averaged price. They are much “smoother” and better at showing the trend’s direction (e.g., a long series of green candles). However, because they are an average, their signals are slightly delayed (lagging).
2. How Are Heikin Ashi Candles Calculated?
Heikin Ashi candles look “smoother” because they don’t use the standard Open, High, Low, and Close (OHLC) values. Instead, they use a modified formula that averages the price data from both the current and previous candle. This averaging is the “secret” to how Heikin Ashi filters out price movement noise.
Here are the four formulas used to create a single Heikin Ashi candle. (Note: “HA” means Heikin Ashi, and “Previous” refers to the prior HA candle).
This is simply the average price of the current, standard candle.
This is the midpoint of the previous Heikin Ashi candle’s body.
The HA-Open formula is the most important one for smoothing the price chart.
Unlike a traditional chart where the Open price can gap up or down, the Heikin Ashi Open is forced to start at the midpoint of the previous candle. This link to the past candle is what removes gaps and averages out minor, insignificant price movement, resulting in a cleaner chart that shows the true underlying trend (TradingView, n.d.).
3. How to Read Heikin Ashi Candlesticks
Reading Heikin Ashi is very different from reading traditional candles. You are not looking for complex patterns; you are looking at the candle’s body and its wicks (or shadows) to measure the trend’s strength.
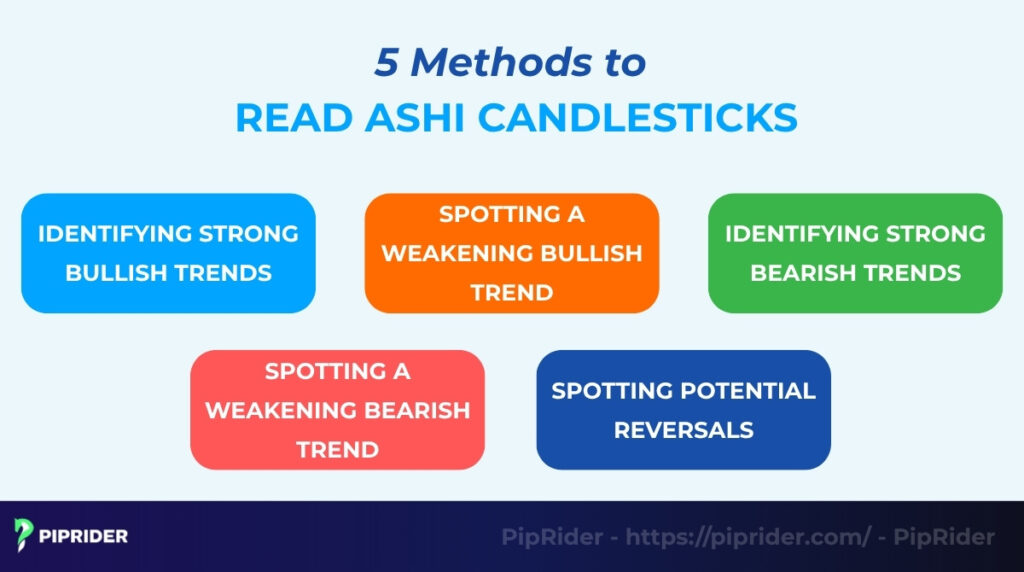
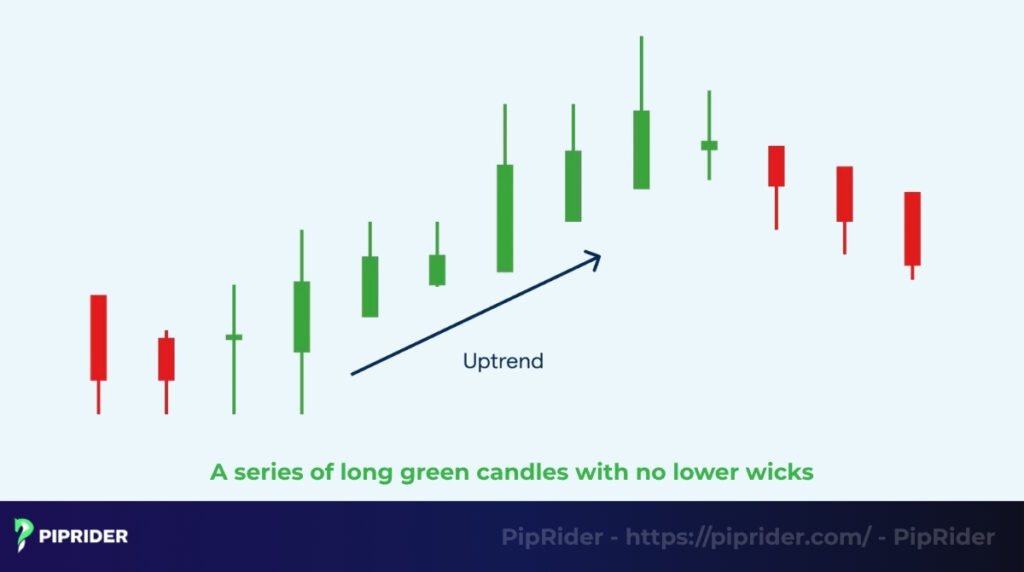
3.1. Identifying Strong Bullish Trends
You can identify a strong bullish (upward) trend by a series of long, green candles with a full body that have no lower wicks (or shadows).
The absence of a lower wick means that the actual lowest price of the current session never dropped below the midpoint of the previous candle (which is the Heikin Ashi opening price). Traders read this as a signal to hold a long (buy) position, as the bullish momentum is in absolute control.
3.2. Spotting a Weakening Bullish Trend
You can see a bullish trend start to show weakness when the green candles get smaller and, most importantly, when they start to show lower wicks.
The appearance of a lower wick means that sellers were able to push the price down temporarily. This price movement tells a trader that the trend might be pausing or preparing for a pullback.
3.3. Identifying Strong Bearish Trends
Identifying a strong bearish (downward) trend is the mirror image of a strong bullish trend. You can spot it by a series of long, red candles that have no upper wicks (or shadows).
The absence of an upper wick means the actual highest price of the current session never rose above the midpoint of the previous candle. This is a strong signal to hold a short (sell) position, as sellers are dominating the market.
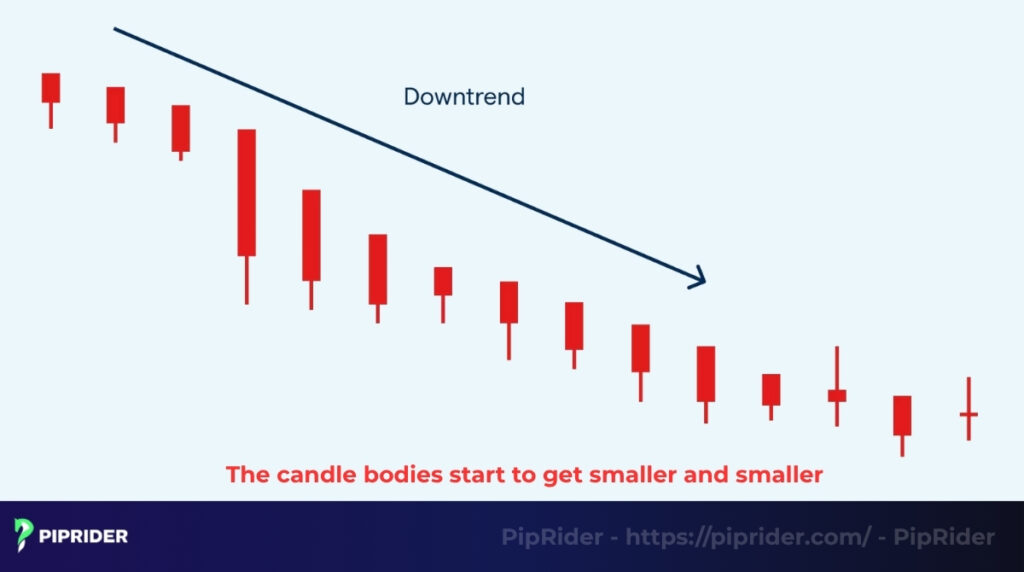
3.4. Spotting a Weakening Bearish Trend
Weakness in a bearish trend appears when the red candle bodies get smaller and, critically, when they start to show upper wicks.
An upper wick signals that buyers are starting to step in and “fight” the sellers. This price movement means the selling pressure is easing, and the trend might be slowing down.
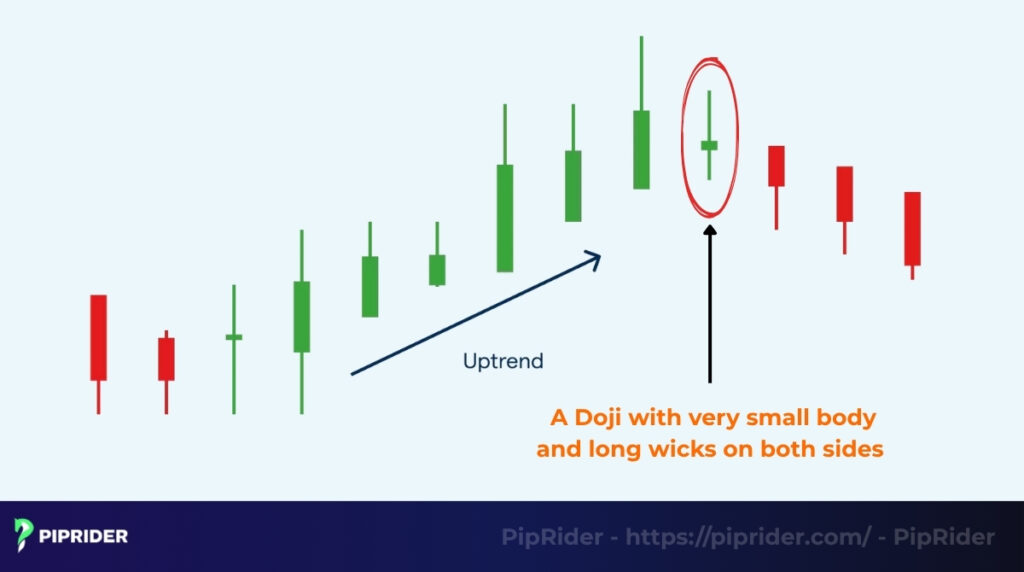
3.5. Spotting Potential Reversals (Indecision)
Trend changes or new sideways periods are often signaled by candles with very small bodies and long wicks on both sides (upper and lower).
These small candles (often looking like a Heikin Ashi “Doji”) show total indecision. This is a warning that the previous momentum is pausing; a reversal is possible, but it always needs confirmation from subsequent price action before you enter a trade.
4. What Are the Key Heikin Ashi Chart Patterns?
Beyond just single candles, you can read the “story” of the market by looking at a few simple Heikin Ashi chart patterns. These patterns clearly show you the market’s current phase and momentum.
4.1. The Trend Acceleration Pattern
Trend acceleration becomes visible as a series of long-bodied candles (green or red) that have no wicks against the trend. For example, in a strong uptrend, you will see multiple long green candles with no lower wicks. This pattern signals that price movement momentum is increasing and the trend is very healthy.
Actionable Takeaway: This is the time to confidently hold your winning trades or look for pullback entries. Never try to pick a top or bottom (fade the trend) when this pattern is active.
4.2. The Trend Exhaustion Pattern
Trend exhaustion is identified when the candle bodies start to get smaller and smaller after a long move. Even if the candles are still green, their shrinking size shows that buying pressure is drying up. This pattern is a warning to look for a potential pullback or reversal.
Actionable Takeaway: This is not an immediate signal to trade against the trend. Instead, treat it as a cue to tighten your trailing stop-loss or take partial profits off the table.
4.3. The Heikin Ashi Doji Pattern
The Heikin Ashi Doji is a key signal of market indecision. A Doji is a candle with a very small (or non-existent) body and long wicks on both sides.
When a Doji appears after a strong, long trend, it signals that the previous trend’s momentum has stopped. However, a reversal is only possible and needs confirmation from other technical tools or the next candle’s close, as the market may simply be consolidating before continuing its original path.
Actionable Takeaway: Step aside and wait. If you are already in a trade, this is a strong signal to protect your capital until the market chooses a clear direction.
4.4. The Consolidation Zone Pattern
A consolidation zone (a sideways market) appears as a mix of small-bodied red and green candles that all have wicks on both sides. This “choppy” price movement shows that neither buyers nor sellers are in control, and the market is in a period of indecision.
Actionable Takeaway: Avoid trading trend-following strategies during this phase. Wait for the price to break the zone, confirmed by a strong HA candle with no opposing wick.
5. How Do You Trade Using Heikin Ashi?
The main advantage of Heikin Ashi is its simplicity. However, professional traders never rely purely on visual color changes. A robust strategy requires precise entry triggers, real-price stop-losses, and structural exit rules to avoid being shaken out by market noise.
5.1. The Trend-Following Strategy
Trend-following is the most popular Heikin Ashi trading strategy, designed to catch long, sustained market moves.
- Setup: Wait for a strong trend to establish itself (e.g., a series of long green HA candles with no lower wicks).
- Entry Trigger: Enter a “Buy” trade only after a strong confirmation HA candle fully closes. Never enter while the candle is still forming.
- Stop-Loss (SL): Switch to your traditional candlestick chart to find the real price. Place your SL below the most recent structural swing low, and add a 1x or 1.5x ATR (Average True Range) buffer to survive normal volatility spikes.
- Exit Rule: Do not exit blindly at the first red HA candle (which is often just a minor pause). Hold the trade until the real price breaks market structure (a previous higher low) or closes below a dynamic support, such as the 50-period EMA.
5.2. The Pullback Strategy
The pullback strategy is a more patient approach. Instead of chasing an extended move, you wait for a short pause in a strong trend.
- Setup: In a strong uptrend, wait for the trend to pause. This appears as a few small-bodied candles (indecision Dojis) or small opposing red candles.
- Entry Trigger: Enter only after a new, strong green HA candle (with no lower wick) fully closes, confirming the main trend is resuming.
- Stop-Loss (SL): Use the standard Japanese candlestick chart to place the SL just below the lowest actual price of that pullback, buffered by the ATR.
- Exit Rule: Trail your stop-loss below each newly formed swing low on the real price chart. Exit the position when this trailing structure is broken or when multiple opposing HA candles confirm a true momentum shift.
5.3. The Breakout Confirmation Strategy
Traditional candles can produce many “false breakouts” (fakeouts). You can use Heikin Ashi to confirm if a breakout has genuine momentum behind it.
- Setup: Identify a clear consolidation range or a major support/resistance level on your chart. Wait for the price to break this level.
- Entry Trigger: Do not enter immediately on the initial thrust. Enter the trade strictly after the first HA candle outside the breakout zone fully closes as a long-bodied candle with no opposing wick.
- Stop-Loss (SL): Place the SL on the traditional chart just inside the breakout level or below the breakout candle’s real low, using the ATR to protect against liquidity sweeps.
- Exit Rule: Target the next major supply/demand zone. Alternatively, trail your exit until the HA chart prints an indecision Doji followed immediately by a fully closed opposing candle, signaling the breakout leg has exhausted.
6. How to Combine Heikin Ashi With Other Indicators (Confluence)
Heikin Ashi charts are powerful for seeing the trend, but they have one major weakness: they are slow (lagging). As lagging trend indicators, they can give you a late signal.
To fix this, you should never use Heikin Ashi alone. A professional trader always confirms the candlestick’s signal with other, faster indicators as part of their technical analysis. This is called “confluence in trading.”
- Moving Averages (20 EMA / 50 EMA): Use trend indicators like a Moving Average to confirm the main trend. The rule is simple: only take “Buy” signals (strong green candles) when the price is above the 50-period EMA, and only “Sell” signals (strong red candles) when the price is below it.
- RSI or Stochastic: Use these indicators to spot “overbought” (over 70) or “oversold” (under 30) conditions. For example, if you see a strong green Heikin Ashi trend, but the RSI is over 70, it’s a warning not to enter a new “Buy” trade.
- ATR (Average True Range): Heikin Ashi candles do not show the real price, so you cannot use them to set your stop-loss. You must use the ATR indicator to measure real volatility. A common rule is to place your stop-loss at a distance of 1.5x or 2x the ATR value from your entry.
- Volume: Use volume to confirm the strength of a breakout, but understand the market you are trading. In centralized markets (like Stocks or Index Futures), real volume is highly reliable, and a genuine breakout should be accompanied by a huge volume spike. However, in decentralized markets like Spot Forex, standard volume indicators only show “tick volume” (a proxy measuring how many times the price changed at your specific broker) (BabyPips, n.d.). Therefore, in FX, treat volume as a supportive clue rather than an absolute rule. Even so, a breakout on abnormally low volume is always a strong warning sign of a potential “fakeout.”
7. What Are the Pros & Cons of Heikin Ashi Candles?
Heikin Ashi charts are excellent for identifying trends, but they are not perfect. It’s critical to understand their specific advantages and the disadvantages (or “trade-offs”) that come with them.
7.1. Advantages (The Pros)
The main advantages of using Heikin Ashi charts come from their ability to smooth price action and reduce stress.
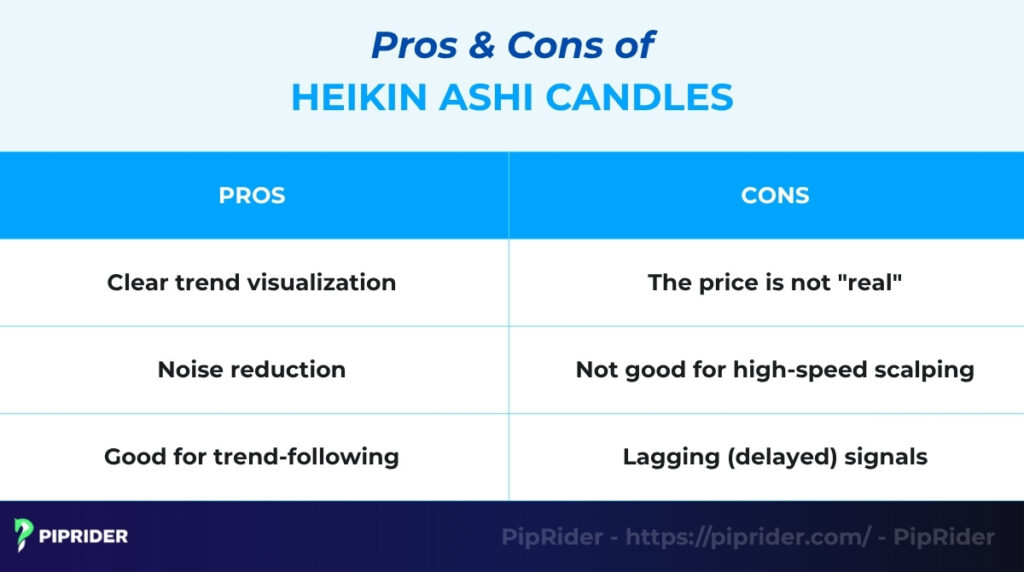
- Clear trend visualization: The averaging formula smooths out the chart, making it much easier to see the true direction of the trend (e.g., a long block of green candles).
- Noise reduction: Heikin Ashi charts filter out minor, insignificant price movement and “market noise.” This helps prevent traders from panic-selling in a good uptrend just because of one small, traditional red candle.
- Good for trend-following: Because they are “smoother” and reduce noise, these candles are excellent for swing trading, position trading, and trend-following strategies. They help you stay in a winning trade longer with less stress.
7.2. Disadvantages (The Cons)
The main disadvantages are all related to the averaging formula, which causes a delay.
- The price is not “real”: The “Close” price you see on the Heikin Ashi candle is an average. It is not the actual, “live” closing price of the asset. You must use a traditional chart or your broker’s price feed for the real price.
- Not good for high-speed scalping: The averaging formula makes the signals slightly delayed. This is not suitable for very fast scalping strategies that rely on split-second entries.
- Lagging (delayed) signals: The “smoothing” comes at a cost: lag. A reversal signal (like a Heikin Ashi Doji or a color change) will often appear on your chart after the actual price has already turned.
8. What Do Example Trades Using Heikin Ashi Look Like?
The easiest way to understand how to read Heikin Ashi candlesticks is to see them in action. Here are two illustrative examples of how a professional trader would approach a setup.
8.1. Example 1: Buying in a Strong Bullish Trend
This example shows a classic trend-following “Buy” setup.
- Identify Trend: The price is trading above the 50-EMA, confirming a clear uptrend.
- Find Signal: The chart prints a series of long, green HA candles with no lower wicks, signaling strong bullish momentum.
- Entry: Enter a “Buy” trade strictly after the confirmation green HA candle fully closes.
- Stop-Loss (SL): Switch to the traditional chart and place the stop-loss just below the actual recent swing low, buffered by the ATR.
- Take-Profit (TP): Hold the trade to ride the trend. Exit when the real price breaks below the 50-EMA or forms a lower low (do not exit simply because a single red HA candle appears).
8.2. Example 2: Selling in a Strong Bearish Trend
This example shows a “Sell” setup in a strong downtrend.
- Identify Trend: The price is trading below the 50-EMA, confirming a clear downtrend.
- Find Signal: The chart prints a series of long, red HA candles with no upper wicks, signaling strong bearish momentum.
- Entry: Enter a “Sell” (short) trade strictly after the confirmation red HA candle fully closes.
- Stop-Loss (SL): Switch to the traditional chart and place the stop-loss just above the actual recent swing high, buffered by the ATR.
- Take-Profit (TP): Hold the trade until the real price breaks above the 50-EMA or forms a higher high, confirming the downtrend is over.
9. What Tools & Platforms Can You Use for Heikin Ashi?
Conceptually, Heikin Ashi is a chart type, and many modern trading platforms allow you to switch to it with a single click. However, the exact way it is applied depends heavily on the charting software you use.
- TradingView: This is the most popular platform for technical analysis. You can easily switch to Heikin Ashi by clicking the candlestick icon in the top toolbar and selecting “Heikin Ashi” from the drop-down menu.
- MetaTrader (MT4/MT5): Unlike TradingView, MT4 and MT5 treat Heikin Ashi as a built-in custom indicator rather than a native chart toggle. You can find it in the “Indicators” -> “Custom” section and drag it onto your chart as an indicator overlay.
- Pro Tip for MT4/MT5: Because it acts as an overlay, the HA candles will clash with your standard Japanese candles. To fix this, change your base chart to a “Line chart” and set the line color to “None.” Always keep a separate standard candlestick chart open in another tab to monitor the real price for your entry and stop-loss placement.
- NinjaTrader / Thinkorswim: These advanced platforms, popular for futures and stocks, offer Heikin Ashi as a default chart type. You can select it directly from the main chart settings or properties menu.
- Mobile Apps: Nearly all major trading apps allow you to switch to a Heikin Ashi chart. However, due to limited screen space, it is much harder to run dual charts (HA and traditional) simultaneously on a mobile device, making precise stop-loss placement more challenging.
10. Frequently asked questions about Reading Heikin Ashi Candlesticks
11. Conclusion
Learning how to read Heikin Ashi candlesticks is a skill that helps you see the trend clearly and reduce the number of mistakes caused by market “noise.”
This tool is most powerful when you combine it with other indicators like a Moving Average (MA), the RSI, or Volume for confirmation. This applies to all derivatives, stocks, or crypto.
Before you trade with real money, you should test these strategies on a demo account to find a style that fits you. To learn more expert trading strategies, explore the free guides at Piprider.com.