
Market volatility often disguises a lack of true momentum. The Moving Average Convergence Divergence (MACD) indicator is the powerful tool used to solve this problem. It acts as a speedometer for a trend, tracking the relationship between two moving averages to show strength and direction.
In this guide, Piprider will break down the MACD indicator forex trading in practical terms and instruct you on how to use its signals and avoid common mistakes to confidently time your entries and exits.
Key Takeaways
- The MACD is a momentum indicator that uses its three components to gauge a trend’s power and direction.
- Crossovers and divergence generate the powerful signals for the indicator
- A growing histogram indicates strengthening velocity, while a shrinking one shows its fading.
- For most traders, the standard 12-26-9 input is the most dependable starting point.
- It is a lagging confirmation tool and should never be used as the sole reason to enter a trade.
1. What is the MACD indicator?
The MACD (Moving Average Convergence Divergence) is a trend-following momentum indicator that primarily tracks the relationship between two moving averages.
According to Investopedia, the MACD was developed by Gerald Appel in the late 1970s (Dolan, 2025). Its main job is to help traders gauge the market’s force, showing whether buying or selling pressure is getting stronger or weaker.
This indicator helps traders identify emerging trends, spot potential reversals, and find clearer entry and exit points. It works particularly well in strongly trending markets.
However, like all moving average-based tools, the MACD is a lagging indicator and should never be used alone. Instead of predicting the future, it analyzes the power and health of the recent price action, giving traders the context they need to make better trading decisions.
2. How does the MACD indicator work?
The MACD indicator is made of three simple components that work together. Understanding these three parts is key to understanding how the indicator works as a whole.
2.1. The structure of the MACD
Let’s break down each component without getting lost in complicated math.
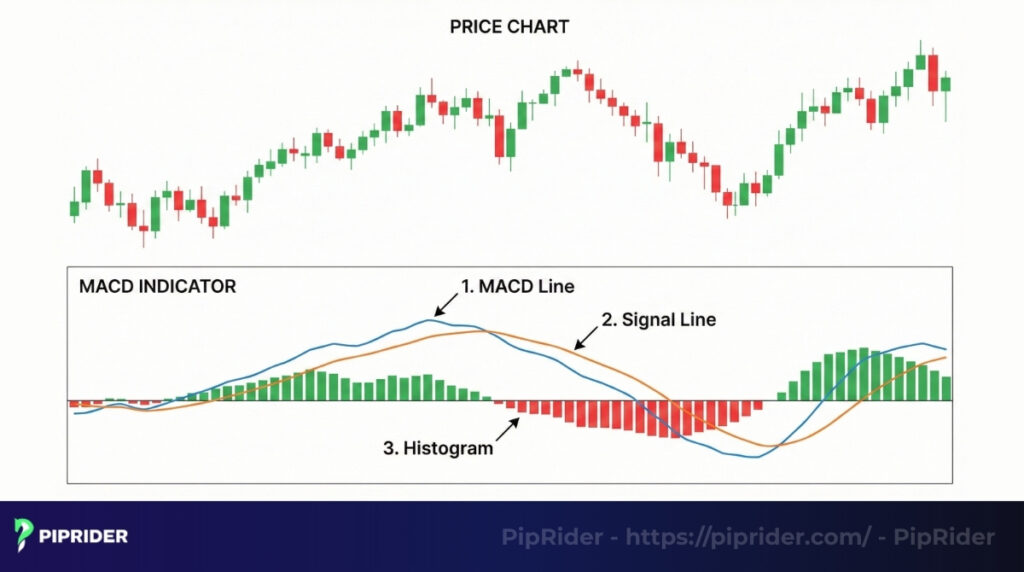
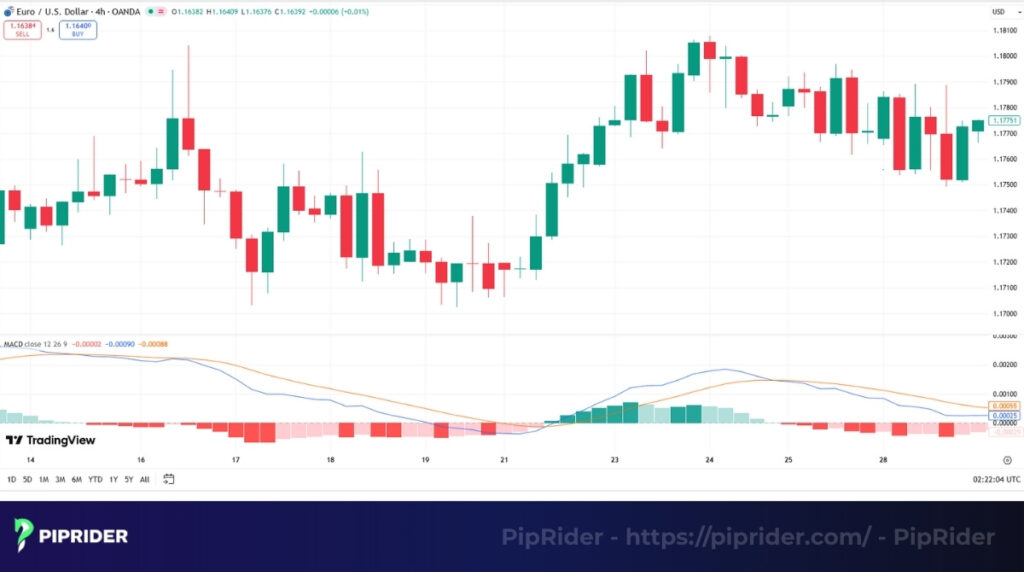
The image shows that there are three key elements:
- The MACD line: This is the faster of the two lines. It is calculated by subtracting the 26-period Exponential Moving Average (EMA) from the 12-period EMA. This line reflects short-term shifts in market momentum (StockCharts, n.d.).
- The signal line: This is a 9-period EMA of the main MACD line. Because it is an average of an average, it moves slower and acts as a baseline to trigger buy and sell signals.
- The histogram: These vertical bars represent the distance between the MACD line and the Signal line. As the two lines move further apart, the bars grow larger, indicating strengthening momentum. When the lines converge, the bars shrink.
2.2. The meaning behind the movements
Now, let’s connect these parts to actual buy and sell signals.
- When the main MACD line crosses over the slower signal line, it creates a bullish signal. This tells traders that short-term momentum is now accelerating upwards faster than the recent average. The histogram will flip from negative to positive.
- When the MACD line crosses below the signal line, it’s a bearish signal, suggesting that the downward trend is now taking control.
- When the histogram gets:
- Taller, it means the gap between the two lines is widening, and the velocity of the current move is strengthening.
- Shorter and shrinking back toward the zero line, it’s a huge warning sign that the current trend is losing steam. This is often the earliest clue that a move is nearing exhaustion.
3. How to apply the MACD indicator in forex trading
Understanding the theory is one thing, but reading the signals in a live market is what truly matters.
3.1. How to read the MACD signals
Learning to interpret these signals correctly is the first step toward making the MACD a useful part of the toolkit. Let’s break down each one.
- The signal line is the classic buy/sell trigger, occurring when the faster MACD line crosses the slower Signal line. Crossing up signals momentum turning positive. However, this signal requires confirmation to avoid false signals.
- The zero line acts as a major filter, indicating a shift in medium-term sentiment. Crossing above zero confirms bullish control, while crossing below confirms bearish control.
- The histogram measures acceleration. Growing bars signal that current strength is increasing, while shrinking bars warn that the move is losing steam. Crucially, the histogram often flips across the zero line before the actual crossover happens, serving as an early warning system that a trend change is imminent.
3.2. Notes on using different timeframes
A common mistake is assuming the MACD behaves the same on all charts. It absolutely does not.
- On lower (like M15): The indicator will be extremely active, producing many crossovers. While this might seem great for scalping, most of these signals will be market noise. Traders avoid using it as a primary tool on charts this low.
- On medium (like H1): This is often the “sweet spot” for many day traders. The signals are frequent enough to provide opportunities but are generally more reliable and less prone to noise than on the M15 chart.
- On higher (like H4 and Daily): A signal here is a major event. A MACD crossover on a daily chart signifies a potentially significant and long-lasting shift in market power. Think of this as identifying the main ocean current, not just the small waves.
3.3. A pro tip: Combine MACD with price action
Don’t trade the indicator in a vacuum. Let the indicator’s signal serve as confirmation for what the price action is already suggesting. For instance, picture a scenario where the price retraces to a critical support level and a bullish pin bar appears. At that exact moment, see the MACD make a bullish crossover.
That isn’t just a signal; that’s a high-probability A+ setup where both price and momentum are in perfect agreement. Adding confirmation from rising tick volume (your broker’s data proxy) or currency futures volume would make this an even stronger setup.
4. Setting up and customizing the MACD on your charts
Getting the tool onto the chart is simple, as it’s a standard, built-in indicator on virtually every trading platform. Let’s walk through the quick setup process for the two most popular ones: MT4 and TradingView.
4.1. Step-by-step guide
This simple process takes less than a minute on either platform, so let’s get it done.
- MetaTrader 4 (MT4): In the top menu, go to Insert -> Indicators -> Oscillators. From the list, simply select MACD. A settings window will pop up with the default parameters already entered. You can adjust colors here. Confirm by clicking ‘OK’, and you will see the indicator loaded in a new panel below the chart.
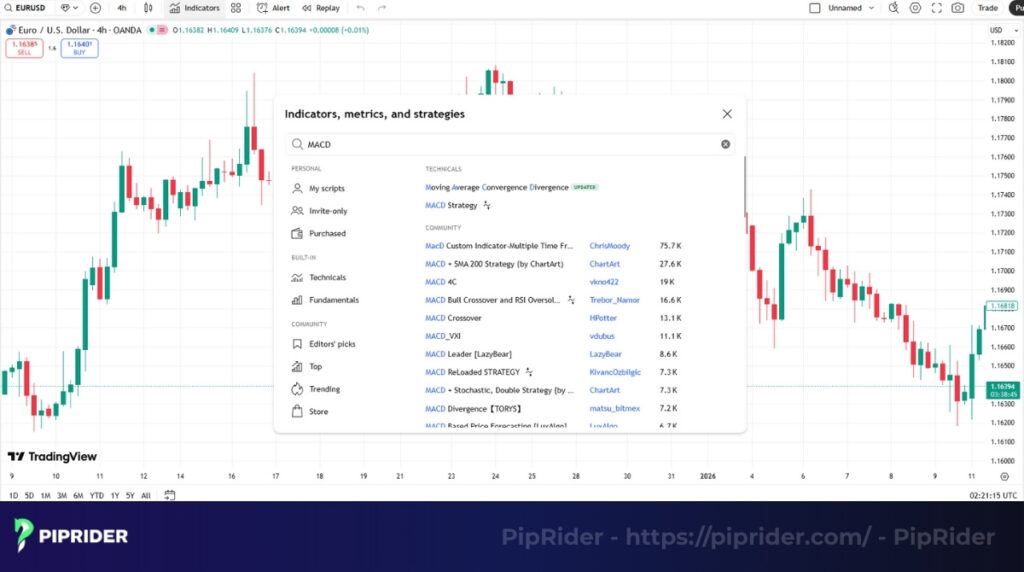
- TradingView: Select the ‘Indicators’ option from the main toolbar at the top of the chart. In the search bar, just type “MACD”. Select the indicator from the list, and it will be instantly applied to the chart. TradingView’s interface is very intuitive.
4.2. Best MACD Settings: Default vs. Custom
While there is no single “best” configuration for every market, the default 12, 26, 9 setting is widely considered the most reliable balance for general trading. However, depending on whether you are scalping or swing trading, adjusting these parameters can help filter noise. Here is the detailed breakdown:
4.2.1. The Standard (12, 26, 9) – Best for Beginners
For 90% of traders, the default settings are the best choice. These parameters are the global standard. Because millions of traders and algorithms watch these exact lines, the signals are more likely to be respected by the market.
4.2.2. Custom Settings (For Reference Only)
As you gain experience, you might see these variations used by specific groups:
- Scalping (5, 10, 5): Highly sensitive. It reacts faster to short-term price bursts but generates significantly more false signals (noise).
- Swing Trading (24, 52, 18): Smoother. It filters out minor choppy price action to focus on the major trend, but signals will appear less frequently.
4.2.3. Important Reality Check
There is no “magic setting” that works for every pair or timeframe. A setting that works on EURUSD might fail on Gold.
- Do not blindly copy settings from the internet.
- Always Backtest: Before using a custom setting, you must test it on past data to see if it actually improves performance. If in doubt, stick to the default.
4.3. Important notes when viewing the chart
There are two final things to burn into the memory when using this indicator.
- Understand its inherent lag: The MACD is, by its nature, a lagging indicator. It is always telling about the velocity of the recent past. It is a confirmation tool, not a predictive one. Never forget this.
- Respect the timeframe: A MACD signal on a weekly chart is infinitely more powerful than a signal on a 5-minute chart. Traders should always place more importance on signals that appear on higher timeframes.
5. Forex trading strategies with the MACD for beginners
An indicator is useless without a trading strategy, a set of rules that tells exactly when to enter, where to place the stop loss, and when to take profit.
Piprider will share two powerful yet simple strategies. Traders can practice these extensively in a demo account until they become second nature.
5.1. Strategy 1: The trend-filtered MACD crossover
The trend-filtered MACD crossover is probably the most reliable MACD strategy for beginners because it’s designed to keep traders on the right side of the main market trend.
The trend-filtered MACD crossover strategy A longer-term moving average, like the 50 EMA, is used as a “trend filter.” If the price is above the 50 EMA, traders should focus primarily on buy signals. If it’s below, priority is given to sell signals.
The rules for a buy trade:
- Trend Filter: To confirm a trend, price should be trading above a 50-period moving average that is sloping upwards. This acts as a conservative filter for beginners to ensure alignment with the dominant momentum.
- Signal: Look for the MACD line to make a clear cross above its signal line. This setup is most valid while the price remains above the 50-period average.
- Entry: Enter a buy order at the opening of the next candle after the crossover is confirmed.
- Stop loss: Place it just under the most recent swing low.
Exit Rules:
- Take Profit: Target the next significant resistance level or the most recent major swing high based on price structure.
- Trailing Stop: As the trend progresses, manually trail your stop loss below each newly formed “higher low” to lock in profits.
- Momentum Exit: Consider a manual exit if the MACD Histogram starts shrinking (converging towards zero) and price simultaneously breaks a short-term trendline. This combination often signals that bullish momentum is draining.
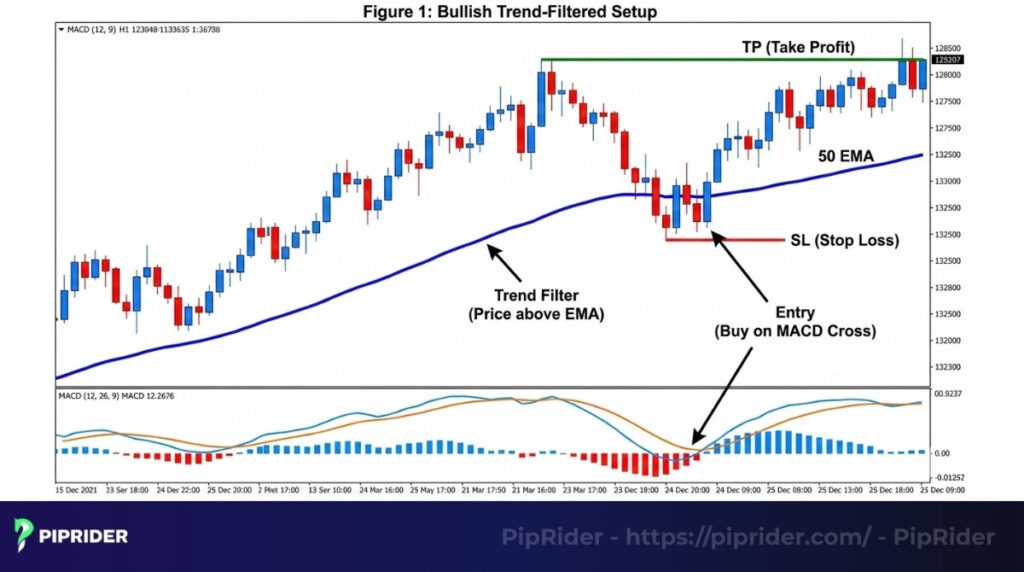
Figure 1: Bullish Trend-Filtered Setup. The price is trading above the rising 50 EMA, confirming the uptrend. A buy entry is taken immediately after the MACD line crosses above the signal line. The stop loss is placed safely below the recent swing low to invalidate the setup if the trend fails.
5.2. Strategy 2: MACD divergence with support and resistance
The MACD divergence is a powerful concept, but traders must understand a crucial distinction: Divergence is a warning sign, not a trade signal. It indicates that momentum is fading, but the trend can continue for a long time despite the divergence.
MACD divergence with support and resistance strategy To trade this safely, we combine three elements: A Key Level (Location), Divergence (Warning), and a Structure Break (Trigger).
The rules for a buy trade (Bullish Reversal):
- Identify a key area: First, find a strong, pre-existing support zone on the chart.
- Spot the divergence: As price approaches this zone, observe if price makes a new lower low while the MACD histogram forms a higher low. This is your “Heads up” warning.
- Wait for Structure Break (Crucial Filter): Do not touch the buy button yet. You must wait for the price to break a short-term trendline or break above the recent swing high. This confirms that buyers have actually stepped in.
- Entry: Enter on the retest of that break, or immediately after the breakout candle closes.
- Stop loss: Place the stop loss just under the lowest point of the divergence setup.
Exit Rules:
- Take Profit: Reversals can be volatile, so strictly target the nearest key resistance level. Do not aim for extended targets initially.
- Trailing Stop: Move your stop loss to breakeven as soon as the price creates the first higher low.
- Invalidation Exit: Close the trade immediately if the MACD Histogram flips back in the direction of the old trend, or if price breaks the “Invalidation Point” (the recent extreme low), proving the divergence failed.
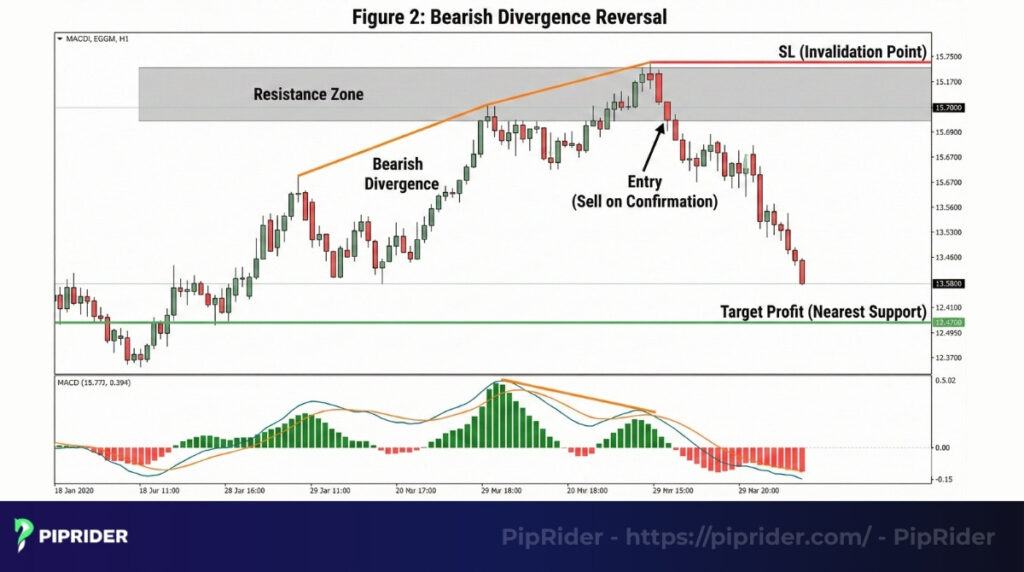
Figure 2: Bearish Divergence Reversal. Price makes a higher high into a key resistance zone, but the MACD histogram makes a lower high, signaling fading momentum. A sell entry is taken upon confirmation from a bearish candlestick pattern, with the stop loss placed just above the resistance high (the point where the reversal thesis is invalidated).
5.3. A quick tip for practice and backtesting
Do not trade these strategies with real money until you have tested them. Use the “Bar Replay” function on TradingView to go back in time and trade the setups as if they were live. Be honest with the results. This is the only way to build true, unshakable confidence in a system.
6. MACD vs. RSI: Which one to use and when?
As traders explore technical analysis, they’ll see both MACD and RSI mentioned constantly. Since they are both momentum indicators, many beginners ask, “Which one is better?”
A more useful question is, “What tool is right for the specific task a trader needs to accomplish right now?”
6.1. Head-to-head comparison: MACD vs. RSI (Relative Strength Index)
Traders often debate which indicator is better, but the truth is they serve different purposes. While MACD is a trend-following momentum indicator, the Relative Strength Index (RSI) is a pure momentum oscillator.
Here is a quick breakdown the key differences of MACD vs. RSI :
| Feature | MACD (Moving Average Convergence Divergence) | RSI (Relative Strength Index) |
| Type | Trend-following & Momentum. | Pure Momentum Oscillator. |
| Boundaries | Unbounded: It has no fixed limits and can rise/fall indefinitely. | Bounded: It moves strictly between 0 and 100. |
| Best For | Trending Markets: Confirming the strength and direction of a trend. | Ranging Markets: Spotting “Overbought” (>70) and “Oversold” (<30) reversal points. |
| Main Signals | Crossovers, Zero-line breaks, Divergence. | Overbought/Oversold levels, Divergence. |
| Speed | Lagging: Slower to react, fewer false signals. | Leading: Faster to react, but more prone to false signals. |
The Winning Combination
Instead of choosing one, many professionals use them together to filter out bad trades:
- Use the MACD to determine the direction of the trend (e.g., MACD is bullish).
- Use the RSI to time the entry (wait for a pullback). Note: If you find RSI too choppy, you can try the Stochastic Momentum Index as a smoother alternative for this same purpose.
6.2. When you should use them together
Instead of choosing one or the other, the best approach is often to use them as a team to confirm each other’s signals.
Here is a common framework:
- Use the RSI for initial signals. The RSI is faster and will often be the first to show traders a potential opportunity. For instance, it might drop into the oversold area (below 30) as the price nears a critical zone. This is the initial “heads up”.
- Use the MACD for final confirmation. Once the RSI provides its initial cue, then await a concurring signal from the MACD. For instance, after the RSI moves below 30, traders would wait for the MACD to have a bullish crossover. This second layer of confirmation helps filter out many of the false signals that RSI might give on its own.
7. Common mistakes when using the MACD (and how to fix them)
Learning the MACD Indicator Forex Trading signals is the easy part. The hard part, where most new traders lose money, is learning to avoid the common traps. There are three common mistakes that almost all traders can make.
7.1. Mistake 1: Trading every crossover signal
A trader sees the MACD line cross the signal line, they immediately jump into a trade, and then wonder why they keep getting stopped out.
- The reality: In a choppy or sideways market, the MACD will produce dozens of crossover signals, and most of them will be meaningless noise. These are low-probability signals.
- The solution: Always combine this signal with a trend filter. A simple rule like “Only take MACD crossovers that happen above the 50 EMA” will instantly filter out the majority of bad trades.
7.2. Mistake 2: Focusing on the histogram Instead of the price
A trader becomes so focused on the histogram bars growing or shrinking that they completely miss what the price candles are telling them.
- The reality: The histogram is a calculation based on another calculation, putting it several steps away from the actual price.
- The solution: Wait for a clear signal like a bullish pin bar, then look at the histogram to confirm if velocity is increasing.
7.3. Mistake 3: Misunderstanding divergence
Divergence is a powerful concept, but it’s also widely misunderstood. Many traders see a tiny bit of this condition and immediately enter a trade, expecting a massive trend reversal.
- The reality: It is a signal that momentum is fading, not a guarantee that the trend will reverse immediately. A trend can continue for a long time with weakening velocity before it finally turns.
- The solution: Never trade this signal alone. Wait for it to be confirmed by a clear break of a trendline or a shift in market structure (like a lower high in an uptrend).
7.4. When NOT to use the MACD (Crucial Warnings) Just as important as knowing when to trade is knowing when to sit on your hands. Avoid using this indicator in these four specific scenarios:
- In tight ranging markets (Choppy): MACD is strictly a trend-following tool. In a flat, sideways market, the moving averages will crisscross constantly. This generates endless false signals. In these conditions, mean-reversion tools like the Stochastic Oscillator tend to perform much better than the MACD.
- During high-impact news events: Major economic releases (like NFP or CPI) cause massive, instant price spikes. Since MACD is a lagging indicator based on past prices, it cannot react fast enough, often giving a signal only after the move is already over.
- On extremely low timeframes: Avoid using MACD on 1-minute or 5-minute charts unless you are highly experienced. The “market noise” on these charts is overwhelming, rendering standard signals unreliable.
- Without a Trend Filter: Never take a trade blindly just because the lines crossed. If you trade against the major structure (e.g., buying when price is far below the 200 EMA), the signal is statistically likely to fail.
In short, the solution to almost every mistake is to stop treating the indicator like a magic standalone system. This indicator works best as part of a team, combined with trend analysis (like an EMA). And remember, avoid using MACD in a strong sideways market; it is a trend-following one and will give traders endless false signals when there is no trend to follow.
8. Frequently asked questions about MACD indicator
Here are some quick answers to the most common questions:
9. Conclusion
After all this analysis, we reach the final verdict: the Moving Average Convergence Divergence (MACD) absolutely deserves a place in your forex trading toolkit. While it is not a magic wand and can sometimes lag, its true strength lies in its ability to validate a trend’s health and warn when momentum is fading.
The path forward is simple: first, get the MACD on your charts and start practicing with simple strategies on a demo account. Once you are comfortable, the next step is to learn how to combine it with other tools, such as the RSI and various EMAs, as they are its most powerful partners.
Always remember the key advice: “It’s far better to master one simple indicator than to be confused by ten complex ones.” To learn Forex and dicover more powerful tools for forex trading, we encourage you to follow us at Piprider and explore our in-depth guides.


