

Are you tired of endlessly flipping through dozens of charts, trying to find a currency pair that’s actually moving? The Currency Strength Indicator (also known as a Currency Strength Meter, CSM, or CS indicator) is a tool designed to solve this problem, giving you an instant, high-level overview of the entire Forex market in a single glance. It eliminates the guesswork and helps you focus your energy on the opportunities with the highest potential, adapting to diverse Market Conditions.
This guide will serve as your complete A-to-Z manual for the CSM, helping you make smarter Trading Decisions. We will cover what it is, how it works, and most importantly, how to use it in a powerful trading strategy to find the strongest trends every single day.
Key Takeaways
- The Currency Strength Meter isolates and grades individual currencies (USD, EUR, JPY, etc.) on a spectrum from most powerful to most vulnerable.
- This approach focuses on matching the most powerful currency against the most vulnerable one to identify high-momentum trends.
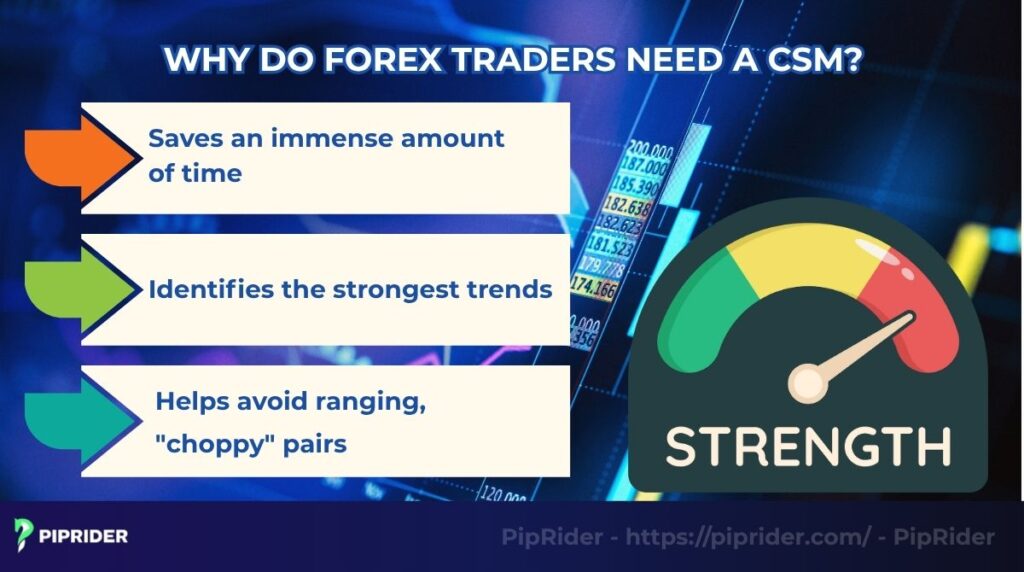
- A CSM instantly analyzes all 28 major and minor pairs, so you don’t have to do it manually.
- It helps you avoid flat, ranging markets by identifying currencies with similar strength.
- The CSM identifies which pairs to watch, but other forms of analysis are needed to determine the precise entry point.
1. What is a Currency Strength Meter?
A Currency Strength Meter is a technical tool that helps you analyze the Forex market from a different perspective. Instead of focusing on just one specific currency pair (e.g., EUR/USD), it allows you to view the entire market as a system of individual currencies (EBC, 2025). Every pair has a base currency and a quote currency, and the CSM analyzes them all.
- Core definition: Imagine the Forex trading market as a sports league with 8 main teams (USD, EUR, JPY, etc.). A currency pair like EUR/USD is just one game. A Currency Strength Meter acts as the official league standings, grading each currency’s overall relative strength based on its collective performance. Each currency is given an average score based on its performance against all others.
- Main purpose: The main goal of the Currency Strength Meter is to instantly show you trend direction by indicating which currencies are getting stronger and which are getting weaker across the entire market. By analyzing the individual strength of each currency, you can more easily identify clear and powerful trends.
2. Currency Strength Meter vs. Pair-by-Pair Chart Scanning
Traditional market analysis requires traders to manually scan up to 28 individual currency pairs across multiple timeframes. This pair-by-pair approach is not only time-intensive but also introduces significant cognitive bias—specifically, the tendency to force trades in choppy markets simply because a trader is staring at a specific chart.
A Currency Strength Meter (CSM) flips this workflow. Instead of analyzing pairs to deduce strength, it calculates raw currency strength to dictate exactly which pairs are worth trading.
| Analytical Feature | Manual Pair Scanning | CSM Workflow |
|---|---|---|
| Time Efficiency | Requires 30+ minutes to evaluate 28 charts and cross-reference multiple timeframes. | Delivers a complete, market-wide macro overview in under 5 seconds. |
| Data Processing | Relies heavily on subjective visual interpretation of historical price action. | Processes raw algorithmic data, mathematically eliminating emotional bias. |
| Trend Filtering | High risk of forcing setups in low-volatility, ranging environments. | Objectively isolates high-momentum pairs while filtering out choppy markets. |
The Verdict on Efficiency
The core advantage of a CSM is operational efficiency. It acts as a macro-level filter. The meter tells you where to look (the specific pair), allowing you to deploy your traditional chart analysis strictly to determine when to execute the trade. This eliminates wasted screen time and keeps your capital focused on high-probability trends.
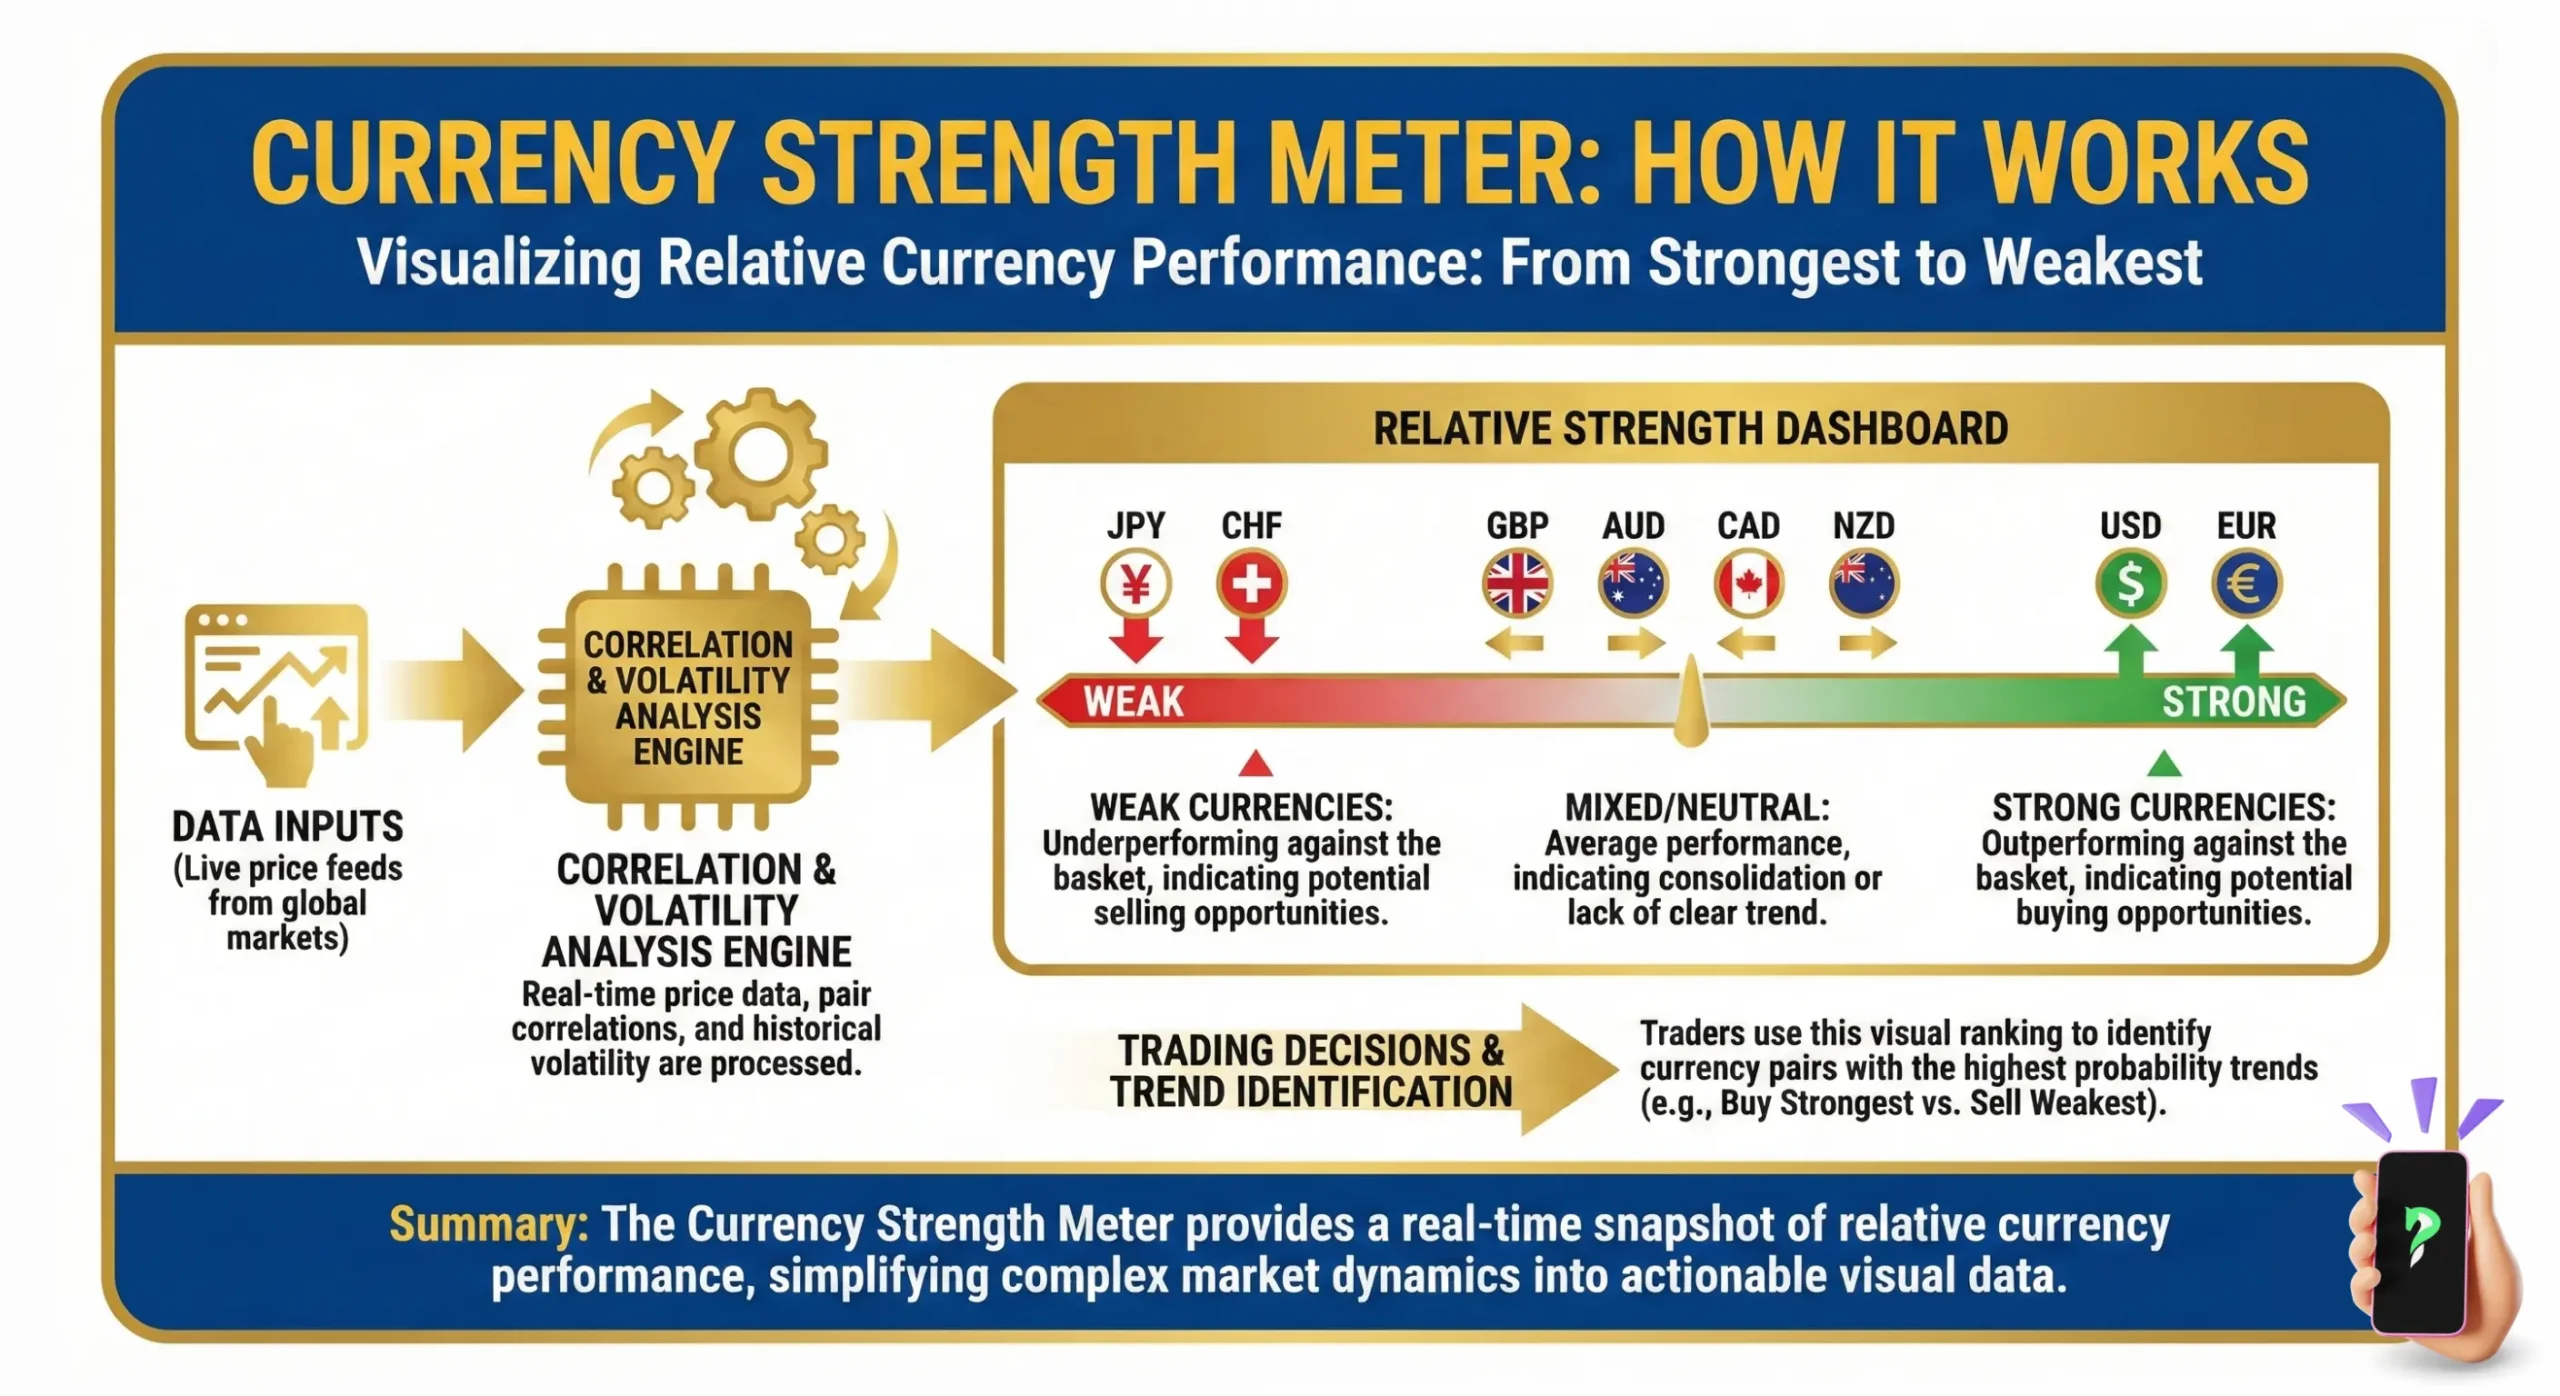
3. How does a Currency Strength Meter work?
While it might look simple on the surface, a good CSM runs a powerful algorithm in the background. It effectively automates the market-wide analysis that would take a human trader hours to perform manually.
3.1. The principle of operation
The Currency Strength Meter (CSM) operates by running a powerful algorithm designed to automate market-wide analysis. The core principle involves assessing the performance of individual currencies, rather than specific currency pairs, against the entire market. This effectively automates the analysis that would take a human trader hours to perform manually.
Illustrative Example:
To calculate the overall strength of a single currency, for example, USD, the algorithm analyzes the price change across all its related pairs (such as EUR/USD, USD/JPY, GBP/USD, and AUD/USD). It aggregates the performance data from these individual pairs to determine if USD, as a whole, is experiencing net buying or net selling pressure across the global market. This process is then repeated for all other major currencies (EUR, JPY, GBP, etc.).
3.2. How strength is displayed
Different tools visualize this data in a few common ways, each with its own benefits.
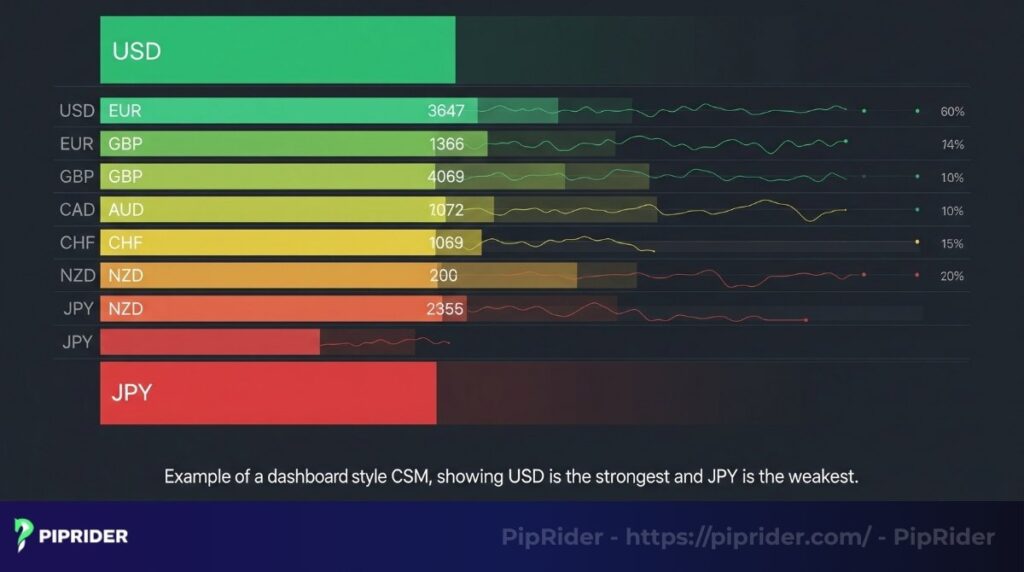
- Dashboard/gauge: Provides a quick, “at-a-glance” reading of the current market situation.
- Heatmap: Helps you visualize the relationships, or Forex pair correlations, between all pairs in a single grid.
- Chart: Line charts are our favorite. Plotting strength over time allows you to see not just who is strong now, but whose strength is accelerating or decelerating.
3.3. The importance of multiple timeframes
A professional CSM lets traders see strength in different timeframes. Analyzing multiple timeframes helps them identify the overall market direction and refine their execution. This is a vital practice in technical analysis because it addresses two major trading questions:
- Higher Timeframe (e.g., Daily or 4-Hour): This establishes the major trend and is used for trend identification. It tells the trader, “Which direction should I be trading?”
- Lower Timeframe (e.g., 1-Hour or 15-Minute): This refines the execution. It tells the trader, “When should I enter to get the best price?”
By observing price action across these different scales, a trader can ensure a short-term entry aligns with the larger market flow, significantly increasing the probability of success and leading to more informed trading decisions.
Example Scenario
For instance, you might see the JPY is the strongest on the Daily chart (a long-term trend) but the weakest on the 1-Hour chart (a short-term pullback). This context is crucial for timing your entry.
4. How to Read Currency Strength Across Multiple Timeframes
A professional Currency Strength Meter (CSM) is a top-down diagnostic tool. In institutional trading, a single timeframe is never enough. To avoid being trapped by market noise, you must analyze the relationship between the Higher Timeframe (HTF), which shows the “tide,” and the Lower Timeframe (LTF), which shows the “wave.”
The following decision framework dictates exactly how to react when timeframes provide conflicting data:
4.1. The Trend Alignment
This setup represents optimal trend alignment, where short-term momentum and long-term structural trends are synchronized in a single direction.
- Scenario: D1 Strong + H1 Strong.
- Market Context: Perfect institutional alignment. The macro trend and intraday momentum are moving in lockstep.
- Professional Action: Prioritize Continuation. Look for any minor consolidation on the M15 or M5 charts to enter in the direction of strength. This setup offers the highest win rate.
4.2. The Pullback Setup
This scenario represents a temporary “discount” within a dominant trend, offering a high-reward entry point for patient traders.
- Scenario: D1 Strong + H1 Weak.
- Market Context: The macro trend is bullish, but the currency is experiencing a short-term intraday correction (Pullback).
- Professional Action: Wait and Observe. Do not sell against the D1 strength. Instead, wait for the H1 strength to “bottom out” and begin turning back toward the positive. Once H1 realigns with D1, you have a high-probability entry.
4.3. The Counter-Trend Bounce
Retail traders often mistake this short-term surge for a trend reversal, but institutional order flow remains heavily biased against the move.
- Scenario: D1 Weak + H1 Strong.
- Market Context: This is often a relief bounce or a liquidity sweep within a major downtrend.
- Professional Action: Extreme Caution. If you trade this, lower your profit expectations significantly. Professional traders often use this H1 strength as an opportunity to find a better (higher) price to Sell in alignment with the D1 weakness.
4.4. The Consolidation Zone
When strength is stagnant across all timeframes, the market lacks a clear catalyst, making any entry a low-probability gamble.
- Scenario: D1 Flat + H1 Flat.
- Market Context: The currency is in a state of equilibrium. There is no institutional interest or major order flow driving the price.
- Professional Action: Stay Flat. This is a capital trap. Avoid any pairings involving this currency until you see a definitive breakout on the H1 meter.
The following summary table serves as a high-level operational framework for filtering currency strength. By synchronizing higher-timeframe structural trends with lower-timeframe momentum, traders can objectively distinguish between high-probability continuations and low-probability counter-trend fluctuations.
Decision Framework Summary Table
| D1 Strength | H1 Strength | Market Regime | Strategy |
|---|---|---|---|
| Strong | Strong | Trend Alignment | Aggressive Continuation |
| Strong | Weak | Pullback / Correction | Wait for LTF Realignment |
| Weak | Strong | Counter-Trend Bounce | Fade the Move / Stay Flat |
| Flat | Flat | Choppy Consolidation | Strictly Avoid |
5. A Complete Currency Strength Meter Trading Strategy
To consistently extract profit from the Forex market, you must integrate your tool into a rigid, repeatable currency strength meter strategy. Relying solely on the meter is gambling; combining it with structural price action and strict risk management is professional trading.
5.1. The Foundational Principle: The “Push-Pull” Dynamic
The setups with the highest odds emerge when you match a currency experiencing widespread institutional buying pressure against one facing widespread selling pressure, capitalizing on areas where the strength divergence is greatest (Day-Trade-Forex, n.d.).
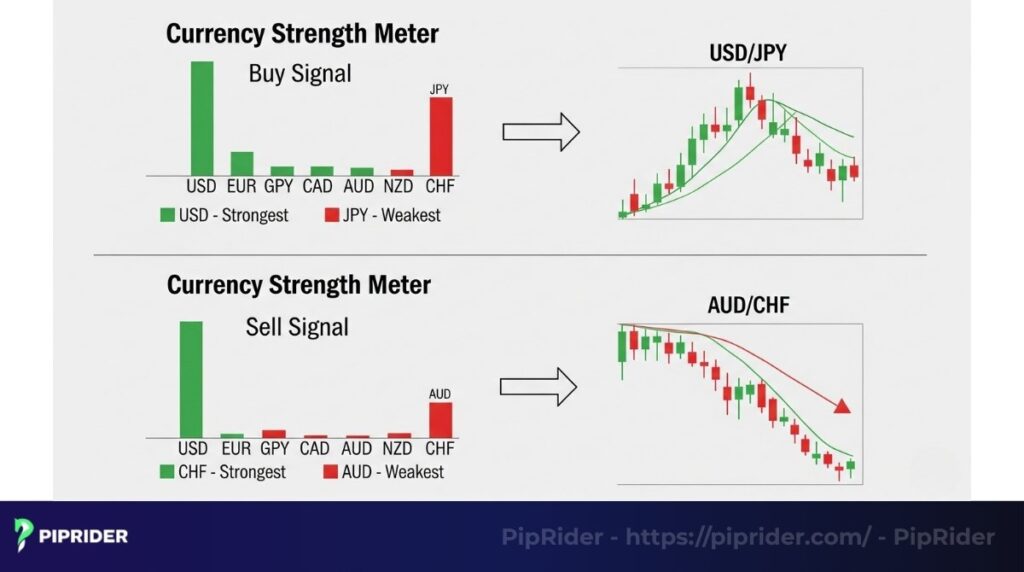
- The Buy Signal (Long): If your CSM identifies USD as the absolute strongest and JPY as the absolute weakest, the logical conclusion is to look for long setups on the USD/JPY chart. You are buying the strong base currency with a weak quote currency.
- The Sell Signal (Short): Conversely, if AUD is the weakest base currency and CHF is the strongest, you should immediately analyze AUD/CHF to short the market. You are selling the weak base currency in exchange for the strong one.
5.2. The 5-Step Institutional Workflow
Identifying a high-probability “push-pull” pair is only the first piece of the puzzle. The true trading edge comes from how you execute it. Without a strict framework, traders often fall into the trap of entering a strong trend too late or placing their stop-loss in the middle of a liquidity sweep.
To completely eliminate emotional bias and ensure you are only committing capital to optimal setups, you must process your chosen pair through a rigid mechanical filter. The following 5-step workflow takes you from the initial macro scan all the way to precise risk management:
Step 1: Pair Selection (The Macro Filter)
The foundation of any successful currency strength strategy begins with isolating the absolute extremes of market momentum. By identifying where the heaviest institutional capital is flowing in and out, you immediately eliminate dozens of low-probability charts from your watchlist.
- The Condition: You need a clear divergence on the meter at the start of a major volume session (London or New York open).
- The Execution: Pair the absolute strongest currency against the absolute weakest. Strictly ignore the currencies clustered in the middle (the equilibrium zone).
Step 2: HTF Trend Confirmation (The Structural Check)
Never blindly execute an intraday trade based purely on a current meter reading. You must verify that the macroeconomic trend supports the short-term strength to avoid trading directly into major structural resistance.
- The Condition: Open the Higher Timeframe (Daily or 4-Hour) chart of your selected pair.
- The Execution: Confirm that the technical price structure aligns with your CSM reading. If the CSM indicates you should buy GBP/CHF, the D1 chart must already be printing a clear sequence of Higher Highs and Higher Lows.
Step 3: The LTF Pullback (The Value Zone)
Amateurs buy at the top of an extended breakout; professionals wait for a discount. Once the macro trend is confirmed, you must let the market come to you by waiting for a structural retracement.
- The Condition: Drop down to your execution timeframe (1-Hour or 15-Minute).
- The Execution: Wait patiently for the price to pull back against the dominant trend into a high-value liquidity zone. This area of interest could be a dynamic support (like the 21-period EMA) or a historical Support/Resistance level.
Step 4: The Indicator Trigger (The Entry)
A pullback touching a support level is not an automatic entry. You need secondary confirmation that institutional order flow is stepping back into the market to resume the dominant trend before committing your capital.
- The Condition: The price must react to your pre-defined Value Zone.
- The Execution: Look for a momentum shift using a secondary indicator (such as the RSI pivoting from oversold territory) converging with a structural candlestick pattern, like a strong Bullish Pin Bar or an Engulfing candle rejecting the support level.
Step 5: Dynamic Risk Management (SL/TP Logic)
The most robust strategy is mathematically worthless without strict risk parameters. You must clearly define your exit liquidity and invalidation points before you even open the trade ticket.
- Stop-Loss (SL): Place your SL structurally below the recent swing low of the pullback (for a long trade). Add a small Average True Range (ATR) buffer (e.g., 5-10 pips) to protect against algorithmic liquidity sweeps.
- Take-Profit (TP): Target the next major structural liquidity pool or the recent extreme high. Always ensure the setup provides a minimum 1:2 Risk-to-Reward ratio before pulling the trigger.
Execution Checklist: Quick CSM Rules
To filter out low-probability setups and focus exclusively on high-momentum opportunities, follow this systematic rule set at the start of every trading session:
Quick CSM Rules for Pair Selection
- Trade Strong vs. Weak: Always pair a currency at the top extreme against one at the bottom extreme. Avoid Strong vs. Strong or Weak vs. Weak, as these lack directional momentum.
- Ignore the Middle: Completely discard currencies ranked in the center of the meter. These are in equilibrium and are mathematically prone to choppy, sideways price action.
- HTF Dominance First: Ensure your intraday choice aligns with the Daily (D1) or 4-Hour (H4) strength. Never trade an intraday spike that contradicts the macro-structural strength.
- Chart Confirmation: The CSM identifies the pair; the chart identifies the entry. Always wait for a structural trigger (Pin Bar, Support/Resistance touch) before executing.
- Session Refresh: Re-scan the meter at the open of each major session (London and New York). Institutional order flow shifts dynamically during session overlaps.
6. Currency Pairing Dynamics: Strong vs. Weak, Strong vs. Strong, Weak vs. Weak
The true utility of a Currency Strength Meter does not lie in identifying a single strong currency; it lies in analyzing the relationship between two currencies. The Forex market is driven by relative capital flow. To capture high-probability momentum, traders must understand how different combinations of strength and weakness interact to create, or destroy, trend direction.
The following pairing matrix defines the market context and the operational protocol for the three primary strength combinations:
| Pair Logic | Market Context (The Order Flow) | Operational Protocol |
|---|---|---|
| Strong vs. Weak | High-Momentum Imbalance: Capital is actively rotating out of the weak currency and directly into the strong one. This creates a low-friction environment conducive to clean, directional trends. | Prioritize Entry Setups |
| Strong vs. Strong | Capital Conflict: Both currencies are absorbing heavy buying pressure independently. When paired, they offset each other, resulting in highly erratic, volatile, and non-directional price action. | Exercise Extreme Caution |
| Weak vs. Weak | Liquidity Void: There is a severe lack of institutional capital flow in both currencies. The pair lacks the necessary volume to establish a trend, typically resulting in a tight consolidation range. | Strictly Avoid (No Trade) |
The Common Retail Trap
A frequent operational error is identifying a currency with extreme strength (e.g., USD at +8) and immediately buying any USD pair. If a trader executes a long position on USD/CHF while the CHF is also registering high strength (e.g., +7), they are trading into a Strong vs. Strong conflict. Professional methodology dictates that a high-strength currency must exclusively be paired against a mathematically weak currency to ensure a low-friction path to the profit target.
7. Best CSM Workflow for Beginners
For novice traders, analyzing 28 currency pairs simultaneously often leads to analysis paralysis. To build consistency and protect capital, beginners must reduce market noise by following a mechanical, rule-based daily routine.
This “shortcut” system distills the complex mechanics of the Currency Strength Meter into a strict, five-step operational workflow:
- Session Timing: Open your CSM strictly at the beginning of the London or New York open. This is when institutional liquidity enters the market, providing the volume necessary for accurate, directional strength readings.
- Isolate the Extremes: Focus exclusively on the top 2 strongest and bottom 2 weakest currencies. Completely ignore the middle-ranked currencies to avoid low-volatility, ranging environments.
- Macro Alignment: Create your watch-list pairing (Strong vs. Weak), but only validate the setup if this intraday strength aligns with the dominant structural trend on the H4 or D1 charts.
- The Pullback Phase: Drop down to the H1 or M15 charts for execution. Never buy at the absolute peak of a momentum spike. Wait patiently for the price to retrace into a structural support/resistance zone or a dynamic moving average.
- The Execution Trigger: Do not blindly place a limit order at the support zone. Only enter the market when you receive structural confirmation, such as a clear rejection candlestick (Pin Bar or Engulfing pattern) or a secondary indicator signal.
The Golden Rule for Beginners: If a setup fails to meet even one of these five criteria, close the chart and walk away. The goal of this workflow is not to find more trades, but to find the highest-probability trades.
8. Combining CSM with other technical indicators
While the Currency Strength Meter is an elite-level filtering instrument, it doesn’t function as a self-contained trading methodology. Its insights become far more powerful and actionable when you pair them with classic technical indicators, forming comprehensive trading strategies.
8.1. CSM + Moving Averages
This is a classic trend-following combination. First, use the CSM to identify a strong/weak pair (e.g., you identify that you should be looking to buy GBP/JPY). Then, you open the GBP/JPY chart and wait for the price to pull back to a dynamic support level, like the 21-period EMA, before entering.
Benefit: This method ensures you are trading with the dominant trend while entering at a more logical, value-based price during a temporary dip, rather than chasing the top.
Example: The CSM shows GBP is +7 (Strongest) and JPY is -5 (Weakest). This confirms a strong uptrend on GBP/JPY. The trader waits for the price to drop back to the 21-EMA (which is currently at 185.00). Once the price touches 185.00 and forms a bullish candle, a buy order is placed.
8.2. CSM + RSI/Stochastic
This combination is excellent for improving your entry price on an already identified trend. Let’s say the CSM confirms a strong downtrend on AUD/USD. Instead of selling immediately, you watch the RSI. When the price rallies briefly, causing the RSI to become overbought (e.g., above 70), you have a prime opportunity to short at a better price.
Benefit: This approach allows you to time your entry with greater precision, selling into short-term strength for a potentially better risk/reward ratio on your trade.
Example: The CSM shows AUD is -8 (Weakest) and USD is +6 (Strongest). This confirms a strong downtrend on AUD/USD. The trader watches the RSI. When the price makes a shallow rally to 0.6550, the RSI hits 72 (overbought). This RSI extreme is the perfect signal to enter a short (sell) position, anticipating the downtrend will resume.
The key principle:
Internalize this key difference: the CSM offers the high-level strategy (the what and why), while your other indicators provide the tactical trigger (the when). Here is a summary of these combined strategies:
| Combination | Purpose | Benefit |
|---|---|---|
| CSM + Moving Averages | Confirm trend and find dynamic pullback entry. | Trade with the dominant trend at a better price. |
| CSM + RSI / Stochastic | Time entry during a pullback in an established trend. | Significantly improve Risk/Reward ratio. |
9. How to choose the best Currency Strength Meter
One of the biggest points of failure isn’t the strategy itself, but the quality of the tool used to execute it. A slow or inaccurate CSM will consistently give you bad information. When evaluate a CSM, you should have a non-negotiable checklist to ensure it’s a professional-grade tool.
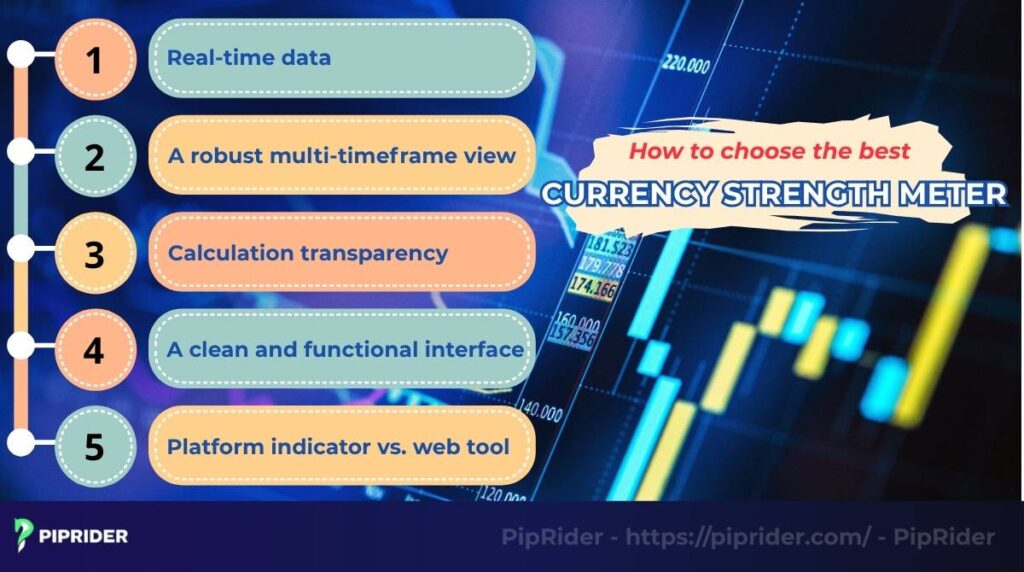
9.1. Real-time data
It is critical that the data refreshes from real-time exchange rates, with updates every few seconds at a minimum. While a five-minute data lag might be a minor issue for a long-term trader, for an intraday trader on the M5 chart, that same delay means the entire setup will have already passed. Accuracy requires speed.
9.2. A robust multi-timeframe view
A professional tool must allow you to see strength across multiple key timeframes (like M15, H1, H4, D1) on a single dashboard. This is critical for top-down analysis.
For example, seeing the USD is strong on both the D1 and H1 charts gives you high confidence to look for a buy. But if it’s strong on H1 and weak on D1, you know you are looking at a much riskier counter-trend move, indicating a higher risk level. This is especially true for risk currencies like the AUD or CAD, which can reverse quickly.
9.3. Calculation transparency
While you don’t need to know the complex math, a reputable provider should give you a general idea of how their strength is calculated. Do they use all 28 pairs? Is it based on weighted calculations or a Rate-of-Change formula?
A developer who is transparent about their methodology is generally more trustworthy than one who hides it behind a “secret formula.”
9.4. A clean and functional interface
The tool’s purpose is to provide clarity, not cause analysis paralysis. It should have a clean layout where you can instantly see the currency rankings without any distracting clutter. If you can’t interpret the data in under five seconds, the interface has failed.
9.5. Piprider’s recommendation: Platform indicator vs. web tool
Generally, CSM tools come in two main flavors: web-based tools and indicators you install on MT4 vs MT5. Web tools are convenient, but a high-quality indicator installed directly on your trading platforms is almost always superior.
It pulls data directly from your broker’s price feed, ensuring maximum speed and accuracy, and it’s integrated right into your trading platform’s charting workflow.
10. When the Currency Strength Meter Becomes Unreliable (The Danger Zones)
In institutional trading, knowing when to ignore a signal is more profitable than chasing every move. The Currency Strength Meter (CSM) is a mathematical derivative of price; therefore, it is susceptible to specific market anomalies that can produce “false positives.”
- Clustered Strength (The Equilibrium Trap): When the divergence between two currencies is minimal (e.g., USD at +2.1 and EUR at +1.8), the market is in a state of equilibrium. Without a significant “push-pull” gap, price action will likely result in a choppy, non-directional range. Professional traders strictly avoid pairs where the strength gap is less than 2.0 points.
- The Exhaustion Climax (Overextended Readings): A common beginner mistake is buying a currency just because it shows an extreme reading (e.g., +9 or +10). In reality, these extremes often signal momentum exhaustion rather than continuation. When a currency hits its historical ceiling on the meter, a mean-reversion (correction) is statistically more likely than a further breakout.
- Fundamental “Blackouts” (Pre-News Noise): Thirty minutes before Tier-1 releases (NFP, CPI, or FOMC), institutional liquidity providers often pull their orders. During this “blackout,” small retail flows can cause massive, erratic swings in the CSM. These readings are “noise” and will be completely invalidated the moment the actual data hits the tape.
- Liquidity Fragmentation (Data Feed Lag): Since Forex is a decentralized market (OTC), your CSM is only as good as its data source.
- Retail Lag: Many free web-based meters have a 1 – 5 minute delay. In a $9.6 trillion daily market (BIS, 2025), a 60-second lag makes the data obsolete for intraday execution.
- Feed Discrepancy: A meter pulling data from a single small broker will often show strength that does not exist on the major institutional interbank feeds.
- Timeframe Friction: When the Daily (D1) strength is in direct opposition to the 15-minute (M15) strength, the market is in a state of structural friction. This is not a time to trade. You are essentially betting on a short-term wave while the tide is moving against you.
Quick Summary: When to Stay Flat
This decision matrix provides a clear set of parameters for identifying “No-Trade” zones. By filtering out these high-risk scenarios, you can preserve your capital for environments where the Currency Strength Meter (CSM) provides high-conviction signals.
| Scenario | CSM Reading | Market Condition | Risk Level |
|---|---|---|---|
| Minimal Gap | Gap < 2.0 | No Momentum | High (Choppy) |
| Extreme Reading | Reading > +9 | Exhaustion Zone | High (Reversal) |
| Pre-News | Rapid Fluctuations | Liquidity Void | Extreme (Whipsaw) |
| Off-Peak | Low Volume Sessions | Market Noise | Medium |
11. Frequently asked questions (FAQs)
12. Conclusion
The Currency Strength Meter (CSM) is an indispensable tool for modern Forex traders. It automates analysis, saving time, and forces focus onto currency pairs with the highest potential for a strong trend. By pitting the strongest currency against the weakest, traders make data-driven decisions, improving their trading decisions and offering options for hedging.
Ready to stop wasting time? Find a reliable CSM and start applying this powerful strategy on a demo account today. Follow Piprider to learn more about the best technical indicators and other useful tools in trading today.
Infographic Section
-
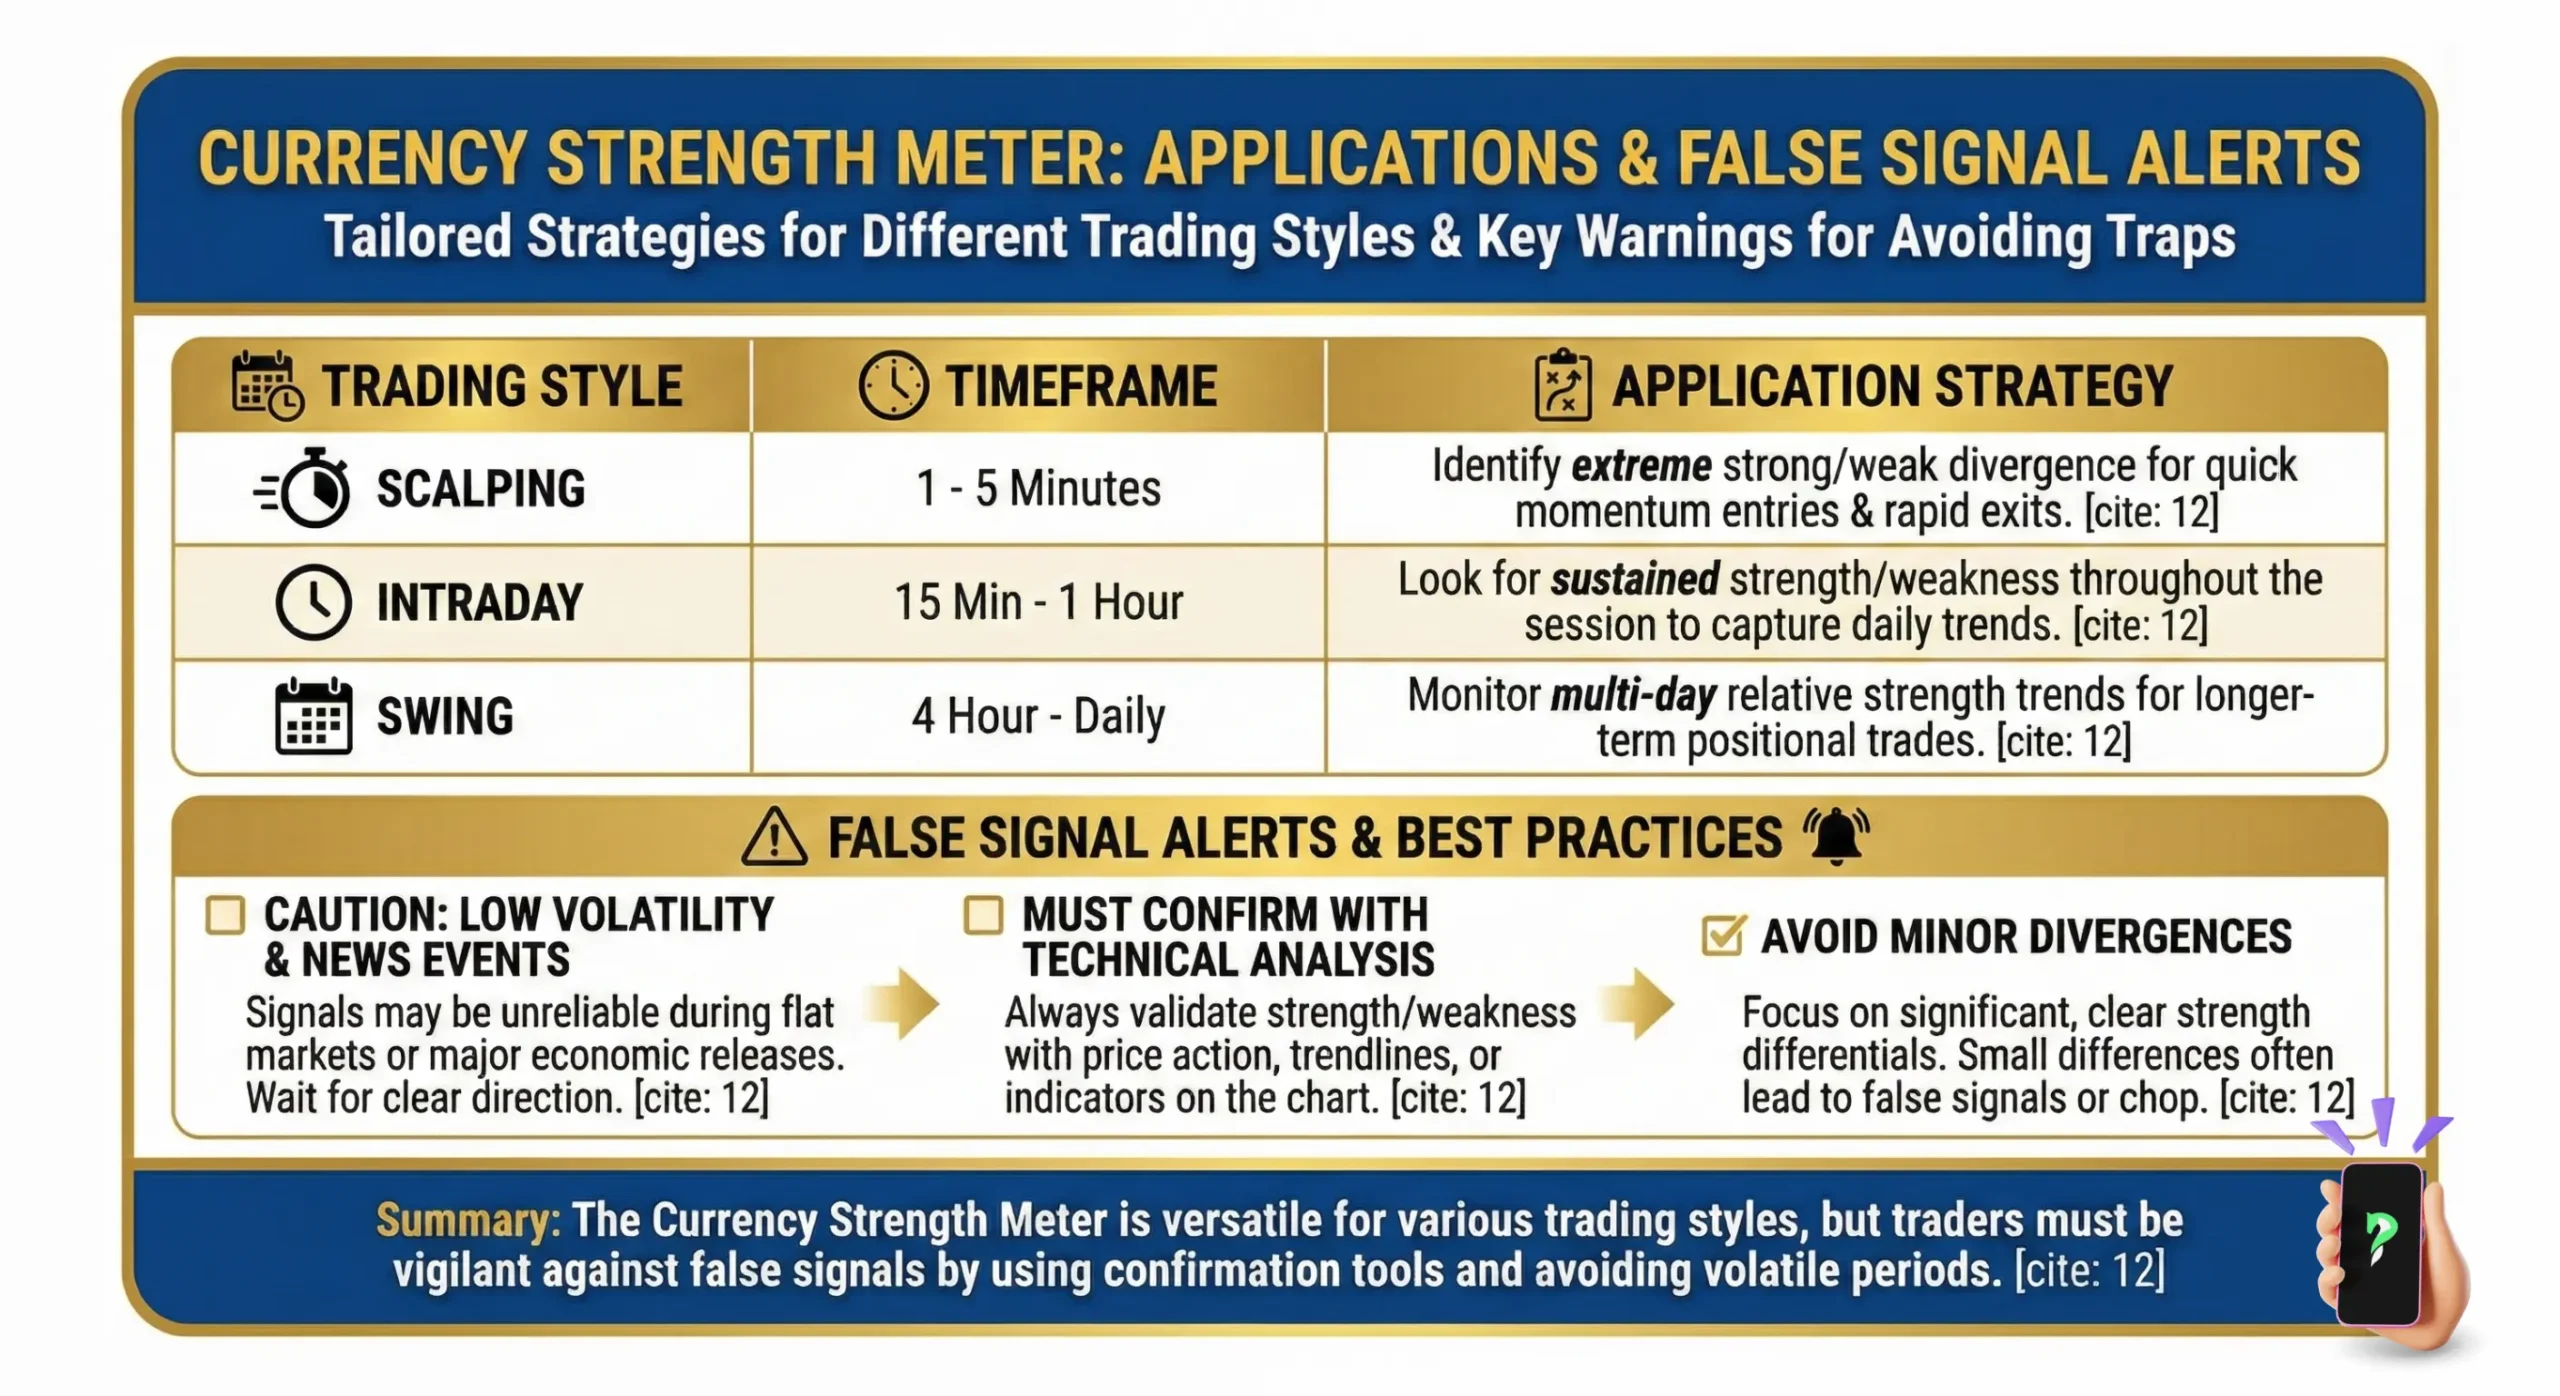
Applications and False Signal Alerts -
Currency Strength Meter -
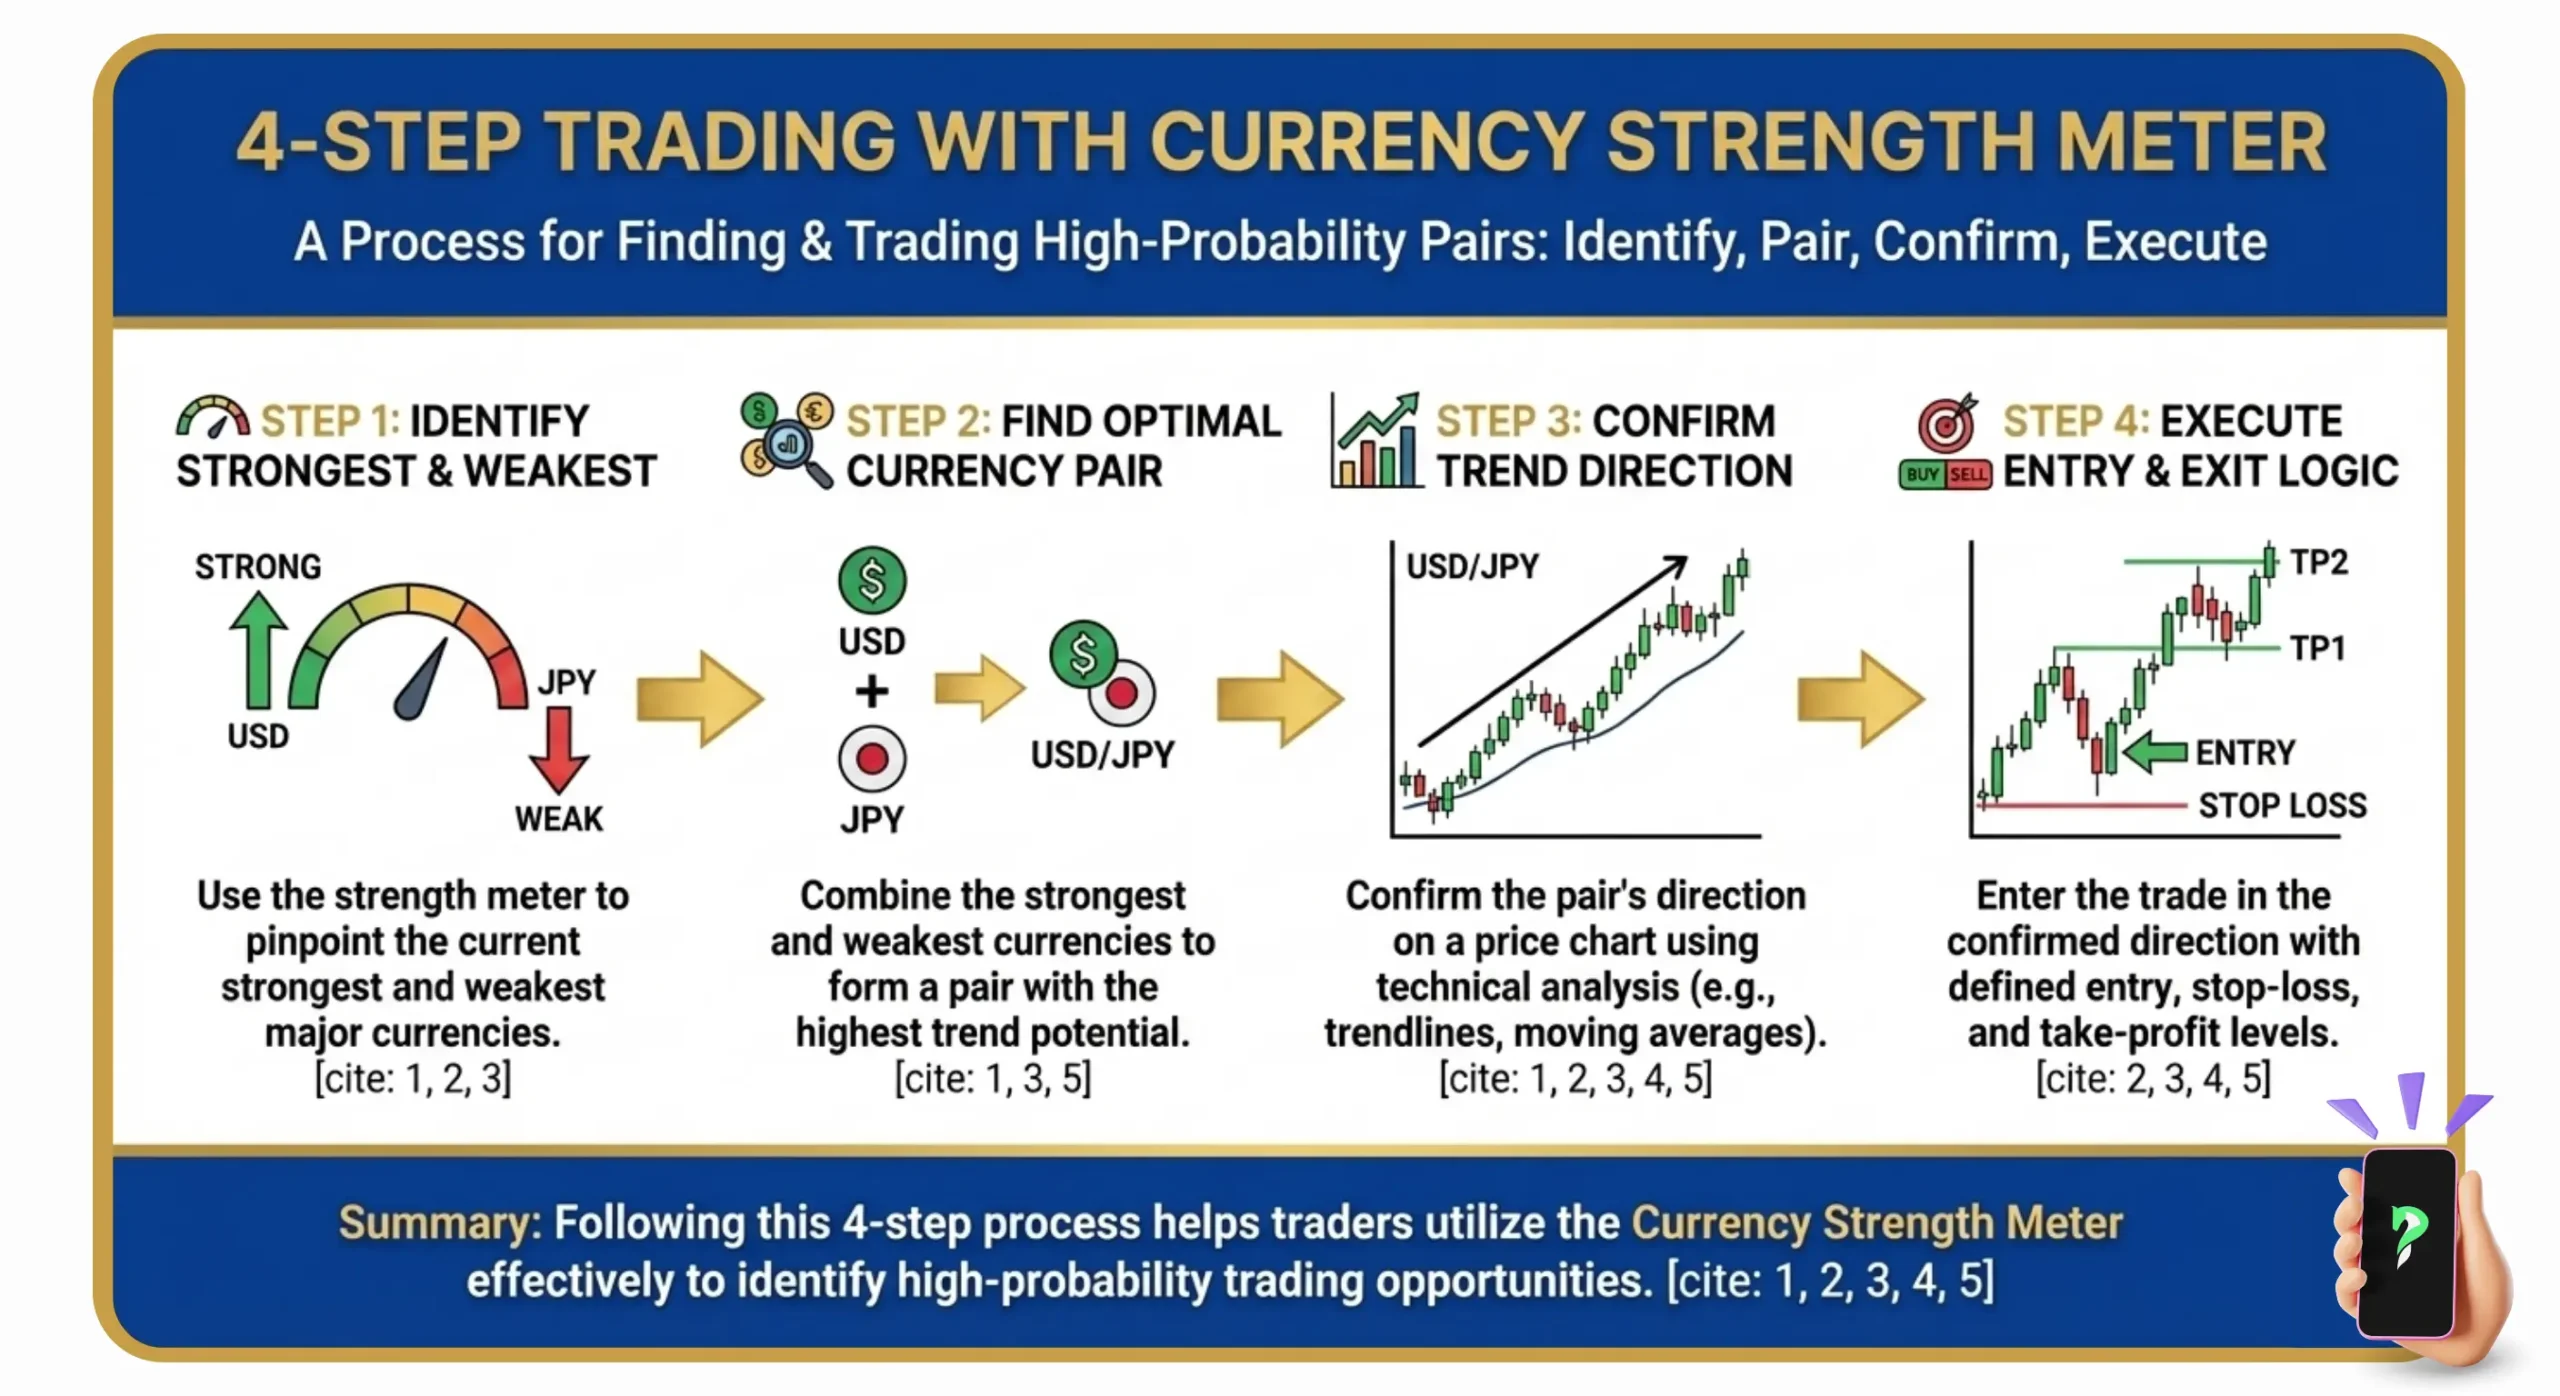
4 Step Trading with Currency Strength Meter


