In the Forex market, no currency pair moves in isolation. Each pair’s dance is intricately linked to others, driven by global economics, central bank policies, and shifting market sentiment. Understanding forex pair correlations, how closely two currency pairs move in relation to each other, is a crucial skill for any serious trader.
For most traders, correlation is not just a market concept; it is a practical risk-management tool that helps prevent duplicate exposure across multiple positions. This guide provides a comprehensive look at fx correlation, offering a practical framework for reading correlation tables, using live data tools, and applying these insights to make smarter trading decisions.
Key Takeaways
- The correlation coefficient: Quantifies the relationship between how two Forex pairs move relative to each other (+1 for perfect sync, -1 for perfect opposition, and 0 for no link).
- Risk management: Helps control overall risk exposure by avoiding unintentionally “stacking” highly correlated trades (e.g., being long both EUR/USD and GBP/USD).
- Trade confirmation: The movement of a highly correlated pair can be used to validate breakout or trend continuation signals on your primary pair.
- Dynamic nature: Correlations are not fixed; they shift over time due to economic divergence, requiring traders to monitor live data regularly using specialized tools.
1. What Is Correlation in Forex?
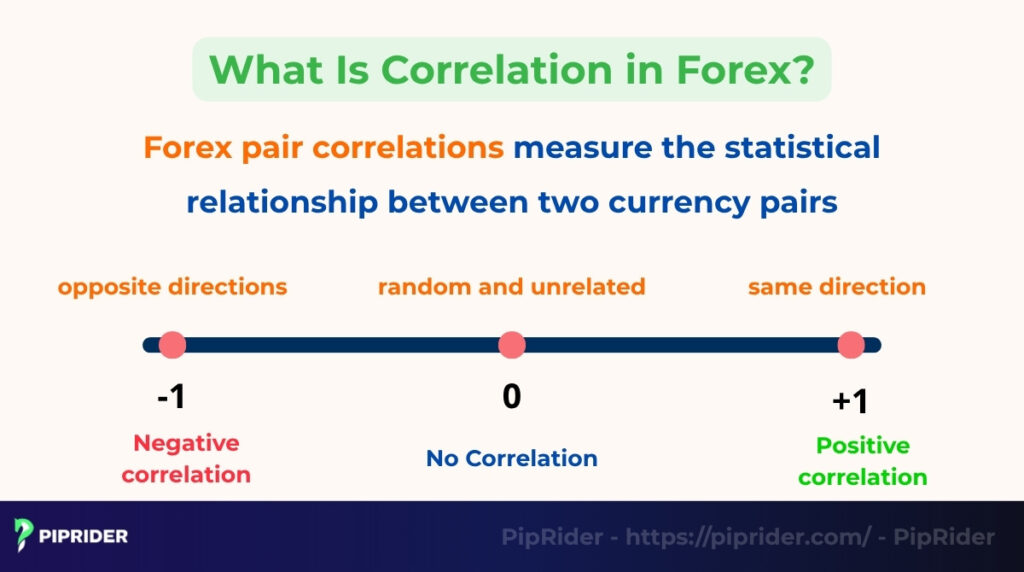
Forex pair correlations measure the statistical relationship between two currency pairs, showing how likely they are to move in the same, opposite, or random directions over a given period. It’s essentially quantifying how synced up their price movements are for each currency pair.
However, for a trader, correlation is a risk tool first and a mathematical concept second. It acts as an early warning system that prevents you from doubling your risk on the same market move without realizing it.
This relationship is measured using a correlation coefficient, which ranges from -1 to +1:
- +1 (positive correlation): Indicates that the two pairs move in the same direction almost perfectly. If one goes up, the other goes up.
- -1 (negative correlation): Indicates that the two pairs move in opposite directions almost perfectly. If one goes up, the other goes down.
- 0 (no correlation): Indicates that the movements between the two pairs are largely random and unrelated.
Understanding the correlation of currency pairs in forex is vital for traders because it directly impacts risk exposure. Trading multiple pairs without understanding their correlation can lead to unintentionally amplifying risk or unknowingly hedging positions across various assets. It’s also a key factor in effective portfolio diversification and implementing certain forex trading strategies involving different currency types like the EUR or GBP.
2. Formula for Correlation
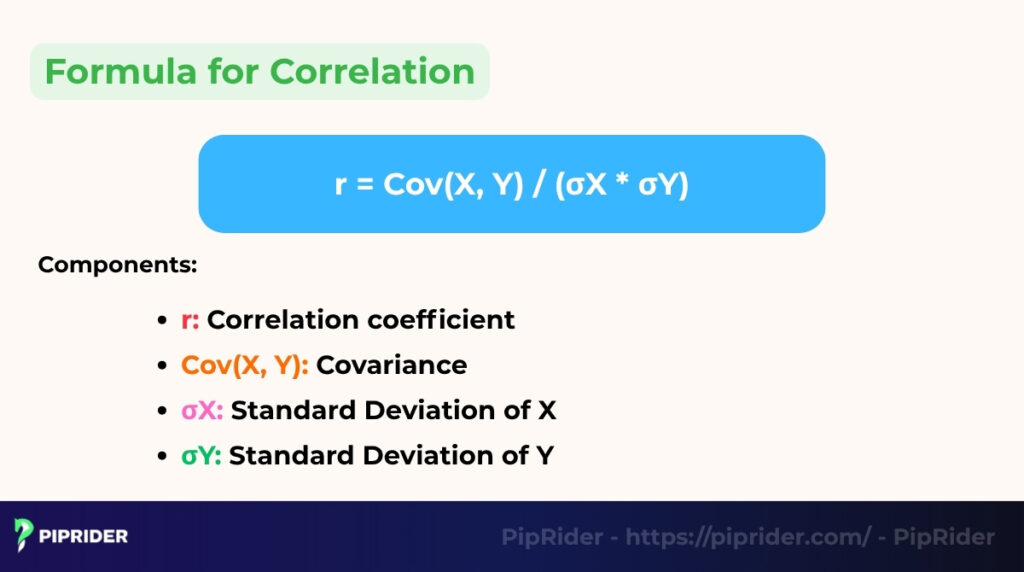
While most traders use automated tools, understanding the logic behind the numbers is helpful. The standard method for quantifying the relationship between pairs is the Pearson correlation coefficient.
Essentially, this formula measures how two currency pairs move together relative to their individual volatility.
The formula is expressed as:
r = Cov(X, Y) / (σX * σY)
To keep it simple:
- r: The final correlation coefficient (between -1 and +1).
- Cov(X, Y) (Covariance): Measures if the pairs move in the same or opposite direction.
- σX and σY (Standard Deviation): Represent the volatility of each individual pair.
Practical tip: You do not need to calculate this manually. In a fast-moving market, search intent shifts toward real-time data. Traders rely on live correlation matrices or platform indicators that handle these complex calculations instantly, allowing you to focus on risk management rather than math.
3. Quick Correlation Rules for Beginners
Before diving into complex matrices, use these fundamental rules to protect your capital and streamline your decision-making:
- Rule 1: Don’t stack correlated trades. Opening long positions on both EUR/USD and GBP/USD is not “diversification”—it is effectively one large trade on USD weakness. If the USD suddenly rallies, both trades will likely hit their stop losses.
- Rule 2: Check “live” vs. historical data. Always verify that the correlation you are relying on is current. A relationship that held true for 6 months can break down in minutes during a central bank announcement.
- Rule 3: Use correlation for risk, not just prediction. Correlation tells you how pairs move together, but it doesn’t guarantee why they are moving. Use it to reduce risk exposure first, rather than trying to use one pair to “predict” the exact price of another.
- Rule 4: Monitor macro shifts. Major geopolitical events or changes in interest rate policies can flip correlations (e.g., from positive to negative) almost overnight. Re-check your correlation table after every major news event.
4. How to Read a Correlation Table
To interpret a correlation matrix effectively, use these standard thresholds for decision-making:
| Correlation coefficient | Strength | Trading action |
| +0.80 to +1.00 | Very strong positive | High risk of overexposure if trading both |
| +0.30 to +0.70 | Moderate positive | Some relationship exists; monitor for divergence |
| -0.30 to +0.30 | Weak / Negligible | Pairs move independently; good for diversification |
| -0.80 to -1.00 | Very strong negative | Ideal for hedging or identifying inverse signals |
Key considerations for reading tables:
- Timeframe matters: Correlation values depend heavily on the period (e.g., 1-week vs. 6-months). Short-term spikes can differ from long-term trends.
- Color coding: Most live tools use Green for positive and Red for negative correlations. The deeper the color, the stronger the relationship.
- Regular updates: Because market themes shift (e.g., from “Inflation focus” to “Growth focus”), it is wise to review your correlation cheat sheet monthly.
5. Common Forex Pair Correlation Examples
Correlation data is most often presented in a table or matrix format. This provides a quick visual reference for how different pairs typically relate to each other.
Common Forex Correlation Examples
Below are some of the most consistent relationships in the market (note: these values shift based on current market dynamics):
| Correlation Pair | Correlation Strength | Type | Meaning / Underlying Driver |
| EUR/USD & GBP/USD | +0.85 | Positive | Shared economic ties to the Eurozone and UK |
| EUR/USD & USD/CHF | -0.92 | Negative | CHF is a safe haven; USD/CHF moves inversely to EUR/USD |
| AUD/USD & NZD/USD | +0.89 | Positive | Geographic proximity and commodity export reliance |
| USD/CAD & Oil prices | -0.80 | Negative | CAD strength is highly sensitive to crude oil prices |
6. Where to Check Live Forex Correlations
Since correlations shift over time, relying on static data is a common beginner’s mistake. For practical trading, you need access to real-time matrices that reflect current market sentiment.
The following tools are widely considered the industry standard for tracking live correlation data:
- Myfxbook correlation matrix: This is the most popular tool for traders. It provides an interactive matrix from -100% to +100% and allows you to filter by specific timeframes (e.g., 1 minute to 1 month). This is excellent for spotting “live” shifts in currency relationships.
- Mataf correlation table: Known for its clean and customizable interface. Mataf allows you to compare a vast array of pairs (majors, minors, and exotics) side-by-side to see which relationships are strengthening or decaying.
- TradingView correlation coefficient indicator: If you prefer visual analysis directly on your charts, TradingView offers a “Correlation Coefficient” indicator. You can overlay one pair (like EUR/USD) over another (like USD/CHF) to see the inverse relationship plotted in real-time as the candles form.
Pro tip: Most institutional-grade live tools provide a “Heatmap” view. Focus on the darkest green (strong positive) and darkest red (strong negative) cells, as these represent the most reliable relationships for immediate risk management decisions.
7. When Forex Correlations Break Down
A crucial mistake traders make is assuming forex pair correlations are fixed. They are not. The relationships between currencies are dynamic and constantly shift based on underlying economic and political factors. Understanding why and when these links fail is essential for avoiding “correlation traps”.
Why correlations shift
Correlations can strengthen, weaken, or even flip entirely due to:
- Diverging economic conditions: Changes in interest rate differentials (driven by central bank policies), inflation rates, or economic growth prospects between two countries.
- Shifts in risk sentiment: During “Risk-On” or “Risk-Off” cycles, traditional links often vanish. In a global panic, many assets may suddenly correlate positively with safe havens (USD, JPY) regardless of their usual fundamentals.
- Commodity price volatility: Significant swings in oil or gold can decouple commodity currencies (AUD, CAD) from their usual major pair correlations.
Critical breakdown scenarios
There are specific environments where historical correlations become unreliable:
- Central bank surprises: If the ECB unexpectedly cuts rates while the Fed remains hawkish, the correlation between EUR/USD and GBP/USD may collapse as the Euro decouples from its European neighbor.
- Geopolitical shocks: Events like wars, sanctions, or unexpected election results create localized volatility that overrides global correlation patterns.
- Liquidity crises: During extreme market stress, correlations often “converge to 1.” Almost every asset may move in unison against the US Dollar as traders scramble for cash liquidity.
- Abrupt commodity repricing: A sudden crash in oil prices can cause the USD/CAD to skyrocket, even if the US Dollar is weak against other currencies like the EUR or JPY.
Example: During the peak of a financial crisis, the normally strong negative correlation between EUR/USD and USD/CHF can weaken significantly. Both the EUR and CHF may strengthen simultaneously against a fleeing USD due to extreme risk aversion, disrupting the usual inverse dance.
8. Which Correlation Period Should Traders Use?
One of the most common questions for traders is choosing the right “look-back” period. Correlation isn’t a single number; it changes depending on the timeframe you analyze. Using the wrong period can lead to false confidence in a relationship that no longer exists or missing a long-term trend.
Timeframe guide for trading styles
To make informed decisions, align your correlation analysis with your holding period:
- Intraday traders (scalpers/day traders): Use shorter rolling windows (e.g., 1-hour to 1-day correlations). This helps identify immediate price lead/lag relationships and ensures you aren’t fighting a sudden short-term decoupling.
- Swing traders: Focus on the 1-month to 3-month view. This period is stable enough to filter out “market noise” while remaining responsive to changes in monthly economic data or central bank shifts.
- Position traders (long-term): Look at the 3-month to 1-year context. This reveals the core fundamental drivers of the market, helping you build a diversified portfolio that stands the test of time.
What if short-term and long-term data conflict?
It is common to see a pair show a +0.90 correlation over 6 months but a -0.20 correlation over the last week. This is called correlation decay.
- If the short-term correlation breaks down: It usually signals a major news event or a shift in central bank policy affecting one specific currency.
- The golden rule: Always compare the short-term (1-week) vs. medium-term (1-month) data before acting. If they align, the signal is high-probability. If they diverge, reduce your position size until the relationship stabilizes.
9. How to Use Correlations in Forex Trading
Understanding the correlations isn’t just theoretical; it has direct, practical applications for improving forex trading decisions and managing risk. Here are four key ways traders leverage this knowledge.
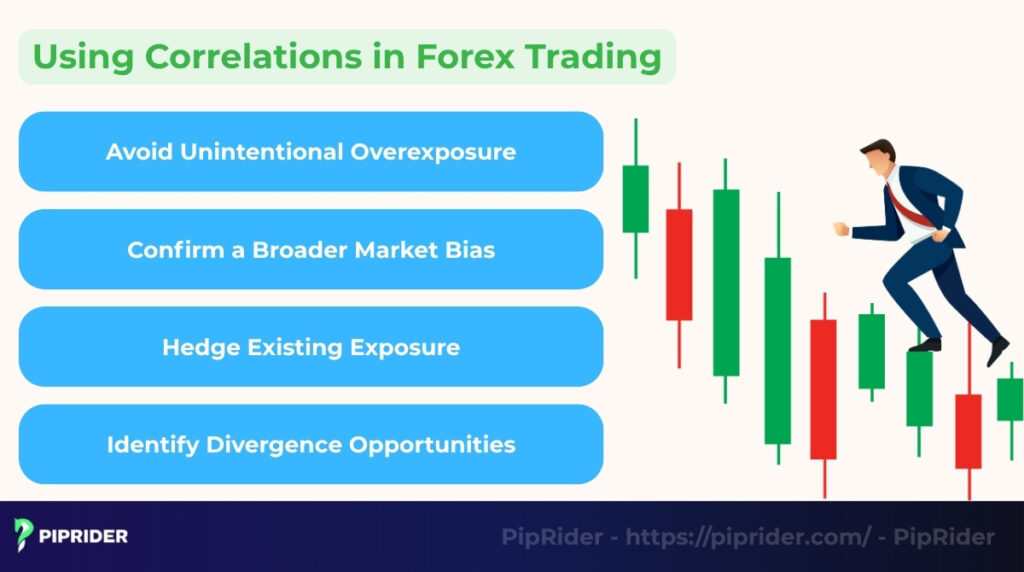
9.1. Avoid Unintentional Overexposure (Risk Stacking)
This is perhaps the most crucial use. If you open multiple long positions on pairs that are strongly positively correlated (like EUR/USD and GBP/USD), you aren’t diversifying—you are stacking risk on a single market theme (USD weakness).
The Math of Risk Stacking:
- Trade A: Long EUR/USD with 1% risk
- Trade B: Long GBP/USD with 1% risk
- Reality: If the correlation is +0.90, these trades move almost in lockstep. Your total portfolio risk behaves closer to one large 2% bet on USD weakness rather than two independent 1% trades. If the USD suddenly strengthens, both trades will likely fail simultaneously
9.2. Confirm a Broader Market Bias
Correlations can help validate a fundamental or technical view. If you believe the US Dollar is strengthening, you should see multiple USD pairs showing similar price action. For example, if EUR/USD is falling, GBP/USD is falling, and USD/JPY is rising simultaneously, you have broad-based confirmation of USD strength, increasing the probability of your trade.
9.3. Hedge Exposure Correctly
Negatively correlated pairs can be used to reduce potential losses on an open position. However, you must align your trade direction with the inverse relationship.
Correct Hedging Example: The correlation between EUR/USD and USD/CHF is strongly negative (they move in opposite directions).
- If you have a Long EUR/USD position and want partial protection against a sudden USD rally, you should consider a Long USD/CHF position.
- Because they move oppositely, a loss on the EUR/USD (as it falls) would be partially offset by a gain on the USD/CHF (as it rises), effectively shielding your equity from extreme drawdowns.
9.4. Spot Divergence Opportunities
Occasionally, two pairs that are normally strongly correlated will move in different directions. This divergence can signal a “lead-lag” opportunity. If EUR/USD breaks out to a new high but GBP/USD stays flat, the GBP/USD might be “lagging” and likely to catch up, or it could signal that the Euro is uniquely strong due to specific Eurozone news.
10. Cross-Market Correlations (Bonus Insight)
The concept of correlation extends beyond just Forex pairs. Currencies are often influenced by other major financial markets, particularly commodities and stocks. Understanding these relationships provides a “big picture” view of the market.
10.1. Commodity Correlations
“Commodity currencies” often move in sync with the raw materials their countries export:
- AUD/USD & Gold/Iron Ore: As a major exporter of these metals, the Australian Dollar (AUD) typically strengthens when their prices rise.
- USD/CAD & Oil: Canada is a top oil exporter. Consequently, the Canadian Dollar (CAD) tends to strengthen (causing USD/CAD to fall) when crude oil prices increase.
10.2. Currency–Stock Correlations
These relationships are driven by global risk sentiment:
- JPY & Stocks (Inverse): The Japanese Yen is a safe-haven. When stock indices like the S&P 500 crash (Risk-Off), investors buy JPY for safety, causing it to strengthen against the USD or EUR, which is a critical factor when using correlations when trading indices.
- AUD/USD & Stocks (Positive): The AUD is a “risk-on” currency. It tends to rally when global stock markets are bullish, reflecting investor optimism about global economic growth.
11. Frequently asked questions about Forex Pair Correlations
12. The Bottom Line
Understanding forex pair correlations is fundamental to navigating the foreign exchange market effectively. It’s a critical tool that helps traders manage risk, confirm trend signals, and crucially, avoid unintentionally stacking exposure through correlated trades.
However, remember that these relationships are dynamic and change over time due to shifting economic factors. Always ensure you are working with up-to-date correlation data for any currency.
PipRider provides independent correlation insights and strategy guides to help traders leverage this knowledge and trade smarter. Don’t forget to follow our Trading Tools section to learn more about helpful tools!