
The Donchian Channel is a straightforward technical indicator that maps the highest and lowest prices over a set period. It transforms chaotic price movements into clear, actionable signals, helping forex traders identify trends and potential breakouts with greater confidence.
This guide will walk you through everything from its core mechanics to practical trading strategies. You’ll learn how to set it up, adjust its settings, and combine it with other tools to enhance your technical analysis.
Search lock: The Donchian Channel works best as a breakout and trend-following tool. It is designed to identify market extremes and momentum shifts. However, it is less reliable in sideways or “choppy” markets; therefore, traders should treat it as a structure-based confirmation tool rather than a standalone entry command.
Key Takeaways
- The Donchian Channel tracks the highest and lowest price to help identify market trends and breakouts.
- Consists of three bands (upper, lower, and middle) to show momentum and volatility.
- This tool is ideal for breakout and reversal trading strategies.
- Traders can adjust the period (e.g., 20 for day trading, 50 for swing trading) to fit their style.
- It works best in trending markets but can give false signals in sideways conditions.
1. What is the Donchian Channel?
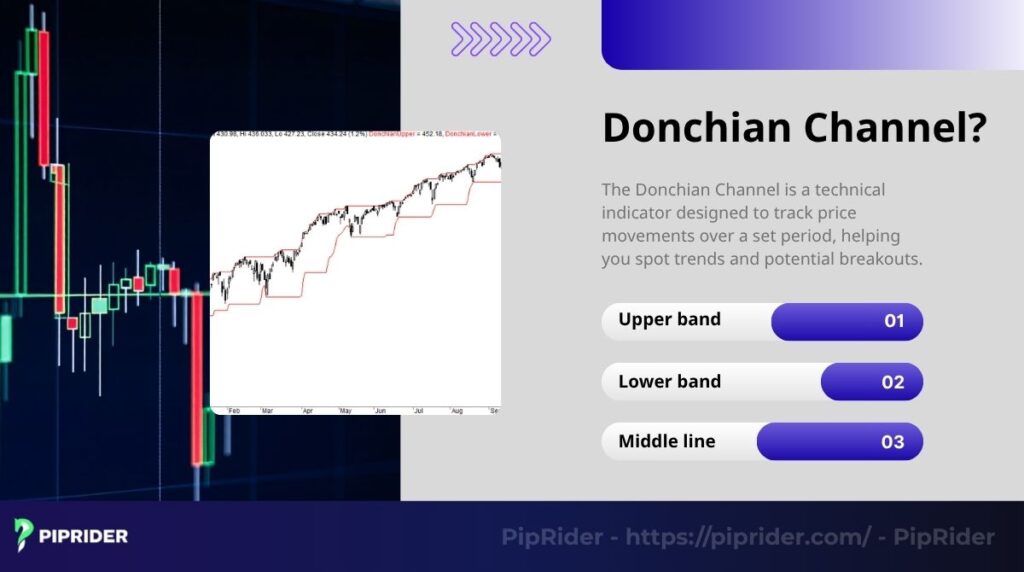
The Donchian Channel is a technical indicator designed to track price movements over a set period, helping traders spot trends and potential breakouts. It was created by Richard Donchian, a pioneer in futures trading during the 1940s (Murphy, 1999).
Quick definition: Donchian Channel
- Core logic: Tracks the absolute highest high and lowest low over a specific lookback period.
Best use: Identifying breakouts and trend strength.
Middle line: The exact midpoint between the upper and lower extremes.
Primary limitation: Prone to “whipsaws” (false signals) when the market lacks a clear direction.
His work laid the foundation for trend following, and the Donchian Channel itself was the core of the famous turtle trading system, where entry rules were based on the price breaking above or below a specific period’s high or low (e.g., 20 days). The channel is highly customizable and is built into many modern platforms like TradingView.
The indicator consists of three lines:
- Upper band (also known as the upper channel): Represents the peak price reached within the selected time frame.
- Lower band (also known as the lower channel): Represents the lowest price recorded during that same time frame.
- Middle line: The average of the upper and lower bands, calculated as (Upper Band + Lower Band) / 2.
These lines form a channel that shows where prices are moving, which makes it easier to decide when to trade. For instance, when the price gets close to the upper band, the donchian channel may indicate robust upward momentum.
In forex, where prices can swing wildly, the Donchian Channel acts like a roadmap. This indicator is built into many modern platforms like TradingView and can be easily installed as a custom indicator on other popular platforms like MT4, allowing you to get started without needing fancy software.
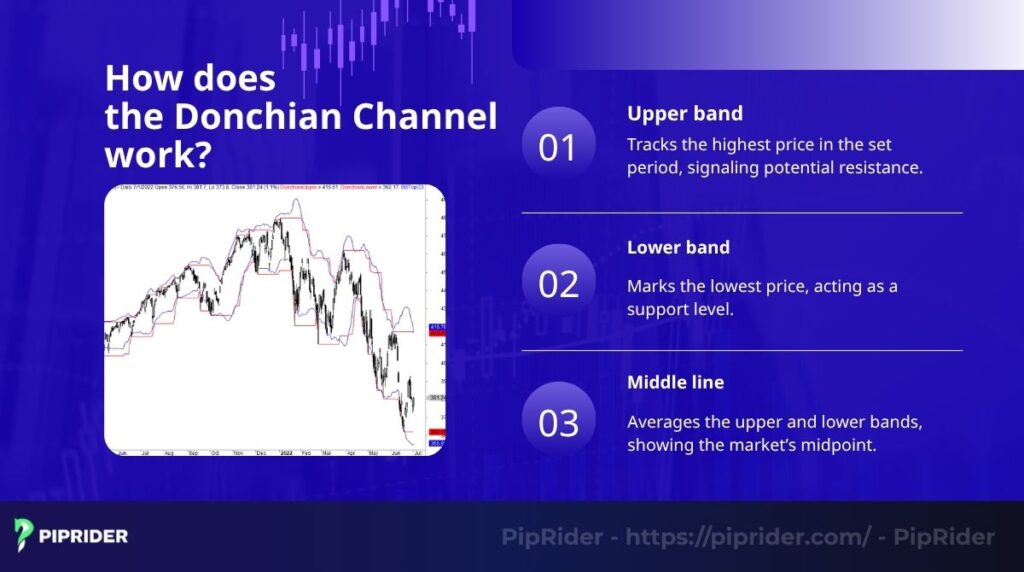
2. How does the Donchian Channel work?
The Donchian Channel works by plotting three lines based on a chosen time frame, typically 20 candlesticks (representing roughly one trading month). These lines act as a visual guide to the market’s momentum and volatility.
- Upper band: Tracks the highest price in the set period.
- Lower band: Marks the lowest price in the set period.
- Middle line: The average of the upper and lower bands, showing the market’s technical midpoint.
Quick interpretation: Reading the bands
| Price Behavior | Market Meaning |
|---|---|
| Price rides the Upper Band | Strong bullish momentum; potential breakout |
| Price rides the Lower Band | Strong bearish momentum; potential breakdown |
| Price returns to Middle Line | Market cooling off; potential mean reversion or pause |
| Channel is Widening | Volatility is increasing; price range is expanding |
| Channel is Narrowing | Volatility is decreasing; market is consolidating |
3. How to Use the Donchian Channel: A Decision Framework
Successful trading with Donchian Channels requires matching the indicator’s signals to the current market environment. Rather than following every band touch, use this framework to determine your approach.
Use case 1: Breakout trading (High volatility)
- Best for: Markets reacting to major news or exiting a long consolidation.
- Entry: A buy is typically signaled when a candle closes decisively above the upper band. A sell is signaled by a close below the lower band.
- Avoid when: The channel is extremely narrow and the price is oscillating rapidly without “holding” outside the bands.
Use case 2: Trend-following (Established trends)
- Best for: Sustained moves where price stays in the upper or lower half of the channel.
- Entry: When a trend is established, traders often look for the price to remain between the middle line and the outer band. A dip to the middle line that fails to break through can signal a “buy the dip” opportunity.
- Avoid when: Price crosses the middle line frequently, indicating the trend has lost momentum.
Use case 3: Reversal/Mean reversion (Range-bound)
- Best for: Calm market sessions (e.g., Asian session for some pairs) or when price is overstretched.
- Entry: A reversal may be in play when the price touches an outer band but fails to close outside it, followed by a rejection candle heading back toward the middle line.
- Avoid when: A strong fundamental driver is present, as the price can “hug” the band for a long time during a trend.
4. Donchian Channel Settings: Picking the Right Period
The “period” refers to the number of candles the indicator looks back to find the high and low. While 20 is the standard default, adjusting this allows you to tailor the indicator to your specific strategy.
Setting decision table
| Trading Style | Suggested Period | Benefit | Trade-off |
|---|---|---|---|
| Scalping | 5 – 10 | Faster detection of micro-breakouts | High “noise” and more false signals |
| Day Trading | 20 | Balanced; reflects standard monthly cycles | May miss very early momentum shifts |
| Swing Trading | 50 – 100 | Filters out daily noise; captures major trends | Later entries; stop-losses are often wider |
Key rule: Shorter periods make the channel more sensitive to price changes, resulting in more signals but a higher risk of “whipsaws”. Longer periods provide more reliable structural levels but will lag behind immediate price action.
5. Donchian Channel Strategies: Practical Playbook
The following strategies demonstrate how to execute trades using a systematic approach. By standardizing your entry and exit rules, you can remove emotional bias from your technical analysis.
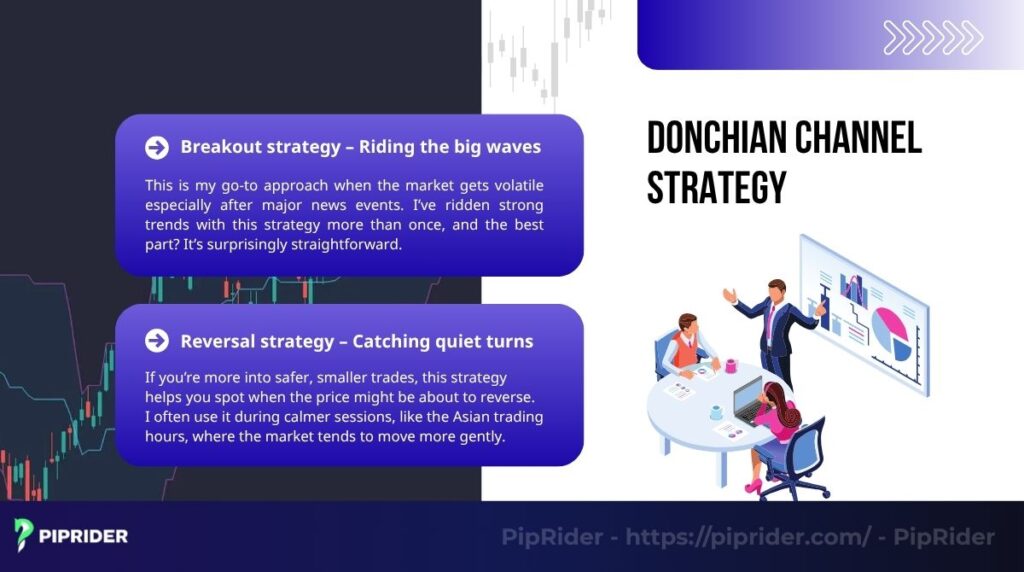
5.1. Breakout strategy (Trend-following)
This strategy is designed to capture high-momentum moves, often following consolidation or major news events.
- Best for: High-volatility markets and trending currency pairs.
- Setup: The price compresses into a narrow range, causing the Donchian Channels to flatten and tighten.
- Entry trigger: A buy signal is generated when a candle closes decisively above the upper band. A sell signal is generated when a candle closes decisively below the lower band. (Some traders prefer two consecutive closes outside the band to filter out “fakeouts”).
- Confirmation: Look for an expansion in volatility (widening bands) and supporting momentum from volume or a secondary oscillator.
- Stop-loss: Place the stop-loss below the breakout candle’s low or the most recent swing high/low. Using the opposite band as a stop-loss is possible but often creates an unfavorable risk-to-reward ratio.
- Take-profit: Use a trailing stop (moving it along the middle line or the opposite band as the trend progresses) or exit at a pre-defined resistance/support level.
5.2. Mean Reversion Strategy (Range-bound)
This approach focuses on identifying price exhaustion at the channel extremes during calmer market phases.
- Best for: Range-bound markets or quiet sessions (e.g., Asian session).
- Setup: The channel remains relatively horizontal (flat), and the price is oscillating between the upper and lower bands.
- Entry trigger: Price touches or pierces an outer band and is immediately followed by a rejection candle (like a pin bar or engulfing pattern) that closes back inside the channel.
- Confirmation: Check for overbought/oversold conditions on an oscillator like RSI or Stochastic.
- Stop-loss: Place the stop-loss just beyond the high or low of the rejection candle.
- Take-profit: The primary target is the middle line. A secondary target can be the opposite band if momentum remains steady.
6. Real-World Trade Analysis: AUD/USD Case Study
To understand how these rules apply in a live environment, let’s analyze a typical breakout trade on the AUD/USD 1-hour chart using a 20-period setting.
Context: The market was consolidating ahead of a major Australian employment report. The Donchian Channel was narrow, indicating low volatility.
The trade execution:
- Signal: Upon the news release, a large bullish candle broke and closed decisively above the upper band.
- Entry: A buy order was placed at the open of the next candle, following the confirmed breakout close.
- Stop-Loss: Instead of placing the stop at the distant lower band, it was placed just below the breakout structure (the high of the previous consolidation range).
- Targeting: Rather than exiting at the middle line (which would cut a trend trade short), a trailing stop was used. The trade remained open as long as the price stayed in the upper half of the channel.
The lesson: The Donchian Channel is most powerful when the breakout aligns with a volatility expansion. Entering a breakout when the channel is already overstretched is risky; the highest probability trades occur when the channel is just beginning to widen.
7. Confirming Signals: Combining Tools
No indicator is perfect. To reduce the risk of false breakouts, traders often map the Donchian Channel to secondary tools that measure different market dimensions.
Confirmation Tool Mapping
| Secondary Tool | Role with Donchian Channel | Helps With… |
|---|---|---|
| RSI | Filters for price exhaustion | Avoiding “buying the top” of a breakout when RSI is >70 |
| MACD | Confirms trend momentum | Ensuring momentum is moving in the direction of the breakout |
| ATR | Measures market volatility | Setting adaptive stop-losses based on current price swings |
| Volume | Validates breakout strength | Confirming if a band break is backed by institutional participation |
8. Donchian Channels vs. Bollinger Bands: What’s the Difference?
At first glance, Donchian Channels and Bollinger Bands appear visually similar, as both create a price envelope. However, they are based on entirely different mathematical foundations and serve different purposes in a trader’s toolkit.
| Feature | Donchian Channel | Bollinger Bands |
|---|---|---|
| Calculation | Highest high and lowest low (Structural) | Simple Moving Average ± Standard Deviation (Statistical) |
| Sensitivity | Reacts only when new highs or lows are made | Reacts to every price change and volatility shift |
| Best Use Case | Pure breakout and trend-following | Volatility cycles and mean reversion |
Which One Should You Choose?
- Choose Donchian Channels: if your strategy relies on price structure. It is superior for identifying clear “line-in-the-sand” breakout levels and for trailing stops behind recent swing highs or lows.
- Choose Bollinger Bands: if your strategy relies on volatility and statistics. It is better for identifying when a market is “overstretched” relative to its recent average (mean reversion) or for timing the “Bollinger Squeeze”.
9. Market Fit: When Donchian Channels Work Best (and When They Fail)
To use this tool effectively, you must recognize the market environments where it thrives and where it produces “whipsaws”.
Donchian Channels work best when:
- The market is trending: In a strong trend, the price consistently “hugs” or pushes one of the outer bands.
- Volatility is expanding: When the channel width increases rapidly, it often confirms the start of a major directional move.
- Exiting consolidation: It provides the cleanest signals when a market breaks out of a long, narrow “sideways” range.
Donchian Channels fail more often when:
- The market is range-bound: In sideways markets, the price may touch the upper band and immediately reverse to the lower band, triggering false signals in both directions.
- Trading “blindly”: Entering every time the price touches a band without looking at the channel’s slope or secondary confirmation often leads to losses.
- During low-liquidity periods: Breakouts during bank holidays or session overlaps with low volume are prone to being false moves.
10. Pros, cons, and limitations of Donchian Channels
Donchian Channels are beloved by many traders, but let’s be real it’s not some magical all-knowing indicator. Here’s the good, the bad, and the limitations you should know before leaning too heavily on it:
| Pros | Cons |
| Extremely beginner-friendly, even for those with no prior experience. | Can lag behind price, especially in fast markets |
| Excellent for spotting clear trends and breakouts | Often gives false signals in choppy, sideways markets |
| Widely available (built-in on TradingView, installable on MT4) | Needs confirmation from other indicators |
11. FAQs about Donchian Channels
12. Conclusion
The Donchian Channel is a simple yet powerful indicator that helps forex traders spot trends and identify key structural levels with greater confidence. By mapping the market’s highest highs and lowest lows, it removes the guesswork from identifying breakouts and trend strength.
Whether you are executing a high-volatility breakout strategy or using the channels as a framework for trailing stops, the key to success lies in context. Always consider the current market environment—trending or range-bound—and use secondary tools like RSI or ATR to confirm your bias.
At PipRider, we believe that mastering price structure is the foundation of any professional trading plan. The Donchian Channel is an essential tool in that journey, providing a clear roadmap through the often-chaotic forex markets.


