While price indicators like the MACD focus on market direction, they do not account for the level of market participation. The Percentage Volume Oscillator (PVO) addresses this by measuring volume momentum rather than price action.
Often referred to as the “MACD for volume,” the PVO helps traders assess whether a trend is supported by rising activity or if it lacks conviction. This guide outlines the PVO’s calculation, interpretation, and practical applications for validating breakouts and potential reversals.
Key Takeaways
-
Volume Momentum: The PVO measures the percentage difference between a fast and a slow volume EMA to track changes in market activity.
-
Interpreting the Zero Line: A positive PVO (>0) indicates that short-term volume is higher than the long-term average. This confirms strong participation, but does not inherently signal a buy or sell direction.
-
Breakout Confirmation: Breakouts are statistically more reliable when the PVO is rising. A breakout with a flat or falling PVO signals weak interest (potential “fake-out”).
-
Divergence Warning: Divergences between Price and PVO (e.g., Price rising, PVO falling) serve as early warning signs of a trend reversal.
1. What Is the Percentage Volume Oscillator (PVO)?
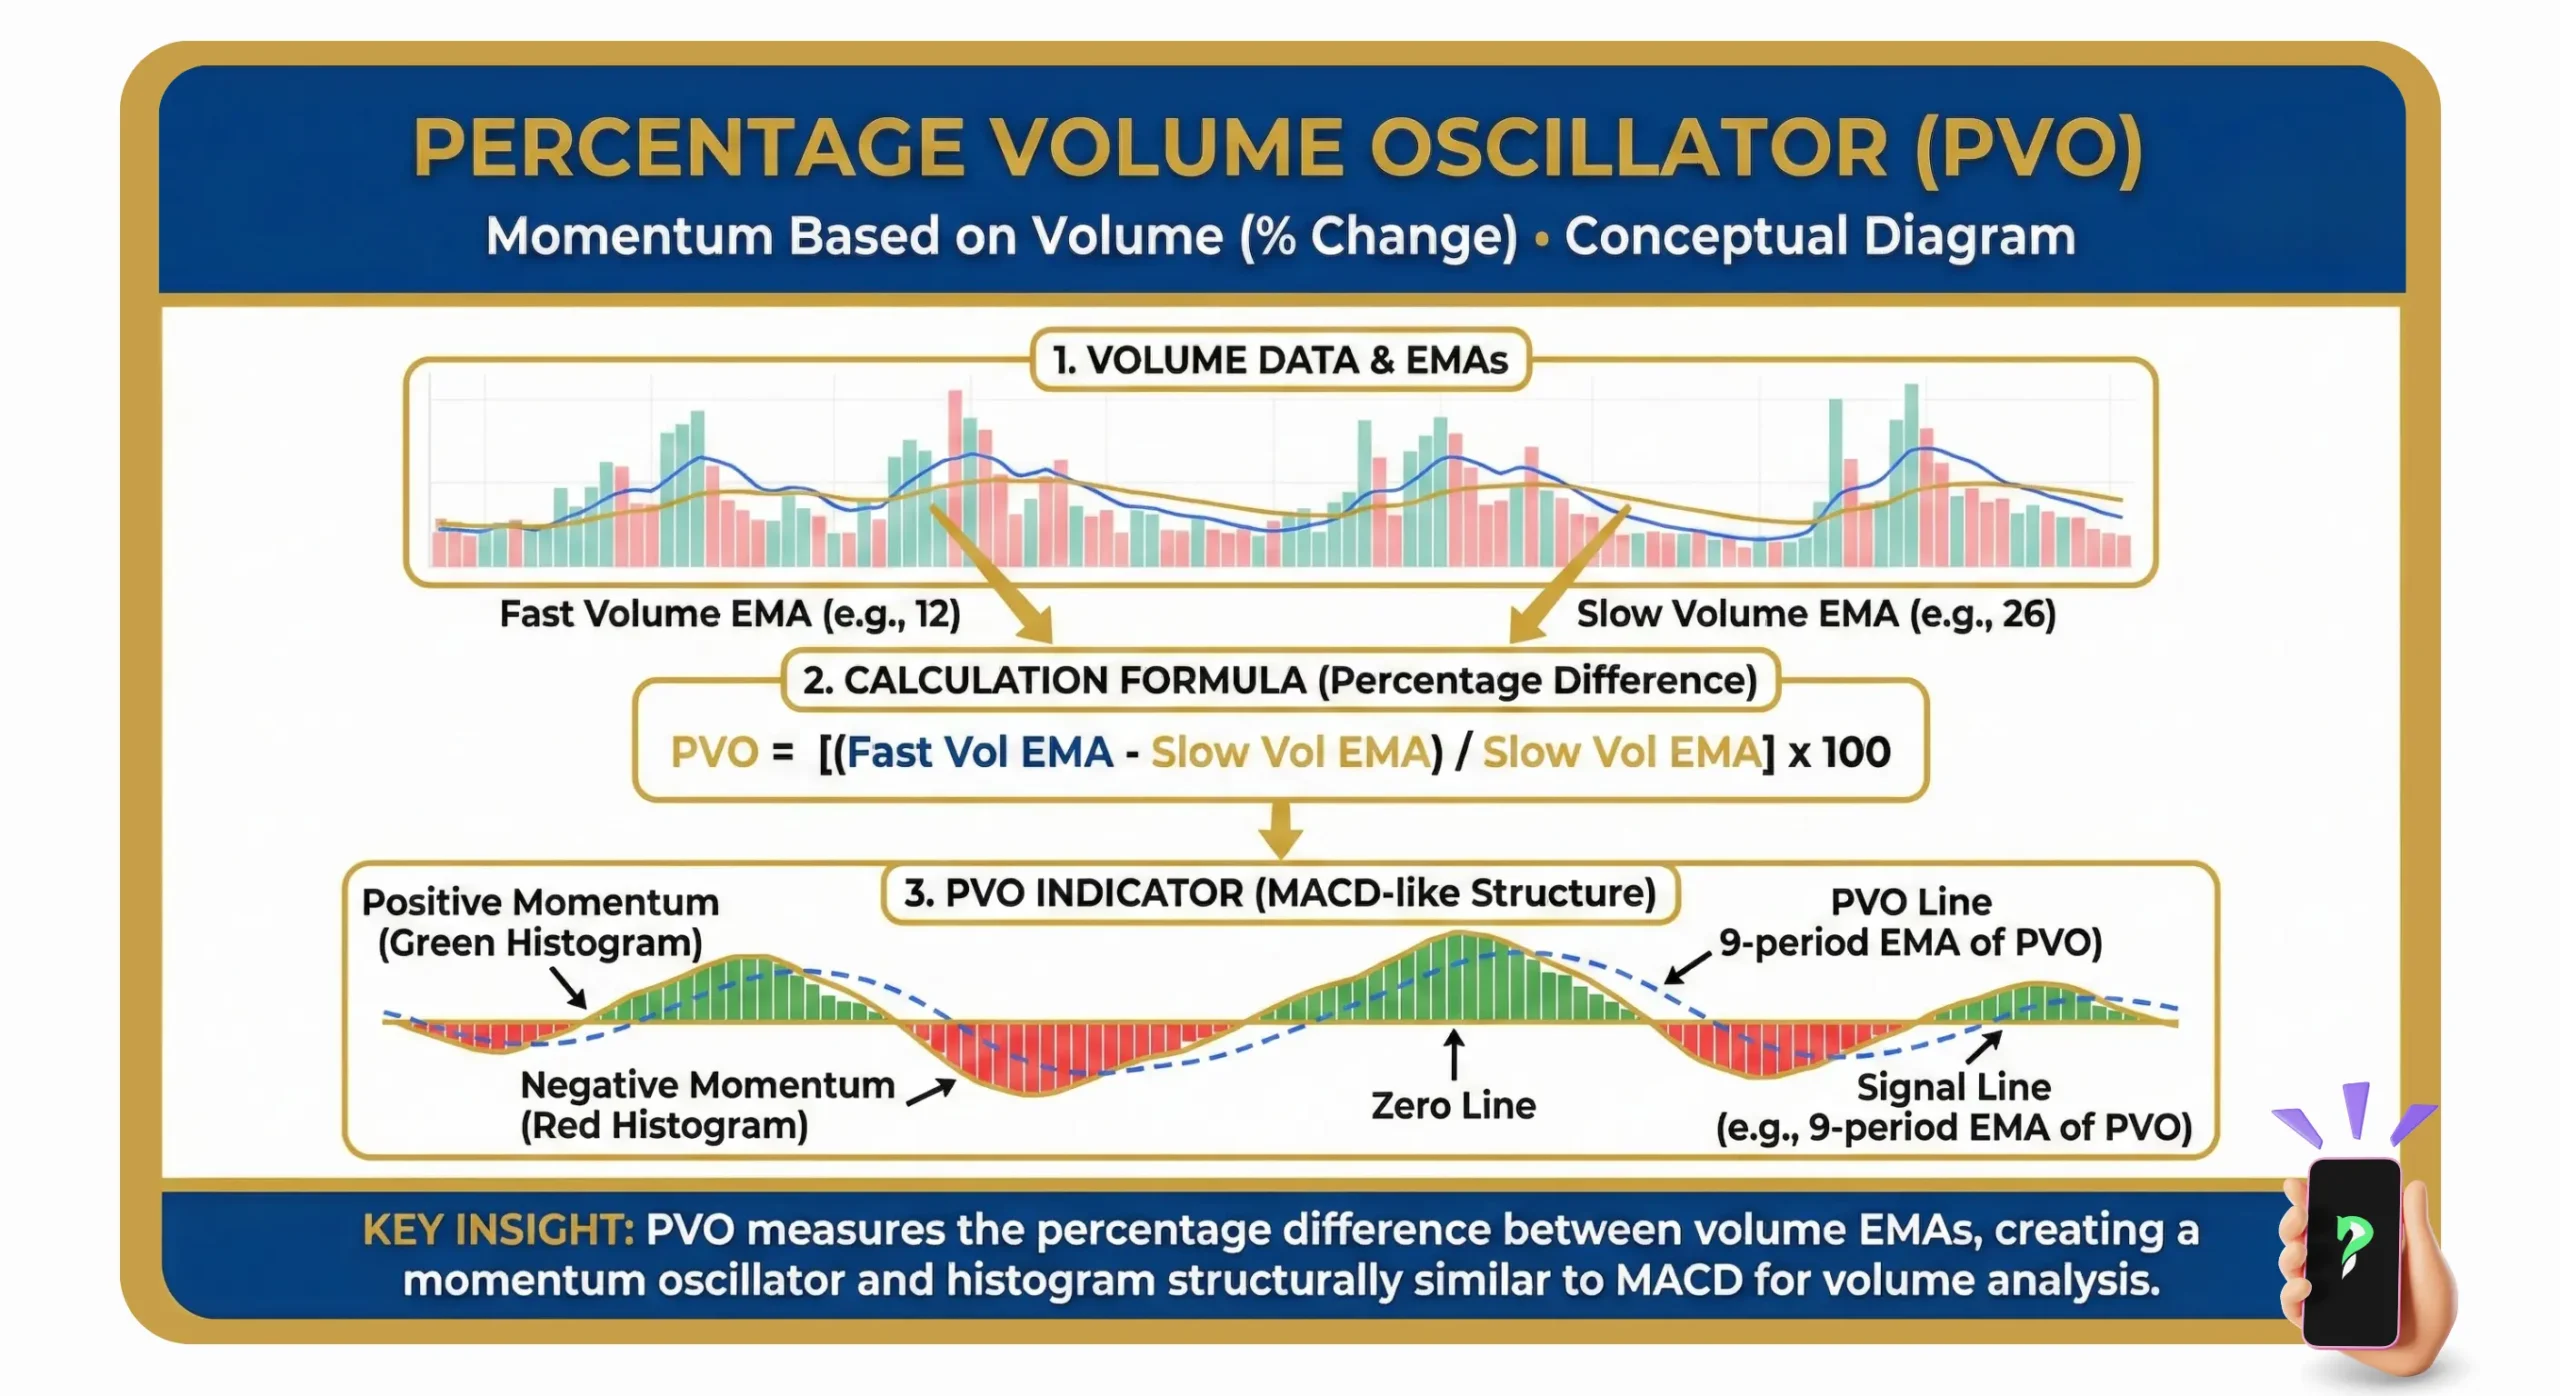
The Percentage Volume Oscillator (PVO) is a momentum oscillator that measures the percentage difference between two volume-based Exponential Moving Averages (EMAs).
Unlike standard volume bars that only show raw activity per session, the PVO calculates the difference between a fast volume EMA and a slow volume EMA, expressing the result as a percentage of the slower moving average. This helps traders visualize the rate of change in volume.
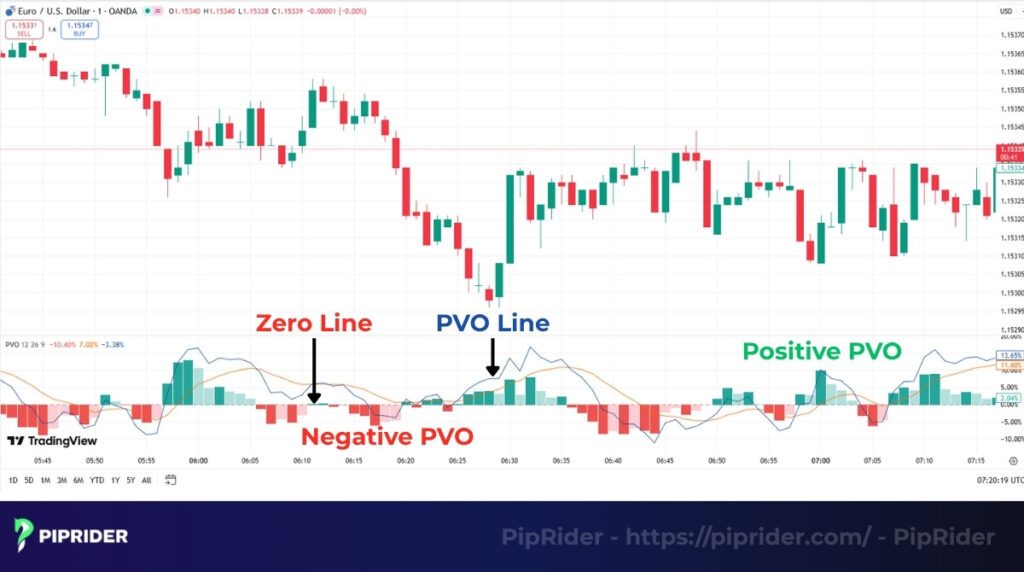
The indicator consists of three main components: the PVO Line, a Signal Line, and a Centerline (Zero Line).
Understanding the Zero Line
The position of the PVO relative to the zero line tells you about the state of market participation, not necessarily the price direction:
- PVO > 0 (Positive): The fast volume EMA is above the slow volume EMA. This indicates that current volume levels are above average (Rising activity).
- PVO < 0 (Negative): The fast volume EMA is below the slow volume EMA. This indicates that current volume levels are below average (Fading activity).
The Analogy: Structurally, the PVO is the exact volume equivalent of the Percentage Price Oscillator (PPO). While the PPO analyzes price momentum, the PVO analyzes volume momentum.
2. How to Calculate the Percentage Volume Oscillator
The PVO calculation follows the exact same logic as the MACD and PPO, but it applies to volume data instead of price. By normalizing the difference as a percentage, it allows traders to compare volume momentum across different timeframes effectively.
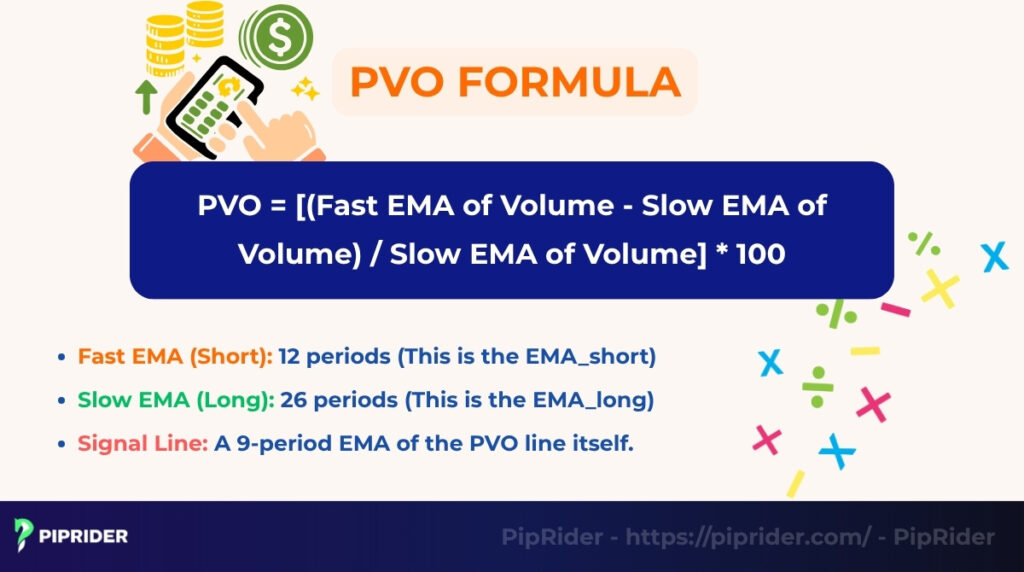
2.1. The PVO Formula
The main PVO line is calculated by comparing a short-term Volume EMA with a long-term Volume EMA. The formula expresses the difference as a percentage of the slower moving average:
Where:
- Fast Volume EMA: Typically the 12-period EMA.
- Slow Volume EMA: Typically the 26-period EMA.
2.2. The Histogram Formula
Just like the MACD, the PVO often includes a histogram to visualize the momentum of the oscillator itself. This helps traders see when the volume momentum is expanding or contracting.
- Signal Line: A 9-period EMA of the PVO line.
- PVO Histogram: This represents the gap between the PVO line and its Signal line.
2.3. Standard Settings
The default settings are identical to the standard MACD found on most trading platforms:
- Fast EMA: 12 periods
- Slow EMA: 26 periods
- Signal Line: 9 periods
2.4. Calculation Example (Forex vs. Stocks)
To interpret the result correctly, you must understand the data source being used:
- For Stocks: The indicator uses “Share Volume” (actual number of shares traded).
- For Forex/Crypto: Since these are decentralized markets, the indicator uses “Tick Volume” (the number of price changes) as a highly accurate proxy for market activity.
Example Calculation: Let’s assume the 12-period EMA of Volume is 15,000 ticks and the 26-period EMA is 12,000 ticks.
PVO = ((15,000 – 12,000) / 12,000) x 100 = +25%
Result Interpretation: A value of +25% means that short-term market activity is running 25% higher than the long-term average. This confirms strong participation in the current move.
3. How to Interpret PVO Signals
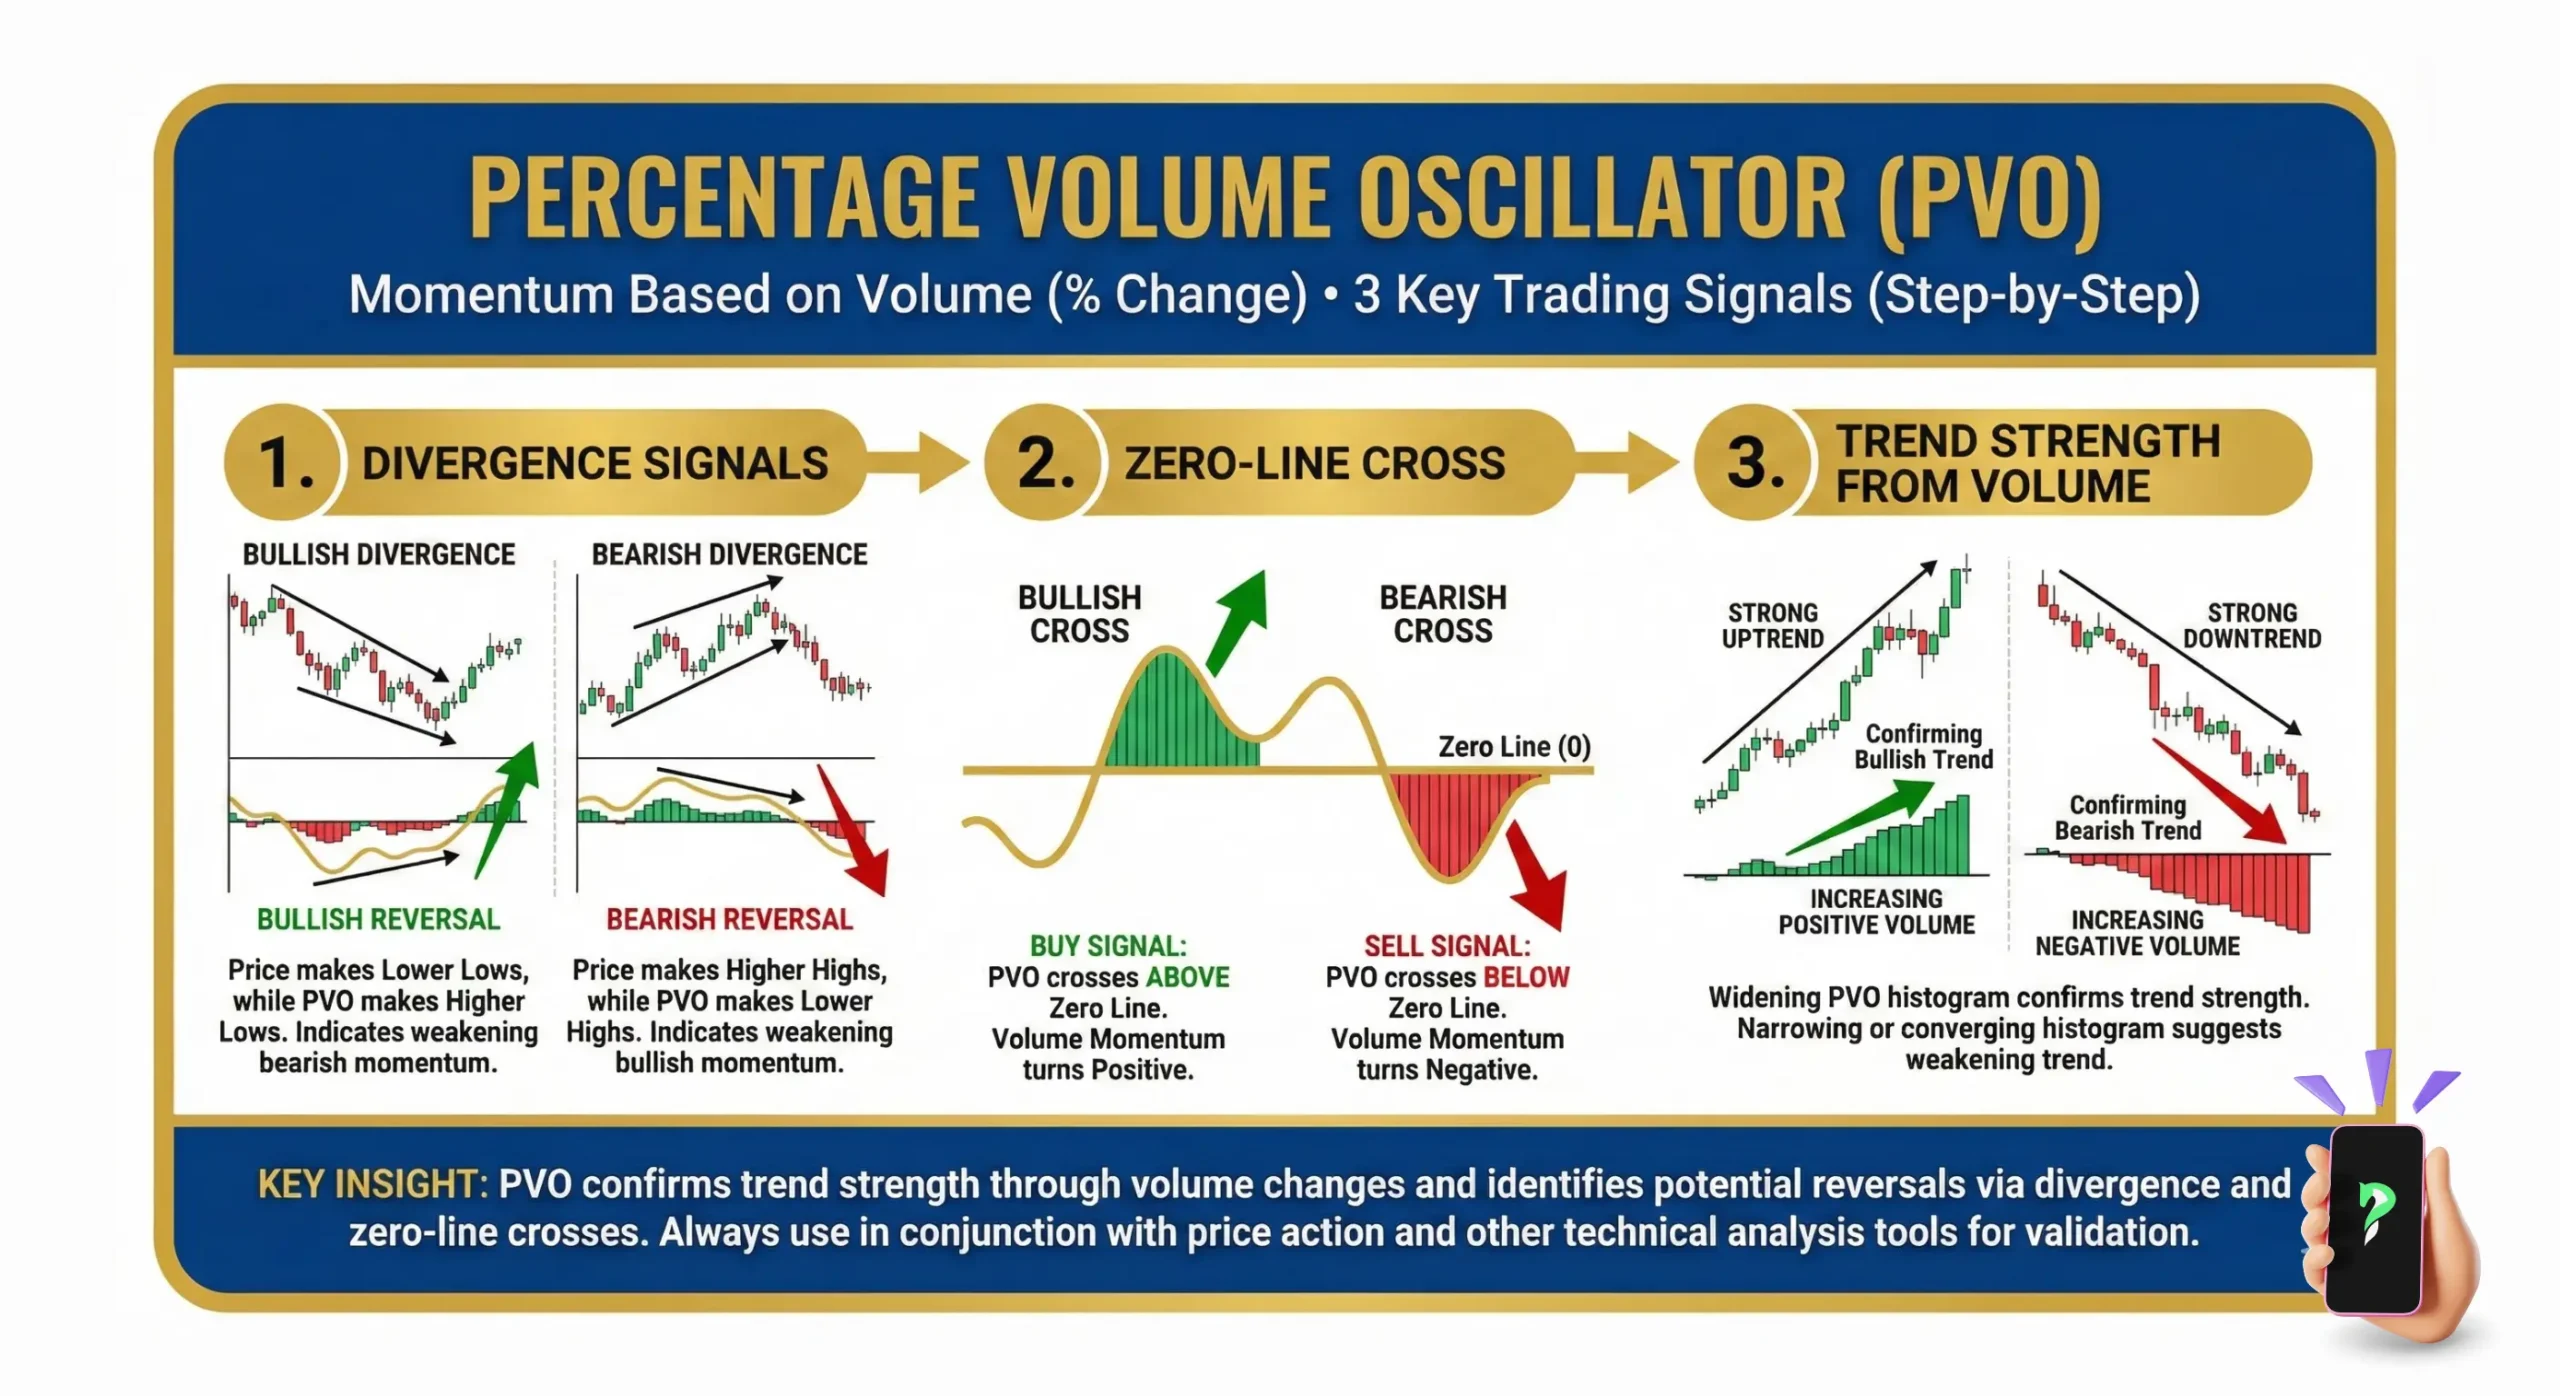
Traders can interpret the Percentage Volume Oscillator in four primary ways. These signals range from basic trend confirmation to advanced momentum warnings.
3.1. Zero Line Crossovers (Volume State)
The Zero Line acts as the specific boundary between high and low market participation. It determines the overall state of the market’s interest.
- Positive PVO (> 0): Indicates that short-term volume is above the long-term average. Important: This confirms the intensity of the move, not the direction. For example, during a panic sell-off, the PVO will be highly positive because selling pressure is extreme.
- Negative PVO (< 0): Indicates that short-term volume is below the long-term average. This signals low interest or a lack of conviction in the price move.
3.2. Signal Line Crossovers (Momentum Shifts)
Crossovers between the PVO line and its Signal Line (9-period EMA) indicate immediate shifts in the speed of volume activity.
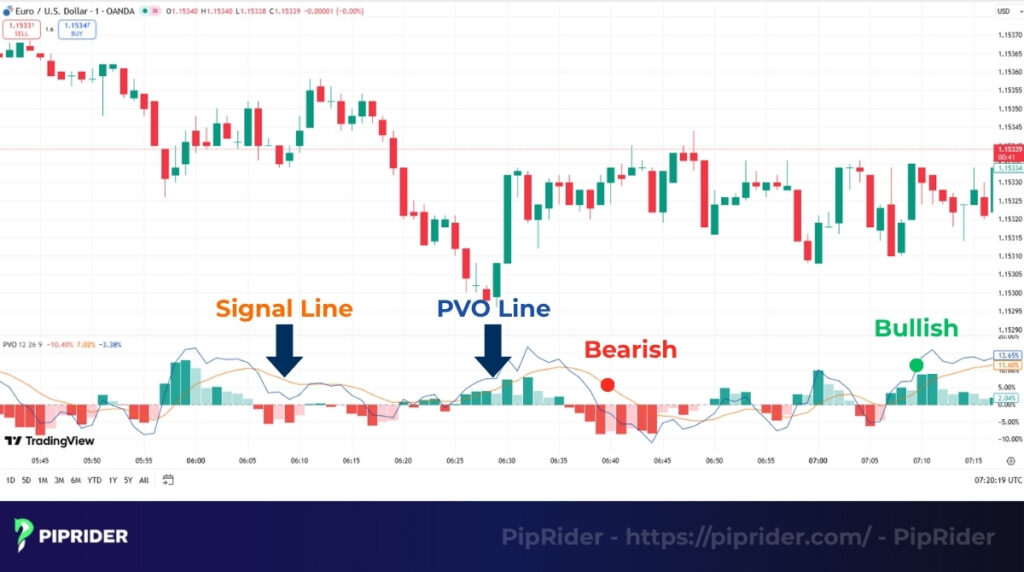
- Bullish Volume Crossover: Occurs when the PVO line crosses above the Signal Line. This implies volume is accelerating, often seen at the start of a valid breakout.
- Bearish Volume Crossover: Occurs when the PVO line crosses below the Signal Line. This implies volume is decelerating and the “fuel” for the trend is running low.
- ⚠️ Caution: In sideways markets, these lines may cross frequently (whipsaws). Traders should look for crossovers that accompany key price breakouts, not random fluctuations.
3.3. The Histogram (Visualizing Momentum)
The Histogram visualizes the gap between the PVO and its Signal Line, allowing traders to spot momentum changes at a glance without analyzing the lines.
- Expanding Histogram: The bars grow taller, meaning the gap is widening. This confirms that volume momentum is strengthening.
- Contracting Histogram: The bars shrink, meaning the gap is narrowing. This warns that the surge in volume is losing steam, even if the PVO is still rising.
3.4. Divergence: The “Yellow Flag” Warning
Unlike momentum indicators (like RSI) where divergence is a primary reversal signal, PVO divergence is strictly a secondary warning.
- The Setup: Price makes a Higher High, but the PVO makes a Lower High.
- The Logic: This indicates that while prices are still rising, the “fuel” (volume) behind the move is drying up. The trend is drifting up on inertia rather than aggressive buying.
- Actionable Advice: Do not short the market based solely on PVO divergence. Instead, treat it as a “Yellow Flag”:
- If you are holding a position: Tighten your Stop Loss.
- If you are looking to enter: Wait, as the momentum is fading.
3.5. Analyzing PVO Extremes (Buying/Selling Climaxes)
Since the PVO is an unbounded indicator (it has no fixed 0 to 100 levels like the RSI), you cannot rely on static numbers to find “Overbought” or “Oversold” zones. Interpretation must be relative.
- The Rule of History: To judge if volume is “extreme,” compare the current PVO value to its historical peaks over the last 6–12 months.
- The Climax Signal:
- If PVO spikes to a level not seen in months (e.g., +40%), it often indicates a Climax (Panic Selling or Euphoric Buying).
- Price often reverses sharply after these extreme volume spikes because there is no one left to trade.
For a broader view of market participation, some traders combine PVO readings with the advance decline line breadth indicator. This pairing helps confirm whether volume surges reflect genuine market-wide conviction or isolated moves.
4. Strategy: Validating Breakouts with PVO
This is the most powerful application of the PVO. Breakouts often fail because they lack genuine market interest. By using the PVO, traders can filter out “traps” and focus only on moves backed by strong participation.
4.1. The Logic: Conviction vs. Illusion
Price tells you where the market is going, but PVO tells you how strong the push is.
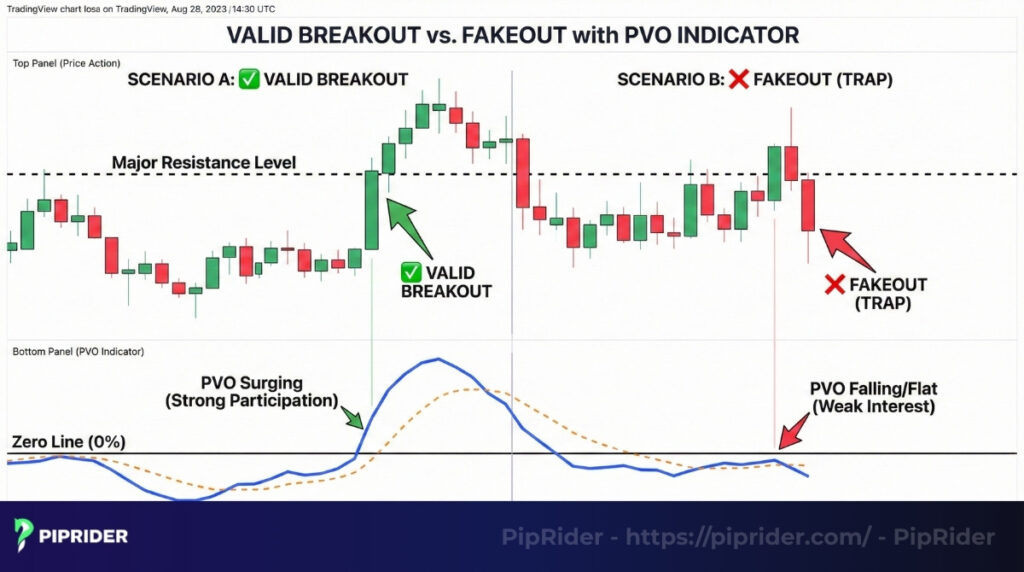
- The Valid Breakout (Price ↑ + PVO ↑): When price breaks a resistance level and the PVO is rising sharply (or crosses above zero), it confirms that new money is entering the market to support the higher prices.
- The Fake-out (Price ↑ + PVO ↓): If price breaks resistance but the PVO is falling or negative, it indicates “thin” trading. The breakout is likely a trap driven by a few market makers rather than genuine demand.
4.2. The “PVO Surge” Setup (Trading Rules)
To trade this strategy effectively, follow this strict checklist. This setup is designed to capture high-probability momentum moves while filtering out low-volume traps.
📋 Trading Rules: The PVO Breakout
1. The Setup (Context)
Identify a stock or pair consolidating near a key Resistance Level (e.g., a rectangle range, ascending triangle, or flag pattern).
2. The Trigger (Entry)
Wait for a candle to Close definitively above the resistance level. Do not enter on a wick.
3. The PVO Confirmation (Crucial)
At the moment of the breakout, the PVO line must be pointing up.
✅ Ideal: PVO crosses above the Zero Line or the Signal Line simultaneously.
4. Stop Loss Placement
Place the stop loss slightly below the breakout candle or the most recent swing low within the consolidation pattern.
If the price breaks out, but the PVO is flat or pointing down, cancel the trade immediately. This is a classic Divergence “Fake-out.”
4.3. Scenario Analysis: Valid Breakout vs. Fake-out
Let’s assume a stock has been stuck in a consolidation range between $50 and $55 for weeks.
1. The Event: Suddenly, breaking news hits the wire, and the price jumps to $56, closing above the resistance level.
2. The Validation: Before clicking “Buy,” you check the PVO indicator to confirm the strength of this move.
3. The Verdict:
- Scenario A (✅ Valid Breakout):
- Observation: The PVO spikes from 5% to 15% (Histogram expands green).
- Verdict: The volume supports the price increase. This confirms genuine demand. Action: Enter the trade.
- Scenario B (❌ Fake-out / Trap):
- Observation: The PVO drops from 10% to 8% (or stays flat near zero).
- Verdict: The price is rising on lower volume (drying up). This is likely a “stop-hunt” by market makers. Action: Stay away.
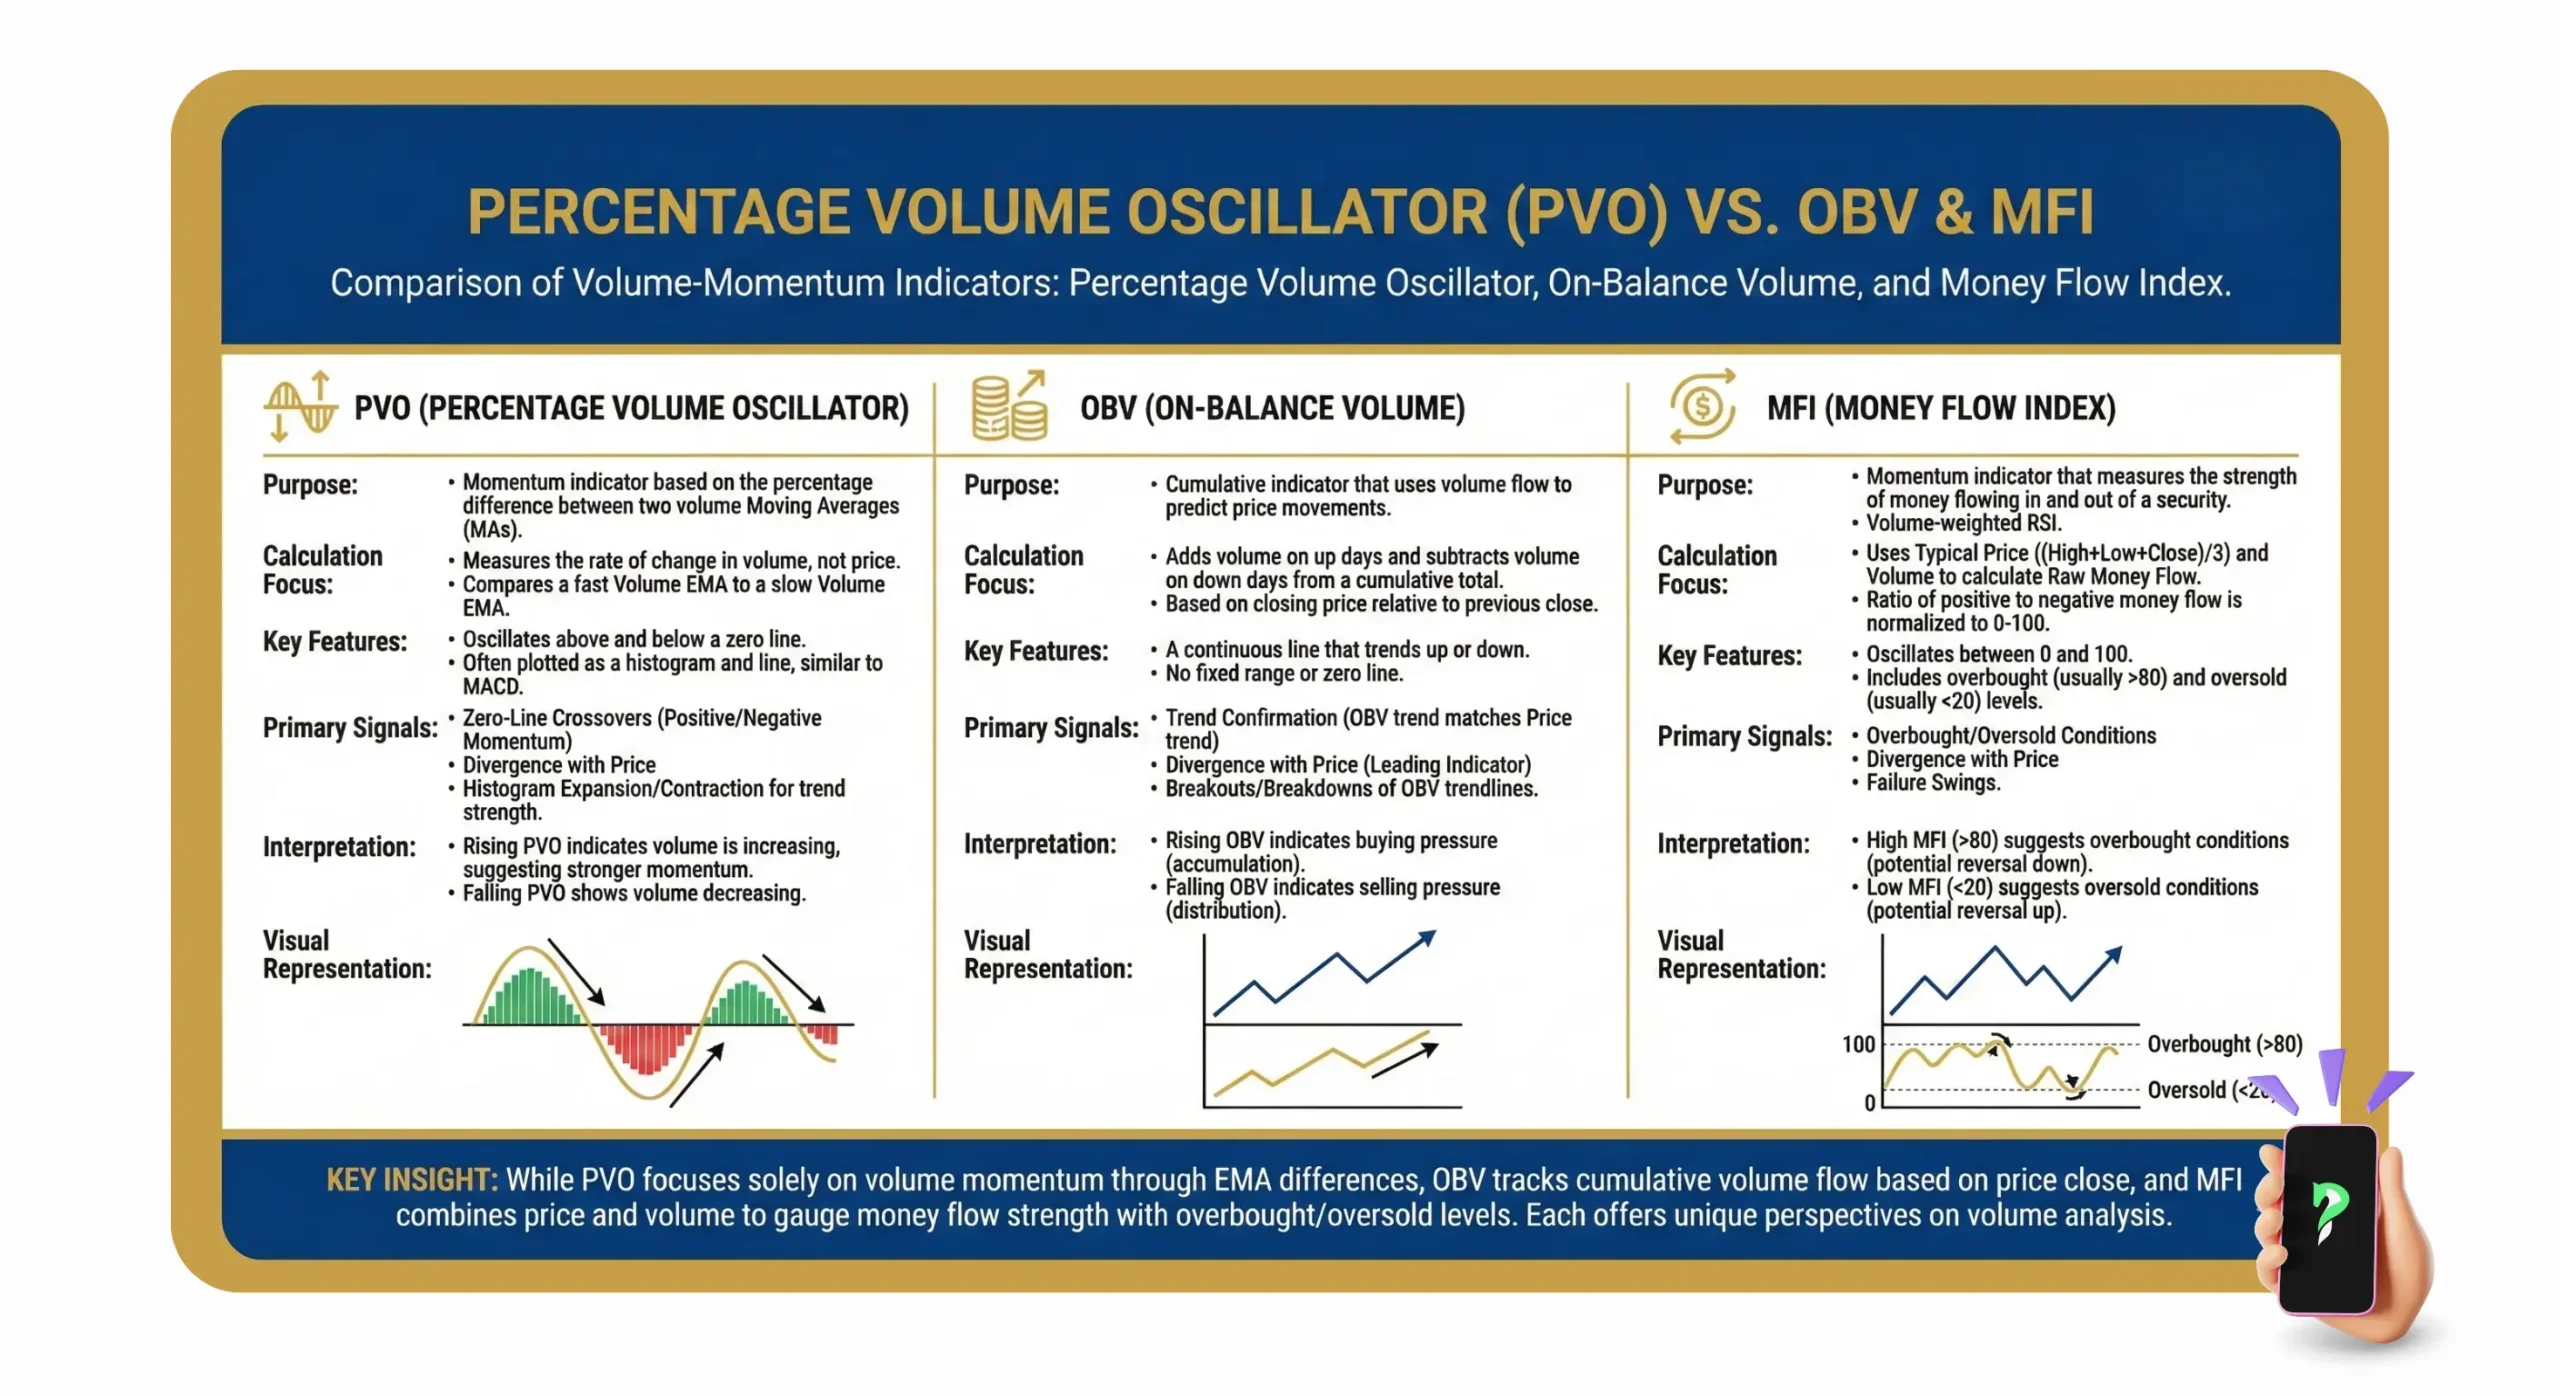
Many professionals use on-balance volume (OBV) as a confirmation tool alongside PVO. While PVO shows volume momentum rate, OBV tracks cumulative flow. Using both gives you a complete picture of buying or selling pressure.
5. How to Fine-Tune PVO Settings
While the default settings (12, 26, 9) work well for most market conditions, “one size” does not fit all. Depending on your trading style (Scalping vs. Swing) or the asset’s volatility, you may need to adjust the indicator’s sensitivity.
5.1. The Golden Rule: Sensitivity vs. Reliability
Before changing any numbers, you must accept the fundamental trade-off in technical analysis. There is no “perfect” setting, only the right setting for your goal:
The Trade-off: Making the indicator faster reduces lag but increases false signals (noise). Making it slower filters out noise but reacts late to price moves.
- High Sensitivity (Lower Settings): The PVO reacts instantly to volume spikes.
- Pro: Gets you into the trade early.
- Con: High risk of “whipsaws” (getting stopped out by fake moves).
- High Reliability (Higher Settings): The PVO smooths out the erratic volume data.
- Pro: Filters out random market noise effectively.
- Con: Delayed entry (you might miss the initial explosive move).
5.2. Recommended Settings by Style
Use the table below as a starting point to find the settings that match your timeframe:
| Trading Style | Fast EMA | Slow EMA | Signal | Characteristics |
|---|---|---|---|---|
| Scalping (M1 – M5) | 5 | 15 | 5 | Ultra-Sensitive. Catches quick volume spikes but produces many fake signals. Requires strict risk management. |
| Standard (Default) | 12 | 26 | 9 | Balanced. The best compromise between speed and reliability. Recommended for most beginners and H1-H4 charts. |
| Swing / Position (D1+) | 10 | 30 | 9 | Smoother. Reacts slower to volume changes, helping you stay in long-term trends without getting shaken out by minor fluctuations. |
5.3. The Trap of “Curve Fitting” (Must Read)
A common mistake new traders make is tweaking the settings until the indicator looks perfect on past data.
- The Problem: You might find a setting like (8, 21, 5) that signaled every top perfectly last month.
- The Reality: Markets change. A setting that was “perfect” for last month’s volatility might fail miserably today.
- Expert Advice: Stick to the Standard (12, 26, 9) or Swing (10, 30, 9) settings for at least 50 trades before trying to invent your own. Consistency is more important than perfection.
6. Combining PVO With Other Indicators
Since the PVO only measures volume momentum, it cannot tell you the direction of the price. To build a reliable trading system, you must pair it with a price-based indicator. The most effective technical strategy is to combine PVO with the MACD, as both indicators share the same mathematical structure but analyze different data sets.
6.1. The “Momentum Cousins”: PVO + MACD
This pairing functions as a “Truth Filter” for your trades. While the MACD identifies the direction of the price trend, the PVO confirms the conviction behind that trend.
The Strategy: Using PVO to Filter Fakeouts Many traders get trapped buying a MACD crossover that immediately reverses. PVO helps you validate the signal quality:
- Scenario A: The “High Probability” Setup (✅ Trade)
- Signal: MACD generates a Bullish Crossover (Line crosses up).
- PVO Check: The PVO is Positive (> 0) or rising sharply.
- Interpretation: Price is moving up, and volume is above average to support the push. This confirms the trend has “fuel.”
- Scenario B: The “Weak” Setup (❌ Avoid)
- Signal: MACD generates a Bullish Crossover.
- PVO Check: The PVO is Negative (< 0) or falling.
- Interpretation: The price is ticking up, but volume is drying up. Without volume support, this crossover is likely a false alarm or a temporary correction.
6.2. PVO + Moving Averages (Trend Confirmation)
Combining the PVO with a long-term Moving Average (such as the EMA 200) is the simplest way to ensure you are trading in alignment with the dominant market trend.
- The Rule: If Price is above the EMA 200 (Uptrend) AND PVO is Positive, every dip in price is a buying opportunity supported by institutional volume.
- The Warning: If Price is above the EMA 200 but PVO turns Negative, the uptrend is losing participation. Be careful with adding new long positions as the trend may be exhausting.
7. Setting Up PVO on Your Trading Platform
Since the PVO is a specialized tool, different platforms label it differently. Below is the step-by-step guide to adding it to the most popular charting software.
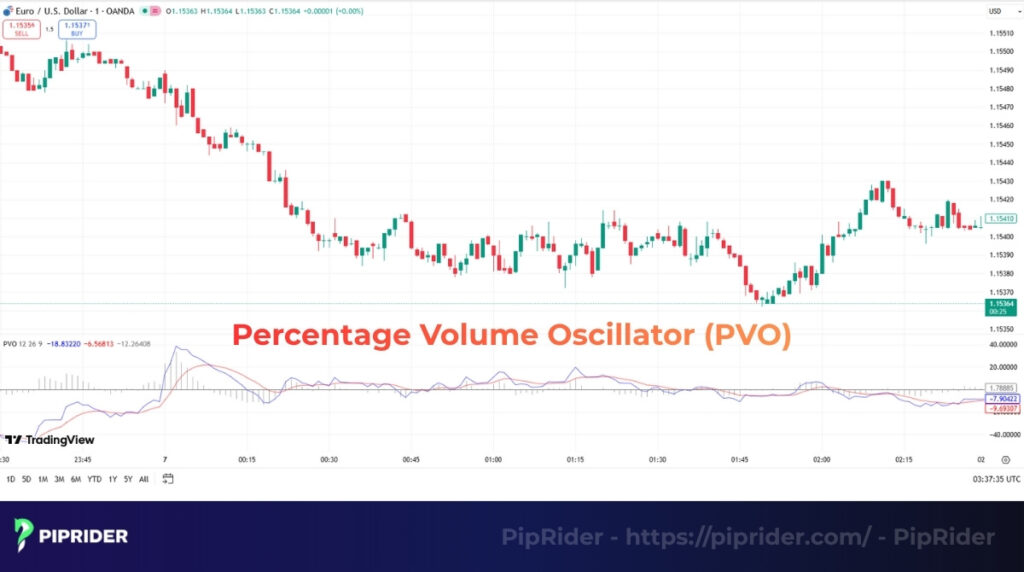
7.1. On TradingView
TradingView is the most user-friendly platform for this indicator, but it uses a slightly different name.
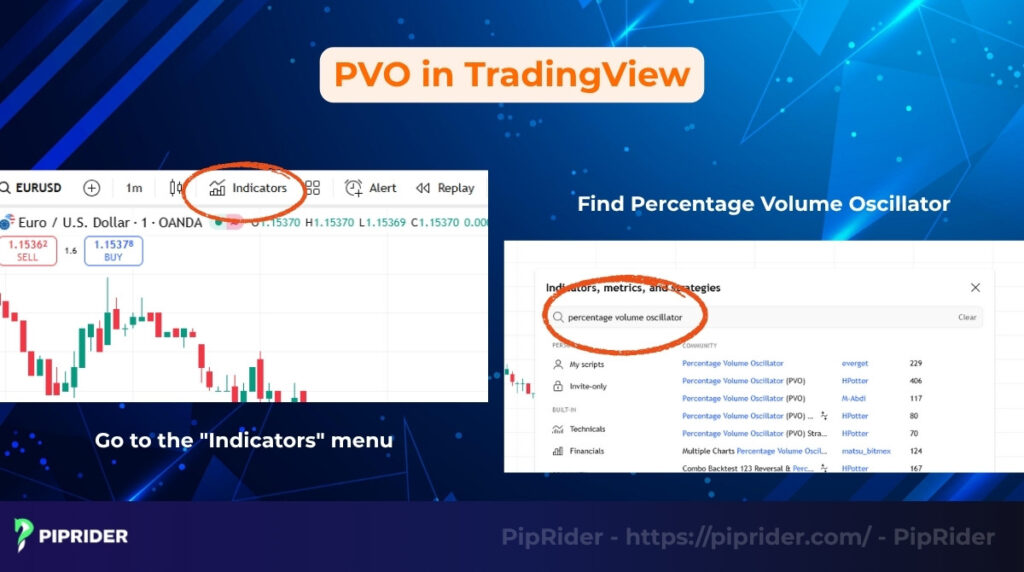
- Open Indicators: Click the “Indicators, Metrics & Strategies” button at the top.
- Search: Type “Volume Oscillator” in the search bar.
- Note: Use the built-in “Volume Oscillator”. It uses the standard PVO percentage formula by default.
- Verify Settings: Open the settings (gear icon) and ensure the inputs are Short Term (12) and Long Term (26).
7.2. On MetaTrader 4 (MT4) & MetaTrader 5 (MT5)
Important: The standard installation of MT4/MT5 does not include the PVO in the default “Oscillators” folder. You must add it as a custom indicator.
How to install it safely (No external downloads required):
Instead of downloading sketchy .ex4 files from forums, use the official Code Base tab inside your platform:
- Open Terminal: Press
Ctrl+Tto open the bottom Terminal window. - Go to Code Base: Click on the “Code Base” (MT4) or “Market” (MT5) tab.
- Search: Right-click anywhere in the list and select “Search”. Type “Percentage Volume Oscillator” or “PVO”.
- Download: Double-click on a highly-rated, free version (look for 4-5 stars). It will automatically appear in your Navigator panel under “Custom Indicators.”
7.3. Summary of Indicator Names
To avoid confusion, here is how the indicator is labeled across major platforms:
| Platform | Indicator Name | Important Notes |
|---|---|---|
| TradingView | Volume Oscillator | Built-in. It is percentage-based by default. |
| MT4 / MT5 | PVO / Percentage Volume Oscillator | Must download via Code Base tab. |
| Thinkorswim | VolumeOsc | Crucial: Go to settings and change diff type to “percent”. |
| StockCharts | PVO | Found in Indicators Dropdown. |
8. Advantages and Limitations of PVO
Like any technical indicator, the Percentage Volume Oscillator (PVO) has clear strengths and weaknesses. Understanding both is key to using it effectively.
8.1. Advantages (Pros)
The PVO offers several key strengths for technical traders.
- Validates Breakouts: PVO acts as a confirmation filter. It helps distinguish between a genuine price move backed by rising volume (high conviction) and a false breakout occurring on thin participation.
- Visual Clarity: Raw volume bars can be erratic and hard to read. The PVO smooths this data into a clear oscillator, making it easier to spot trends in market interest (expanding vs. drying up).
- Leading Signals: Volume momentum often shifts before price does. A rising PVO can alert you to increasing interest in a stock or pair before the price candle fully closes.
Traders exploring volume analysis often look at another volume-based oscillator to compare, like the Klinger. While PVO focuses purely on volume momentum, Klinger blends price and volume for a different perspective.
8.2. Limitations (Cons)
However, traders must also understand the indicator’s weaknesses.
- Whipsaws in Choppy Markets: Like all moving averages, the PVO lags. In a sideways market with low volatility, it may produce multiple false signals as volume fluctuates around the average.
- Unbounded Values: Unlike the RSI which is bound between 0 and 100, the PVO has no fixed upper or lower limit. You must rely on the asset’s historical context to determine what counts as “high” or “low.”
- Broker Dependency (Forex/Crypto): In decentralized markets, volume data varies from broker to broker. A signal on one chart might not perfectly match another, requiring traders to be consistent with their data source.
9. Frequently asked questions about Percentage Volume Oscillator (PVO)
10. The Bottom Line
The Percentage Volume Oscillator (PVO) is a valuable tool that helps traders measure the strength of volume, a critical confirmation factor for any technical strategy. By combining the PVO (and its histogram) with other price-based momentum indicators (like the MACD or RSI), a trader can significantly increase the reliability of their signals.
However, the PVO should never be used in isolation; always confirm its signals with price action (like trendlines or price channels) and the overall market context for the best results. To learn more and discover our complete technical indicators list, follow PipRider for in-depth trading guides.
Infographic Section
-
Percentage volume oscillator -
3 key trading signals -
Momentum Based on Volumne