
The pin bar is a core candlestick pattern in price action trading, visually representing a sudden price rejection. While highly recognizable, its effectiveness is strictly dependent on structural context. Understanding how to validate this signal against broader market conditions can help traders filter out market noise and refine their entry decisions. This guide will provide some of top trading tips to help you master this signal.
Key Takeaways
- A pin bar is a single candlestick with a small body and a long wick, visually representing a sudden rejection of a specific price level.
- Its validity is entirely dependent on context; a standalone pin bar means little unless it forms at established support/resistance zones, trendlines, or moving averages.
- It can be combined with other confirming factors like volume, RSI, moving averages, or Fibonacci levels, often signaling continuation of the prevailing move.
- The pin bar is a versatile pattern suitable for trading across various markets, including forex, stocks, and crypto.
1. What Is a Pin Bar Candlestick?
A Pin Bar is a single-candle pattern characterized by a very long wick (or “tail”) and a small body. The Pin Bar’s structure, often likened to Pinocchio’s nose, tells a “lie” about the market’s true intended direction.
- Its long wick signals a period of strong price rejection at an extreme level: buyers or sellers pushed the price far, but the opposing force seized control before the candle closed.
- The small body confirms this sudden shift in sentiment.
A Pin Bar is highly significant when it appears at key support or resistance levels, indicating a potential market reversal or continuation as the prevailing price move failed.
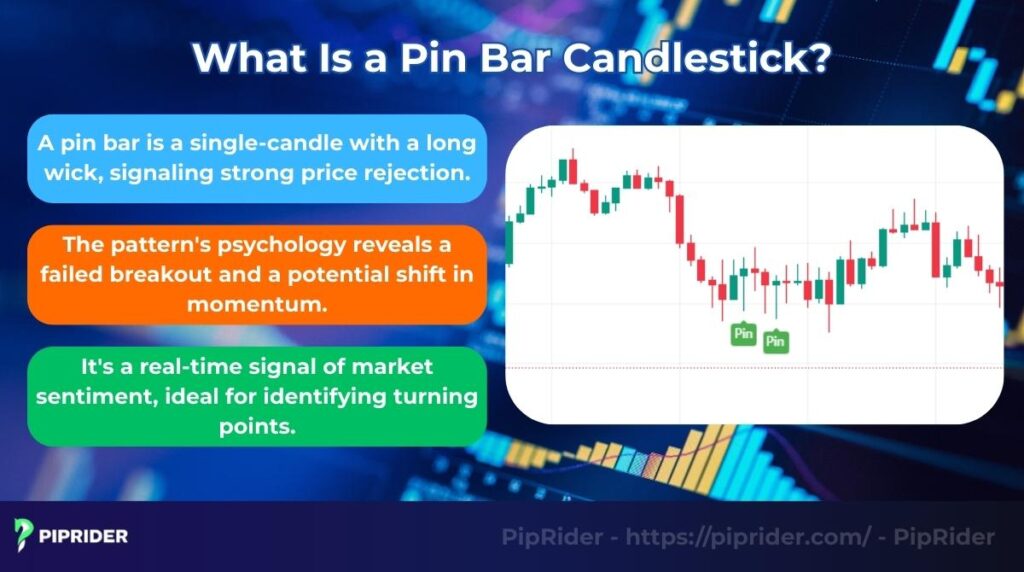
The psychology behind a pin bar is one of strong price rejection. The long tail shows that the price attempted to move decisively in one direction, but the opposing force (either buyers or sellers) stepped in and pushed the price all the way back before the candle closed. It is a powerful visual sign of a failed breakout attempt and a potential shift in momentum.
In price action trading, the pin bar candle is highly valued for providing a rapid cue regarding market sentiment. While not a strictly ‘real-time’ signal, as traders must wait for the candle to close for confirmation, this formation reflects the immediate battle between buyers and sellers much faster than traditional lagging indicators. Such responsiveness makes the pin bar one of the most respected single-candle signals for identifying potential turning points.
2. Structure and Characteristics of the Pin Bar
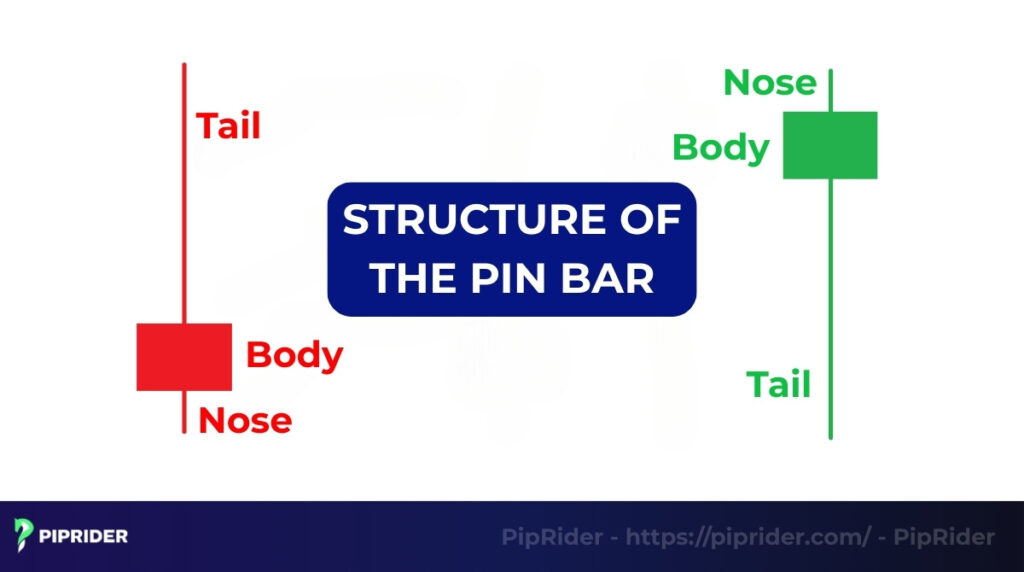
The Pin Bar is defined by three specific components: the long tail, the small real body, and the short opposite wick. To identify a valid signal, a trader must understand the minimum size requirements and the precise relationship between these parts, which collectively signal the decisive failure of the price to sustain movement in one direction.
2.1. The Long Tail (Wick/Shadow)
The long tail is the most important part of a pin bar, representing a strong price rejection. For a valid signal, the tail or shadow should be at least two-thirds (2/3) of the candle’s total length. It visually shows that one side of the market attempted a strong push but was aggressively overpowered before the candle closed.
2.2. The Small Body
Unlike the full-range dominance of a marubozu candlestick pattern, the real body of a pin bar should be small, ideally making up one-third (1/3) or less of the candle’s total length. Its small size, located at one end of the long wick, shows that the closing price ended very near the opening price, confirming the failure of the initial price push.
2.3. The Nose, Eye, and Tail Concept
Price action traders often use simple terms to describe these parts for quick validation:
- The Tail: The long wick showing the price rejection.
- The Eye: The small real body, which should ideally be contained within the range of the prior candle.
- The Nose: The short, opposite wick, which should be as small as possible to confirm a one-sided rejection.
3. Types of Pin Bars in Trading
While all pin bars signal price rejection, they are categorized by the direction of that rejection and the potential price move they signal. Understanding these types is key to accurately applying them in a live trading environment.
Context is King: Reversal vs. Continuation
As highlighted by professional price action traders, a pin bar is simply a “rejection” signal; its effectiveness and meaning depend entirely on where it forms on the chart:
- Reversal Pin Bar: Appears at major Support/Resistance zones or structural extremes (e.g., a failed breakout), signaling a potential major trend change.
- Continuation Pin Bar: Forms during a pullback within a strong, established trend. It signals that the brief counter-trend move has been rejected and the dominant trend is safely resuming.
| Pin Bar Type | Signal | Key Structure / Context |
|---|---|---|
| Bullish Pin Bar | Bullish Reversal | Long lower wick; Small body at the top. Forms at Support. |
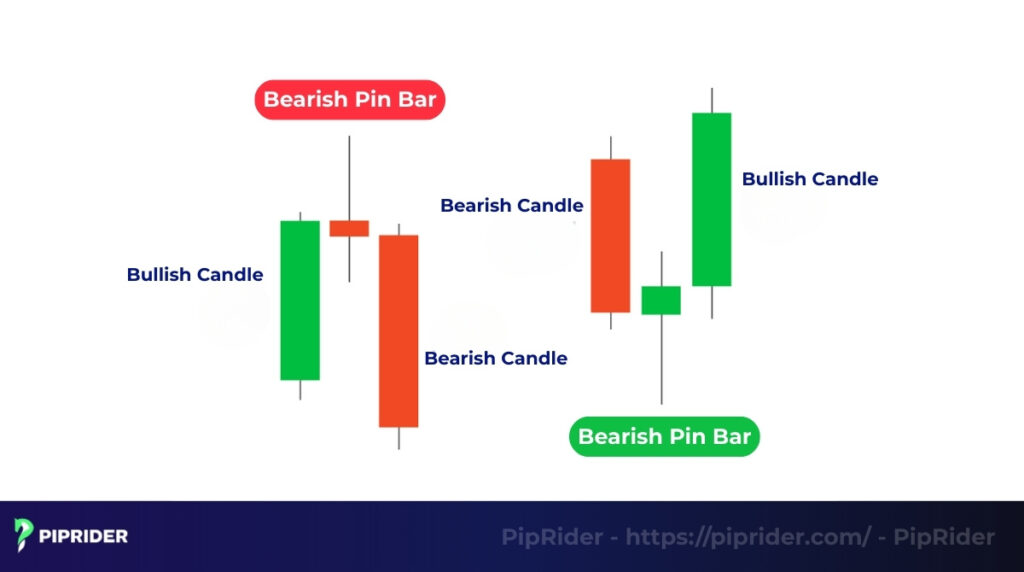
| Bearish Pin Bar | Bearish Reversal | Long upper wick; Small body at the bottom. Forms at Resistance. |
| False Pin Bar | False Signal / Trap | Looks valid but forms against the strong trend. Fails to follow through. |
| Inside Pin Bar | High-Conviction Reversal | Pin Bar range is contained within the preceding Mother Bar. |
3.1. The Bullish Pin Bar
The Bullish Pin Bar is a powerful bullish reversal signal. It shows that sellers tried to push the market price down, but buyers gained control and pushed it back up.
- Appearance: A candle with a small body at the top and a long lower tail.
- Ideal location: Appears at the bottom of a downtrend or at key support levels.
- Psychology: The long lower tail represents a strong rejection of lower prices.
3.2. The Bearish Pin Bar
The Bearish Pin Bar is a strong downward reversal signal. It shows that buyers tried to push the price up, but sellers fought back and forced the price down.
- Appearance: A candle with a small body at the bottom and a long upper tail.
- Ideal Location: Appears at the top of an uptrend or at key resistance levels.
- Psychology: The long upper tail represents a strong rejection of higher prices.
3.3. The False Pin Bar (Low-Probability Setup)
A false pin bar is a market trap. It visually meets the anatomical criteria of a pin bar (long wick, small body) but forms in the wrong structural context, causing the signal to fail and trapping eager traders.
- Cause: This frequently occurs when a pin bar forms directly against a very strong, aggressive momentum trend without any major support or resistance level backing it up.
- How to avoid the trap: Context must always precede the candlestick pattern. A standalone pin bar fighting a dominant trend is a low-probability setup. To avoid this trap, only trade pin bars that align with the broader market structure or wait for the next candle to provide definitive confirmation.
3.4. The Inside Pin Bar
The Inside Pin Bar combines the indecision of an “inside bar” with the strong rejection of a pin bar.
- Structure: A two-candle pattern. The first is a larger “mother bar,” and the second is a pin bar whose entire range is contained within the high and low of the preceding inside bar.
- Psychology: It represents a period of quiet consolidation followed by a failed breakout and strong rejection. This combination signals a very high probability of a move opposite to the pin bar’s long tail.
4. How to Identify and Confirm a Pin Bar
Not all long-wicked candles are valid pin bars. Professional traders use a checklist of specific criteria to confirm the quality of a signal before risking capital. A high-probability pin bar should meet the following conditions:
- Valid anatomy: The candle must have a long wick (or tail) that is at least two-thirds (2/3) of its total length, with a small body located at one end.
- Key location: It must form at a significant level on the chart, such as a key price level, a trendline, or a major moving average. A pin bar in the middle of “nowhere” is an unreliable signal.
- Volume confirmation: A valid pin bar is often accompanied by a spike in trading volume, confirming a decisive rejection. (Note for Forex Traders: In spot FX, volume is typically “tick volume”—a proxy based on price updates rather than centralized traded volume. Treat it as a gauge of activity rather than definitive proof).
5. Pin Bar Trading Strategies
While a pin bar provides a clear reversal signal, the entry options can be adapted based on a trader’s risk tolerance and overall strategy. This section covers several strategies, from the simplest breakout method to more advanced combinations.
5.1. Entry Options (Conservative vs. Aggressive)
While a pin bar provides a clear reversal signal, traders can adapt their entry method based on their risk tolerance and market conditions. There are three primary ways to enter a pin bar trade:
- The Breakout Entry (Standard): Placing a stop order (buy-stop or sell-stop) just beyond the high or low of the pin bar (the side opposite the long tail). This confirms that price momentum is moving in your intended direction before triggering the trade, though it offers a standard Risk/Reward (R:R) ratio.
- The 50% Retrace Entry (Conservative): Placing a limit order at the halfway point (50% level) of the pin bar’s long tail. This method provides a vastly superior R:R ratio and allows for a tighter stop-loss. However, you risk missing the trade entirely if the price simply shoots off without pulling back.
- The Close Entry (Aggressive): Entering at the market price the exact moment the pin bar closes. This guarantees you are in the trade but requires a wider stop-loss. It should only be used when the pattern forms at an exceptionally strong, undeniable support/resistance zone.
5.2. Take Profit and Exit Rules
Instead of arbitrarily aiming for the next resistance or support, professional traders use strict, rule-based exit strategies to lock in gains and protect capital:
- Scale-Out (Partial TP): Take profit on half of your position when the trade reaches a 1:1 Risk/Reward ratio (TP1). Let the remaining half run risk-free toward the next major structural level (TP2).
- Trailing Stop: As the trade moves in your favor, trail your stop-loss behind newly formed swing highs (for short trades) or swing lows (for long trades) to maximize the capture of a new trend.
- Invalidation Exit (Early Cut): If the subsequent price action reverses and decisively closes past the 50% mark of the pin bar’s long tail in the wrong direction, manually exit the trade early. The setup is likely invalidated, and waiting for the hard stop-loss to hit is unnecessary.
5.3. Rules for Long Entry (Bullish Pin Bar)
A bullish pin bar signals a strong rejection of lower prices and a potential shift to the upside. For a high-confidence long (buy) setup, a trader should follow these specific rules:
- Confirm Setup: The pattern must form at a key area of confluence, such as a horizontal support level, a rising trendline, or a dynamic level like a major moving average.
- Entry: A common and conservative entry method is to place a buy-stop order just above the high of the pin bar, waiting for confirmation that buyers are pushing the price higher.
- Stop-Loss: The stop-loss order must be placed a few pips below the low of the pin bar’s long tail. This is the logical point of invalidation; if the price breaks this level, the upward signal has failed.
- Take-Profit: The take-profit target should be set at the next logical resistance level or a significant prior swing high, providing a favorable risk-to-reward scenario.
Case Study: Bullish Pin Bar on the S&P 500 (US500)
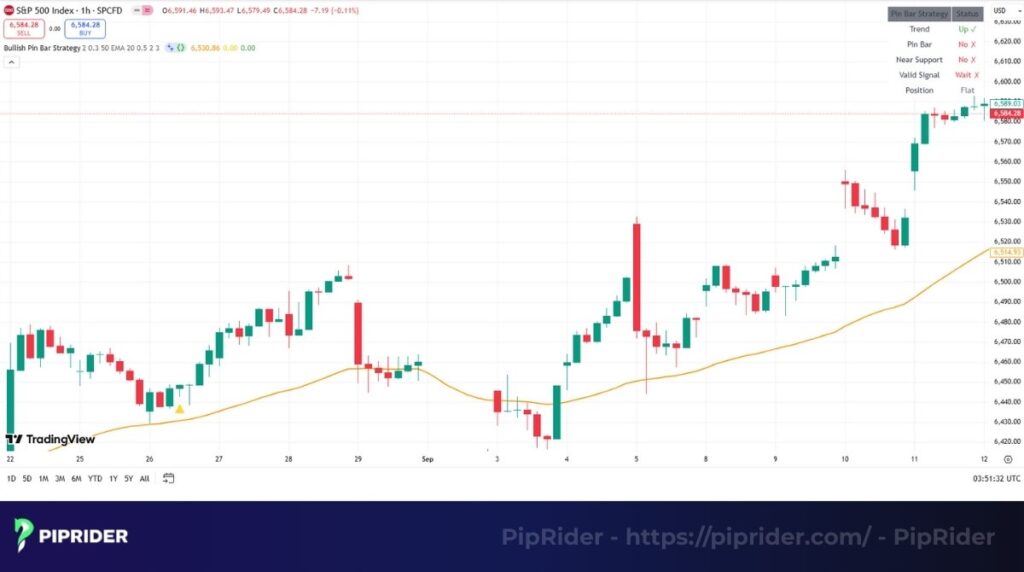
Let’s look at a practical example on the daily chart of the S&P 500 (US500).
The Setup: The index was in an overall uptrend but had pulled back to a key horizontal support level around 4,400. At this level, a clear bullish pin bar formed, showing a strong rejection of lower prices.
| Execution Parameter | Price Level | Rationale |
|---|---|---|
| Entry (Buy-Stop) | 4,415 | Just above the high of the pin bar. |
| Stop Loss (SL) | 4,385 | Just below the long tail (30 point risk). |
| Take Profit (TP) | 4,475 | Next key resistance level (60 point reward). |
| Outcome | Successful Gain | The price moved up, triggered the entry, and successfully hit the take-profit target. |
5.4. Rules for Short Entry (Bearish Pin Bar)
A bearish pin bar signals a strong rejection of higher prices and a potential downward reversal. For a high-confidence short (sell) setup, a trader should follow these specific rules:
- Confirm Setup: The pattern must form at a key area of alignment, such as a horizontal resistance level, a falling trendline, or a dynamic level like a major moving average.
- Entry: A common and conservative entry method is to place a sell-stop order just below the low of the pin bar, waiting for confirmation that sellers are pushing the price lower.
- Stop-Loss: The stop-loss order must be placed a few pips above the high of the pin bar’s long tail. This is the logical point of invalidation; if the price breaks this level, the downward signal has failed.
- Take-Profit: The take-profit target should be set at the next logical support level or a significant prior swing low. This provides a clear exit plan.
Case Study: Bearish Pin Bar on GBP/USD
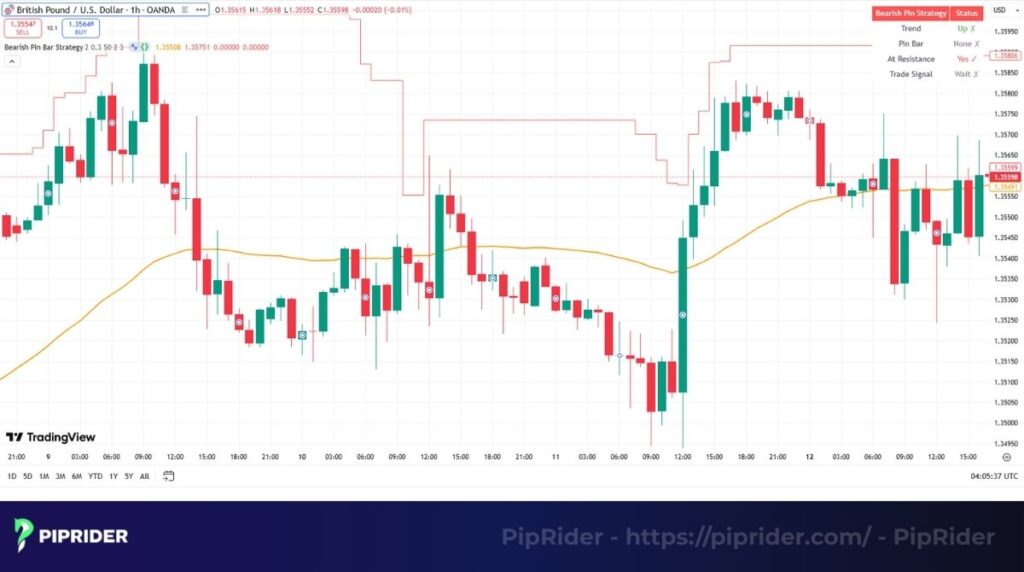
Let’s look at a practical example on the chart of the GBP/USD.
The Setup: The currency pair was in an overall downtrend but had rallied up to a key horizontal resistance level around 1.2750. At this level, a clear downward pin bar formed, showing a strong rejection of higher prices.
| Execution Parameter | Price Level | Rationale |
|---|---|---|
| Entry (Sell-Stop) | 1.2730 | Just below the low of the pin bar. |
| Stop Loss (SL) | 1.2780 | Just above the long tail (50 pip risk). |
| Take Profit (TP) | 1.2630 | Next key support level (100 pip reward). |
| Outcome | Successful Gain | The price dropped, triggered the entry, and successfully hit the take-profit target. |
5.5. Combining the Pin Bar with Other Indicators
A standalone pin bar is merely a hint; its validity depends on confluence—the intersection of multiple technical tools confirming the exact same rejection zone. Here’s how to layer indicators for objective confirmation:
- With RSI: When a bullish pin bar forms at a key support level and the RSI is simultaneously in “oversold” territory (below 30), it provides strong confirmation that selling momentum is exhausted.
- With Moving Averages (MA): Moving averages act as dynamic supply and demand zones. A bearish pin bar forming and rejecting a key MA (like the 50 EMA) in a downtrend is a very high-probability signal that the trend is likely to continue lower.
- With Fibonacci: Fibonacci retracement levels are excellent for identifying potential reversal zones. A pin bar forming precisely at a key Fibonacci level (e.g., the 61.8% retrace) indicates that both price action and mathematical ratios are signaling a potential turn.
- With Volume: A sudden volume spike adds significant weight to the signal, confirming strong market participation. As noted earlier, forex traders must treat tick volume as purely supportive. Use it to confirm an active market, but never rely on it as a standalone confirmation without structural price alignment.
6. Improving the Efficiency of Pin Bar Trading
A standalone pin bar is just a shape on a chart. Its true edge comes from structural validation. To filter out low-quality signals, apply these three strict criteria:
- Trade at Established Zones: Limit your trades to pin bars that form precisely at proven supply and demand zones or major structural boundaries. A pin bar floating in a random, untested price area should be ignored.
- Require Technical Confluence: A setup is structurally validated when multiple factors intersect at the exact point of the pin bar’s wick. For instance, a price rejection that simultaneously bounces off a horizontal support, a 50-period moving average, and a 61.8% Fibonacci level carries significantly more weight than a single factor alone.
- Use Multi-Timeframe Alignment: Before executing a trade based on a 4-hour chart, consult the daily timeframe. If the macro trend aligns with your intended trade direction, the setup’s structural integrity increases. Additionally, look for the “Double Pin Bar” formation (two consecutive pin bars rejecting the exact same level) as a definitive confirmation of institutional defense at that price point.
7. The Pin Bar in Different Market Conditions
A pin bar’s signal is not universal; its meaning and strength are heavily influenced by the current market condition. A successful trader knows how to adapt their interpretation based on whether the market is trending or moving sideways.
In trending markets, pin bar signals are most reliable when they appear during a pullback, acting as a powerful continuation cue. Conversely, in sideways or ranging markets, these patterns excel at trading swings between well-defined supply and demand zones. A setup at support can indicate a potential move to the top of the range, while a similar pattern at resistance suggests a move to the bottom.
The pin bar is a universal signal of price rejection that works across all major markets, though some nuances exist:
- Forex trading: Pin bars are extremely common and reliable, especially on the daily and 4-hour charts of major currency pairs.
- Stocks: They are also very effective, particularly at key moving averages or after significant news events.
- Crypto: Pin bars work, but traders must account for the extreme volatility by often using wider stop-losses.
8. Pin Bar vs. Other Candlestick Patterns
A pin bar is often confused with other trading patterns. Understanding the key differences in their shape and meaning is crucial for accurate chart reading.
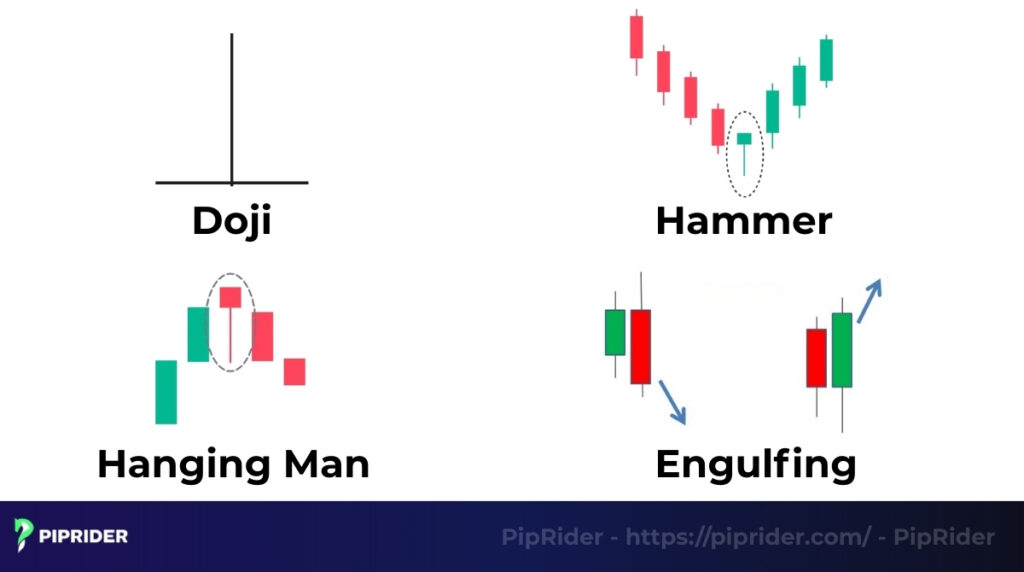
- Pin Bar vs. Doji: A Doji candle has a body in the middle, signaling pure indecision between buyers and sellers. In contrast, a pin bar has its body at one end, signaling a decisive rejection of a price level.
- Pin Bar vs. Hammer & Hanging Man: The key difference is context. The Hammer is a bullish pattern, forming after a downtrend. Conversely, a Hanging Man is a bearish pattern that forms after an uptrend. The term “Pin bar” is the more general name for the shape itself.
- Pin Bar vs. Engulfing Pattern: A pin bar is a single-candle pattern showing a rejection of a price level. An Engulfing pattern is a two-candle pattern showing a complete takeover of momentum across two sessions.
9. Common Mistakes When Trading
Even a powerful signal like the pin bar can lead to losses if not executed with discipline. Avoid these classic trading pitfalls:
- Trading in the “Middle of Nowhere”: As emphasized in our identification checklist, a pin bar is only as good as its context. Trading a pattern that forms in the middle of a choppy consolidation range, without any backing support, resistance, or moving average, is a low-probability gamble.
- Entering Before the Candle Closes: The shape of a candle can change drastically in its final seconds. Entering a trade while the pin bar is still forming is extremely risky. Always wait for the definitive candle close.
- Placing Stop-Losses Too Tight: Placing a stop-loss exactly at the very tip of the wick invites “whipsaw” losses from market makers. Always add a small buffer (factoring in the broker’s spread and market volatility using the ATR indicator) to avoid being stopped out prematurely.
- Trading on Micro-Timeframes: Pin bars on 1-minute or 5-minute charts are heavily saturated with market noise, algorithmic trading spikes, and false signals. Stick to the 1-hour, 4-hour, or Daily charts for reliable setups.
- Fighting a Dominant Trend: Attempting to catch a falling knife by trading a standalone bullish pin bar against an aggressive, high-momentum downtrend is a recipe for disaster. Always seek alignment with the broader market structure.
10. Pros and Cons of the Pattern
Like any technical analysis tool, the pin bar has its own set of strengths and weaknesses. Understanding both is key to using it effectively.
10.1. Pros
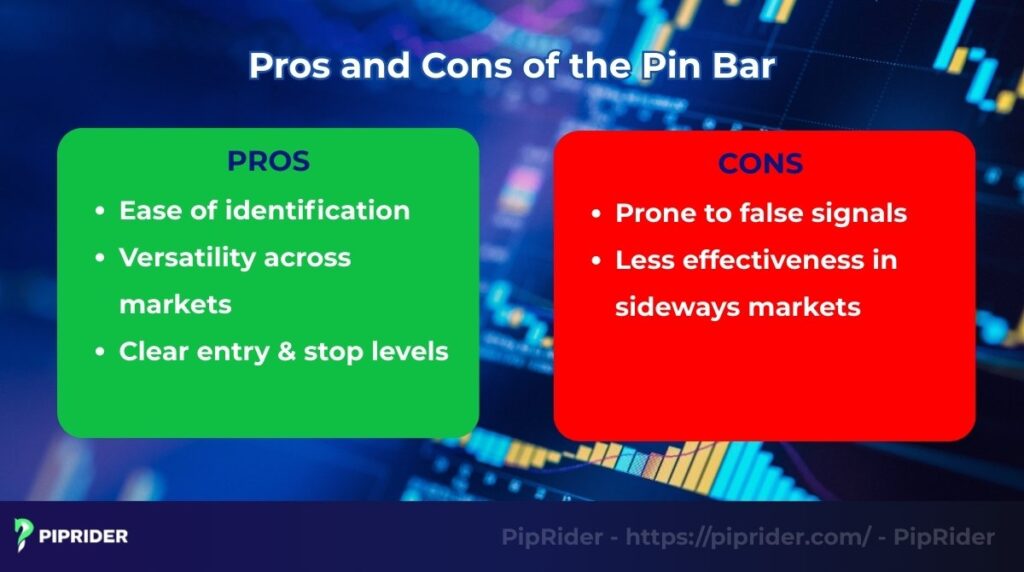
The pin bar is a favorite among price action traders for several key reasons:
- Ease of identification: Its distinct shape (small body, long wick) makes it one of the easiest candlestick patterns to spot on a chart, even for new traders.
- Versatility across markets: The psychology of price rejection is universal, making the pin bar an effective signal in various markets, including Forex, stocks, and crypto.
- Clear entry & stop levels: The pattern itself provides a logical framework for a trade. The high or low of the pin bar gives a clear entry trigger, while the end of its long tail offers a natural and defensible location for a stop-loss order.
10.2. Cons
However, traders must also be aware of the limitations:
- Prone to false signals: Not every pin bar is a valid signal. If traded out of context (e.g., against a very strong trend or in the middle of nowhere), they can often result in “fakeouts” or false reversals.
- Less effectiveness in sideways markets: In choppy, sideways markets without clear supply and demand zones, multiple conflicting pin bars can appear, leading to confusion and low-probability trades.
11. Frequently Asked Questions (FAQs)
12. Summary
The pin bar is a simple yet powerful price action signal that reveals a clear story of price rejection. While a single pin bar is a strong clue, its true predictive power is unlocked when it forms in a high-confluence area. By combining the signal with key price levels, volume analysis, and other confirming indicators, traders can identify high-quality reversal points and significantly optimize their trading strategy.
To further deepen your understanding of market dynamics and discover more high-confidence trading setups, we encourage you to explore our comprehensive Analysis section on Piprider.
Infographic Section
-

Pin Bar Candlestick Pattern -

4 – step Pin Bar Trading Strategy -

Pin Bar Reliability Checklist


