
Many traders know the RSI for measuring price momentum. The Relative Volatility Index (RVI) takes a different approach. Developed by Donald Dorsey, this technical indicator doesn’t just measure the speed of price changes; it measures the strength and direction of the market’s volatility.
It helps investors confirm if a trend is stable or if it is losing steam and ready to reverse. This guide explains how the RVI indicator works and how traders use it to find signals.
Key Takeaways
- The Relative Volatility Index measures the direction and strength of volatility, not just price momentum.
- RSI measures the speed of price changes, while RVI measures the consistency of those changes.
- A reading above 50 is generally bullish; a reading below 50 is generally bearish.
- Traders use the RVI to find divergences (when price and the indicator disagree) and 50-line crossovers to confirm a trend.
- It is a confirmation tool and works best when combined with other indicators or price action analysis.
1. What Is the Relative Volatility Index (RVI)?
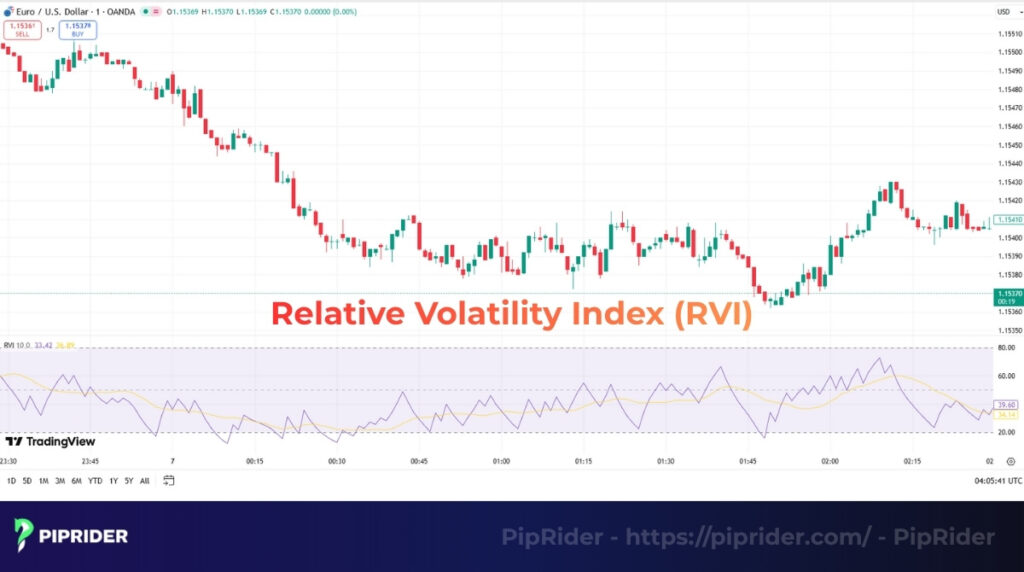
The Relative Volatility Index (RVI) is a technical analysis indicator developed by Donald Dorsey in 1993, designed to measure the direction of relative price volatility, not just price momentum.
This is the fundamental difference between the RVI vs. RSI:
- The RSI (Relative Strength Index) measures the magnitude of price change (How fast is the price moving?).
- The RVI calculates the standard deviation of price changes to determine the direction of the volatility (Is the volatility bullish or bearish?).
The RVI oscillates between 0 and 100, helping traders identify the dominant market force:
- RVI > 50 (Bullish Volatility): This confirms that volatility is biased to the upside. Buyers are driving the price expansion.
- RVI < 50 (Bearish Volatility): This confirms that volatility is biased to the downside. Sellers are driving the price expansion.
- RVI ≈ 50 (Neutral): This suggests a lack of clear volatility direction. The market is likely moving sideways or consolidating.
2. How the Relative Volatility Index Works
The Relative Volatility Index (RVI) works by measuring the strength of volatility, not just the speed of price. It operates on the idea that a strong trend should have consistent volatility in its primary direction.
2.1. The Concept Behind the RVI
The fundamental difference between the RVI and the standard RSI comes down to the specific market behavior they analyze:
- The RVI (Relative Volatility Index) measures volatility strength. It answers, “How consistent was the volatility during those market movements?”
- The RSI (Relative Strength Index) measures price momentum. It answers, “How fast and how much has the price changed?”
When price volatility increases in the same direction as the trend (e.g., strong upward volatility in an uptrend), the RVI rises. This provides a confirmation for trend-following traders.
2.2. The Calculation Logic (Dorsey’s Method)
The Relative Volatility Index mimics the logic of the RSI but swaps “Price Change” for “Standard Deviation.”
Unlike the RSI which only looks at closing prices, the original RVI developed by Donald Dorsey (and used on TradingView) calculates the Standard Deviation of the High and Low prices over a specific period (usually 10 days). This captures the full range of market volatility.
The direction of this volatility is then determined by the closing price:
- Upward Volatility: If today’s Close is higher than yesterday’s Close, the Standard Deviation is assigned to the “Up” bucket.
- Downward Volatility: If today’s Close is lower than yesterday’s Close, the Standard Deviation is assigned to the “Down” bucket.
3. The Relative Volatility Index Formula
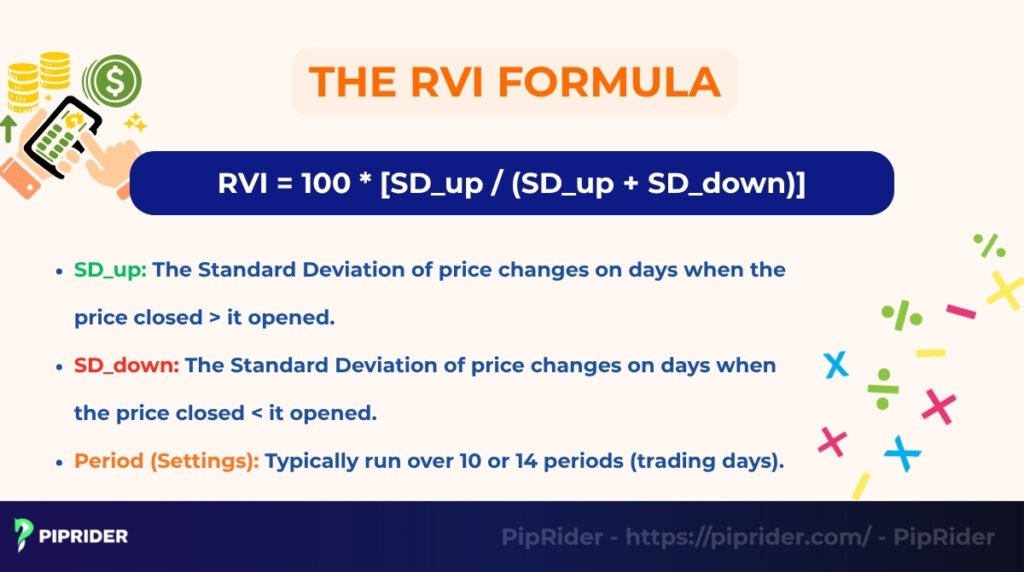
While trading platforms handle the math instantly, understanding the formula helps you interpret the signals correctly. The RVI formula structure mimics the RSI, but it measures volatility instead of price change.
Where the components are calculated as follows:
- Step 1 (Calculate Volatility): Calculate the Standard Deviation (SD) of the price over a 10-day period. This captures the raw volatility.
- Step 2 (Assign Direction):
- U (Up Volatility): If today’s Close > Yesterday’s Close, then U = SD (and D = 0).
- D (Down Volatility): If today’s Close < Yesterday’s Close, then D = SD (and U = 0).
- Step 3 (Smoothing): Apply a 14-period Wilder’s Smoothing (EMA) to the U and D values to get the final ratio.
Note on Variations: Different platforms (like TradingView vs. MetaTrader) may use slightly different inputs for the Standard Deviation (e.g., using High/Low range vs. Closing price). However, the core logic of measuring volatility direction remains the same.
How to Add RVI on TradingView
Setting up the indicator is simple, but you must choose the correct one to avoid confusion.
Step-by-Step Guide:
- Open your chart and click on Indicators (top menu).
- Type “Relative Volatility Index” in the search bar.
- Tip: Avoid typing just “RVI” or you might accidentally pick the Relative Vigor Index.
- Select the script labeled “Relative Volatility Index” (look for the Built-in version or the original by Donald Dorsey).
- Final Check: Once added, look at the scale. If the indicator oscillates between 0 and 100, you have the correct tool. (If it oscillates around 0, you picked the wrong Vigor Index).
4. How to Interpret the Relative Volatility Index
The RVI indicator provides traders with three primary types of trading signals: overbought/oversold levels, trend confirmation, and divergences.
4.1. Overbought and Oversold Levels
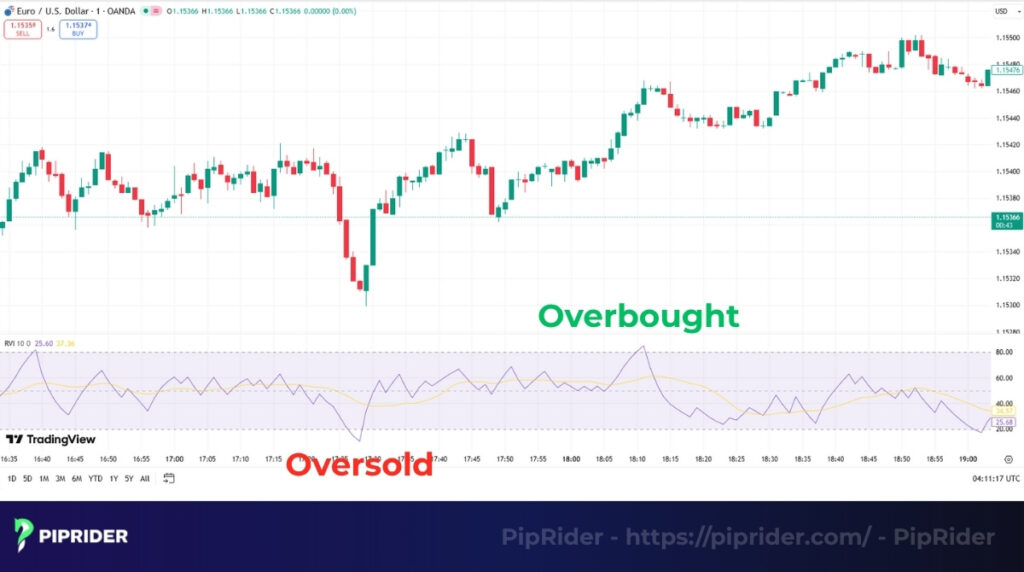
Like the RSI, the RVI oscillates between 0 and 100. However, the RVI uses different levels because it measures volatility, not momentum.
- Overbought: A reading above 80 suggests that upward volatility is at an extreme, and the market may be overbought.
- Oversold: A reading below 20 suggests that downward volatility is at an extreme, and the market may be oversold.
These signals are generally less sensitive (and show up less often) than the RSI’s 70/30 signals. This is because the RVI is reacting to the consistency of volatility, not just the speed of the price change.
4.2. Crossovers and Trend Confirmation
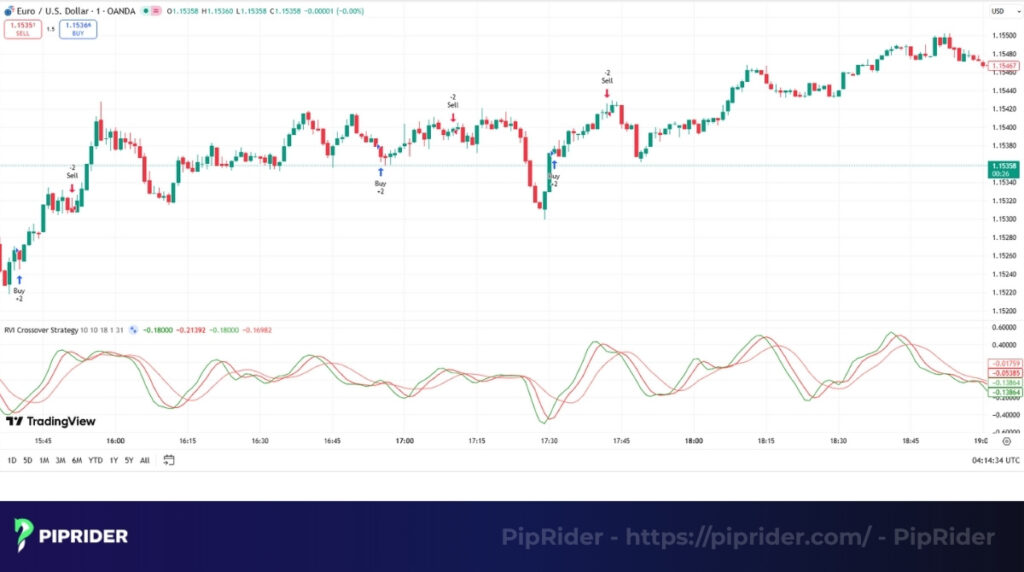
The 50-line is the RVI’s most important level for identifying the trend’s bias.
- Bullish Bias: When the RVI is above 50, it confirms that the market’s volatility is biased to the upside.
- Bearish Bias: When the RVI is below 40-50, it confirms that the volatility is biased to the downside.
Many traders also add a Signal Line (typically a 10-period EMA of the RVI) to generate short-term trading signals.
- A bullish signal occurs when the RVI line crosses above its signal line.
- A bearish signal occurs when the RVI line crosses below its signal line.
4.3. Divergences
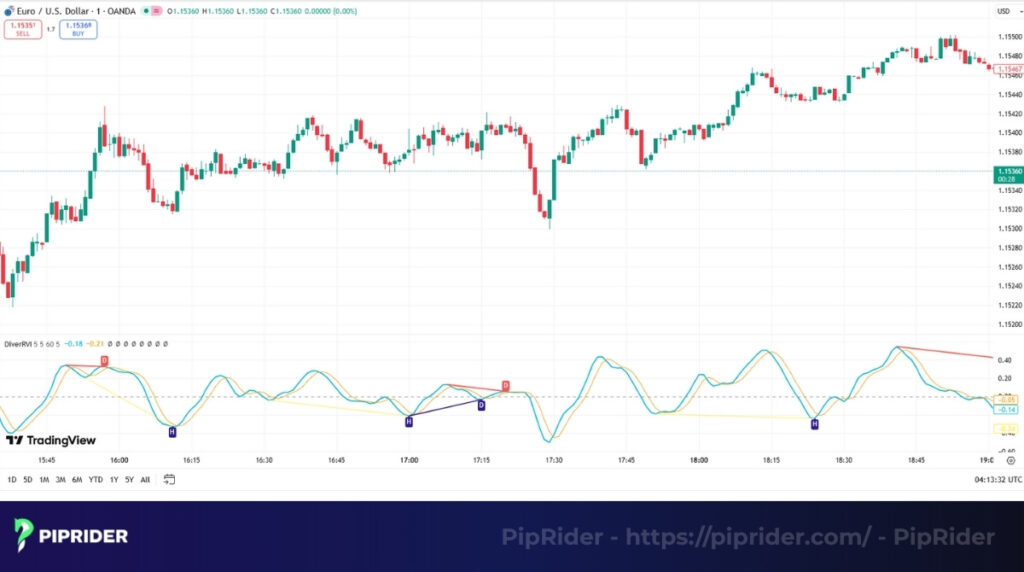
This is the most powerful signal from the RVI. Divergence occurs when the price is telling one story, but the RVI is telling a different one.
- Bullish Divergence: The price makes a new low, but the RVI indicator makes a higher low. This signals that the downward volatility is weakening, and a bullish reversal (price moving up) may be near.
- Bearish Divergence: The price makes a new high, but the RVI indicator makes a lower high. This signals that the upward volatility is weakening, and a bearish reversal (price moving down) may be near.
5. RVI vs. RSI – What’s the Difference?
Although the RVI and RSI (Relative Strength Index) appear identical on charts, they utilize fundamentally different formulas. The RSI measures speed, while the RVI measures volatility deviation.
| Feature | Relative Strength Index (RSI) | Relative Volatility Index (RVI) |
|---|---|---|
| Measures | Price Momentum (Speed of price change) |
Volatility Direction (Strength of deviation) |
| Core Input | Absolute Price Change (Close vs. Previous Close) |
Standard Deviation (Based on High/Low range) |
| Sensitivity | High / Reactive (Good for short-term signals) |
Smoother / Lagging (Better for filtering noise) |
| Best Use | Spotting Overbought/Oversold levels & Reversals. | Trend Confirmation & Divergence Filtering. |
6. Battle-Tested RVI Trading Strategies
The Relative Volatility Index works best as a confirmation tool. To filter out market noise, effective strategies combine RVI’s volatility data with trend indicators like Moving Averages. Below are three rule-based setups.
6.1. The “Trend Flow” Strategy (RVI + 50 EMA)
This strategy filters out counter-trend trades by ensuring price direction (EMA) and volatility direction (RVI) are aligned.
- The Setup: Price must be trading above the 50-period Exponential Moving Average (EMA) and RVI must cross above 50.
- Entry Trigger: Wait for the price to pullback and touch the 50 EMA. Enter a Long position when a green candle closes above the EMA while RVI remains above 50.
- Stop Loss: Place the stop loss below the recent Swing Low or use an ATR-based stop.
- Take Profit: Exit when the RVI drops back below 40 (signaling weakening volatility) or price closes below the 50 EMA.
6.2. The “Volatility Breakout” Strategy (RVI + Bollinger Bands)
RVI is excellent for confirming if a Bollinger Band breakout is real or a “fakeout.”
- The Setup: Price candles squeeze within narrow bands and then break above the Upper Bollinger Band.
- Entry Trigger: Check the RVI immediately. If RVI is surging above 60, it confirms strong upside volatility—enter on the candle close. If RVI is flat (near 50), it is likely a fakeout.
- Stop Loss: Place the stop loss below the middle band (20 SMA) or below the breakout candle’s low.
6.3. The “Momentum Confluence” Strategy (RVI + MACD)
This strategy uses confluence to increase win rates. The MACD identifies the momentum shift, while the RVI confirms the volatility support.
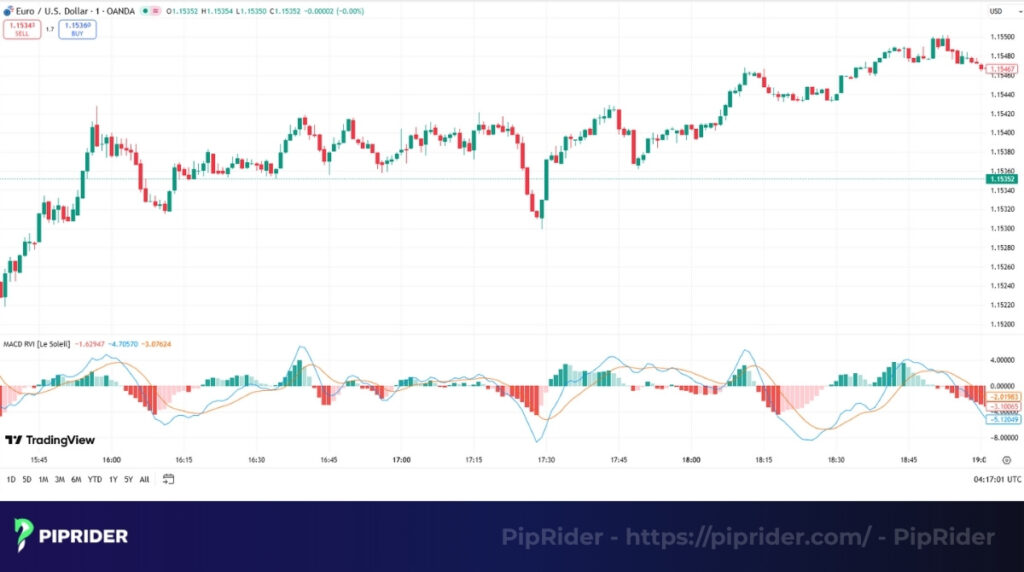
- The Setup: The MACD Line crosses above the Signal Line (Bullish Crossover).
- Entry Trigger: Enter ONLY if the RVI is simultaneously above 50. If MACD crosses up but RVI is below 50, the trend lacks the energy to sustain.
- Stop Loss: Place the stop loss below the most recent low formed before the MACD crossover.
6.4. The “No-Go” Checklist (When to Skip)
Before entering any position, run through this quick filter to avoid low-probability setups:
- Choppy Market: If RVI is hovering tightly around 50 (e.g., 48-52), do not trade.
- News Events: Avoid RVI signals 15 minutes before high-impact news (like NFP or FOMC).
- Trend Conflict: If the Daily trend is down, ignore 1-hour Buy signals.
- Candle Status: Never enter while the candle is still moving. Always wait for the close.
7. Limitations of the RVI indicator
No indicator is perfect, and the Relative Volatility Index (RVI) has clear weaknesses that investors must understand.
- Lagging nature: The RVI is a lagging indicator. Because its formula relies on Standard Deviation (SD) and moving averages of past data, its signals will always come after the price has already started to move.
- Poor in sideways markets: Like most trend-following indicators, the RVI is not effective in a sideways (choppy) market. In these conditions, it will produce many false and confusing signals (“noise”) as it oscillates around the 50-line.
- Requires confirmation: The RVI should not be used as a standalone tool. As a confirming indicator, its signals are much more reliable when used for confirmation. A trader should always combine RVI signals with price action (like a break of trendlines) or other trend filters to avoid acting on false signals.
8. Frequently asked questions about Relative Volatility Index
9. The Bottom Line
The Relative Volatility Index (RVI) is a valuable tool that helps traders measure the strength of market volatility, rather than just price momentum. When combined with other indicators like the RSI, MACD, or Bollinger Bands, the rvi indicator becomes a powerful confirming indicator for validating trends or spotting potential reversals.
However, traders must remember that the RVI is a supplementary tool. It should always be used in combination with primary price trend analysis and should not be relied upon by itself for signals. To learn more about more strategies and discover the powerful technical indicators list, explore the in-depth guides at PipRider.


