
Resistance drawing is a fundamental skill in technical analysis, used to identify specific price zones where selling pressure historically halts rallies. However, many traders struggle to distinguish between a minor hurdle and a major market barrier.
This guide provides a repeatable framework to plot high-quality resistance levels on any chart. By mastering this process, you can establish objective rules for entries and risk control, treating these levels as probabilities rather than guaranteed turning points.
Key Takeaways
- Resistance is the supply zone where sellers overwhelm buyers, halting the uptrend.
- Draw resistance by connecting two or more significant pivot highs (extreme price points).
- Strong resistance levels are validated by multiple touches, high volume, and higher timeframes (Daily/Weekly).
- A break triggers a role reversal, turning the former resistance level into new support.
- Use a resistance zone (not a single line) to filter out volatility and false breakouts.
1. What Are Support and Resistance Levels?
Support and Resistance (S&R) are the foundational concepts in technical analysis. They represent crucial price levels on a price chart where the balance between sellers and buyers is expected to shift, causing the price trend to pause or reverse.
1.1. Defining the Levels
Support and Resistance are the most fundamental concepts in charting, defining the boundaries of market psychology. Here is how these two essential price levels are defined:
| Concept | Definition | Key Action |
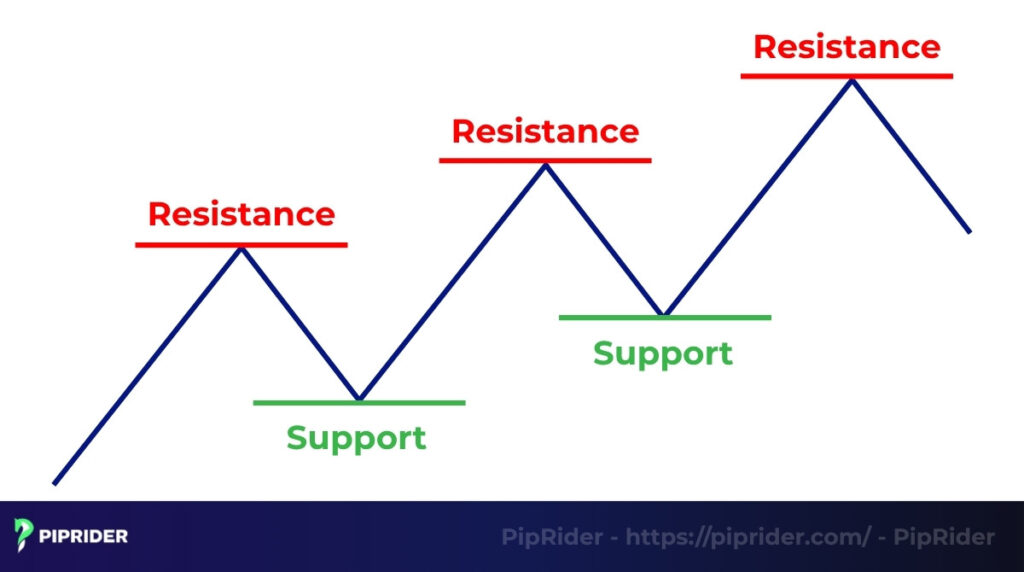
| Resistance (The Price Ceiling) | A price point or zone where an excess of supply (selling) is strong enough to halt or reverse an upward trend. | Traders view this level as a ceiling that price struggles to break through, as sellers overwhelm buyers. |
| Support (The Price Floor) | A price point or zone where rising demand (buying) is strong enough to halt or reverse a price decline. | Traders view this level as a floor that price struggles to break below, often anticipating a bounce as buyers step in. |
Together, these are the two essential support and resistance levels that determine market structure.
1.2. Why S&R is Foundational to Technical Analysis
Support and Resistance levels are the bedrock of chart reading because they directly reflect human behavior and collective psychology.
- Identifies imbalance: They visually show where the supply and demand equilibrium is lost, providing the first clear indication of market weakness (at resistance) or strength (at support).
- Predicted turning points: S&R levels are the primary areas where professional traders anticipate price reversals. Knowing these zones allows traders to set strategic entry and exit points, greatly assisting in how to determine support and resistance for effective risk management.
- Universal application: These levels form the basis of all charting. They work across every market (like forex trading and stock) and every timeframe, making them the most universally applicable tool for any trader or investor.
2. Why Do Resistance Levels Form?
Resistance levels aren’t random; they are created by market psychology and collective financial memory. They form because human emotion dictates that specific price points will trigger overwhelming selling interest, halting the current uptrend.
2.1. Psychology: The Memory of Price
The primary engine is human emotion, particularly regret and the desire to “break even.” When price returns to a previous high, it triggers two key groups to sell:
- Regretful buyers: Traders who bought near the last peak now use the rally as a chance to exit at their original entry point, creating instant supply.
- Profit takers: Traders who bought lower use the high to cash out, while new short sellers enter the market.
This massive selling interest, anchored to a past price failure, is the psychological mechanism behind every strong resistance point in a stock or forex pair.
2.2. The Role of the Supply Zone
When this concentrated selling action hits the market, the resistance level functions as a supply zone or price ceiling.
- Mechanism: Large traders cluster selling orders here. As price enters the zone, the sheer volume of supply completely overwhelms the existing demand (selling interest > demand). This imbalance is what stops the upward momentum.
- Result: The more frequently a price level acts as this zone, the stronger it becomes, psychologically reinforcing its role as an untouchable price ceiling until a major market catalyst shifts the imbalance
3. Types of Resistance Levels
When learning resistance drawing, it’s crucial to recognize that resistance isn’t limited to a single horizontal line. It appears in various forms on the chart, depending on the market structure and the tools used for plotting. Understanding these types is essential for developing a comprehensive trading strategy.
3.1. Horizontal Resistance (Static)
This is the most common and easily identified type. Horizontal is a fixed price level or resistance zone established by connecting multiple previous swing highs that occur at roughly the same price. It represents a clear, unchanging price ceiling where supply previously overwhelmed demand.
Application: Traders primarily use these fixed zones to set clear Take Profit targets for existing long positions or to identify potential breakout points if the price closes above the ceiling.
3.2. Trendline Resistance (Sloping/Dynamic)
Trendline is a downward-sloping resistance line drawn above the price action, connecting two or more significant descending pivot highs. It acts as a dynamic ceiling that falls over time, defining the upper boundary of a downtrend or correction. As price attempts to rally, it finds resistance at this moving barrier.
Application: This tool is essential for timing trend-continuation entries. Traders look to sell when the price pulls back to touch the trendline, betting that the downtrend will resume.
3.3. Dynamic Resistance (Moving Averages)
Dynamic Resistance is a form of resistance that constantly moves in sync with the current average price. The most common example is a Moving Average (MA). Instead of being anchored to past highs, it represents the average buying/selling pressure over a specific period. When price is below this tool, it often acts as resistance, especially the 50-period and 200-period MAs.
Other Examples: The upper band of Bollinger Bands often serves as temporary dynamic resistance during volatile moves.
3.4. Psychological and Statistical Resistance
These levels are not drawn using price action but are derived from mathematical concepts or market psychology.
| Type | Source | Mechanism | Application |
| Psychological | Round Numbers (e.g., $100, 1.3500, $2000). | Large institutions often place bulk orders at round numbers, turning them into self-fulfilling prophecy resistance zones. | Essential in support and resistance forex and key resistance level of a stock analysis. |
| Statistical | Fibonacci Retracement / Pivot Points. | Price levels derived from the Fibonacci sequence (38.2%, 61.8%) or calculated daily/weekly averages (Pivot Points) act as strong forecasting resistance levels based on widely-used formulas. | Used to anticipate potential reversal points where price has no previous history. |
Identifying strong support and resistance levels requires looking for areas where these different types (Horizontal, Trendline, Dynamic, and Statistical) converge (meet).
4. How to Draw Resistance Levels: Step by Step
Learning how to draw support and resistance accurately is critical. These four objective steps will guide your charting process, helping you transition from identifying general areas to plotting reliable key lines and zones.
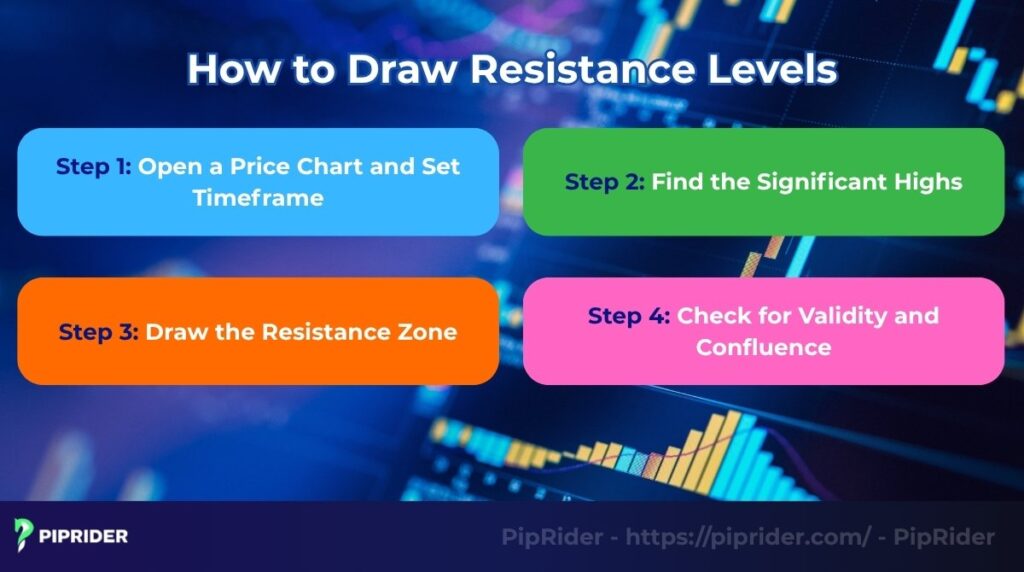
Step 1 – Open a Price Chart and Set Timeframe
For the strongest signals, always apply a “Top-Down” analysis. Do not start on the timeframe you trade; start one level higher to see the big picture.
- For Swing/Position Trading: Start drawing major levels on the Weekly (W1) chart, then refine the precise zones on the Daily (D1) chart.
- For Day Trading: Identify the main trend barriers on the Daily (D1) chart first, then drop to the 4-Hour (H4) or 1-Hour (H1) to plot intraday resistance.
Rule of Thumb: Never start drawing on lower timeframes (M15 or M5) without mapping the higher-timeframe context first. Levels from D1/W1 always overpower intraday noise.
Step 2 – Find the Significant Highs (Pivot Highs)
The foundation of any resistance level is the pivot highs, which mark clear points of exhaustion in the uptrend.
- Action: Scan the chart to identify the most significant swing highs where the price was decisively rejected and reversed its course. These are the turning points that demonstrate strong historical selling pressure.
- Focus: Look for the peaks that stand out clearly. Avoid connecting small, choppy fluctuations; stick to the boldest highs, as these are the points most traders are watching.
Step 3 – Draw the Resistance Zone (Not Just a Line)
To reflect actual market dynamics and account for price fluctuation, treat resistance as a zone rather than a single price point.
- Action: Connect the most significant two or three pivot highs using your charting tool.
- The Zone: Draw trendlines connecting wicks (absolute high) for the top of the zone. Consider the highest closing value as the bottom boundary of the zone. This area between closing high and extreme wick provides a realistic margin of error, helping to minimize false signals when analyzing market action.
Step 4 – Check for Validity and Confluence
A line is just a line until the market proves it is a valid level. This is key to determine support and resistance strength.
- Number of Touches: A resistance line is confirmed as a strong level only after the price has approached and been rejected at least three times. The more touches, the stronger the conviction.
- Volume Check: Look for high volume coinciding with the price rejection at your drawn level. High volume confirms that major market participants are defending the zone.
Note for Forex Traders: In spot forex, volume represents “tick volume” (broker-based activity), not total exchange turnover. Treat volume as supportive confirmation only; prioritize price action, retests, and higher-timeframe confluence for validation. - Candle Confirmation: Look for confirming candlestick patterns at the level (e.g., Bearish Engulfing or Pin Bar) to signal that the selling pressure has effectively returned.
5. Rules and Best Practices for Resistance Drawing
Successful resistance drawing requires more than just connecting dots; it requires a disciplined approach to filter out market noise. Follow these rules to ensure your levels are actionable.
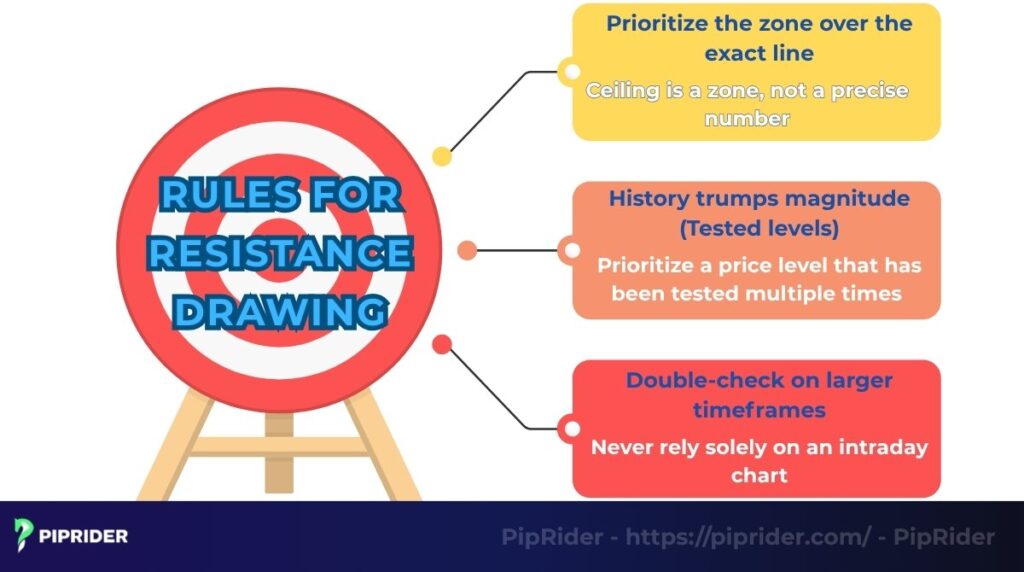
5.1. Line vs. Zone: The “Wick-to-Close” Rule
A common question among traders is: “Should I draw resistance at the wicks or the candle bodies?” The professional answer is both. Instead of a thin line, use this formula to create a noise-filtering zone:
The Golden Rule:
- Wicks show rejection extremes (temporary panic or euphoria).
- Closes show where the market actually accepted value (consensus).
- The Zone Formula: Draw your resistance area from the highest wick down to the highest body close. This creates a “buffer” that prevents you from getting stopped out by random volatility.
5.2. Validation Rules (Best Practices)
Once you have plotted the zone, apply these two filters to confirm its strength:
- The “Rule of 3” (History Trumps Magnitude): Always prioritize a level that has been tested at least three times. Multiple rejections prove that the market participants respect this barrier, whereas a single high point is just an anomaly.
- The “Higher Timeframe” Filter: Never rely solely on intraday charts (M5/M15). Intraday levels are prone to noise. Always validate your zones on the Daily (D1) or Weekly (W1) charts. If the zone is invisible on the higher timeframe, it is likely too weak to hold a trade.
6. How to Identify Strong Resistance Levels
The key to how to identify strong support and resistance levels is looking for confluence across these three factors:
- Volume and tests: A key level is strong only if it has been rejected multiple times (three or more touches) and that rejection is confirmed by a spike in high volume. This proves the presence of genuine supply.
- Psychological alignment: Strength is significantly amplified when the supply zone aligns with major round numbers (e.g., $100.00) or key statistical tools like Fibonacci Retracements or Moving Averages.
- Timeframe dominance: Always prioritize levels found on higher timeframes (Weekly/Daily charts). These key levels show commitment from long-term capital and should govern all your shorter-term technical decisions.
7. Trading Strategies Using Resistance
Key lines and zones are not just for analysis; they are designed to dictate actionable trade setups. Learning how to draw them correctly allows you to anticipate major turning points and apply these three core strategies to markets like forex and stock.
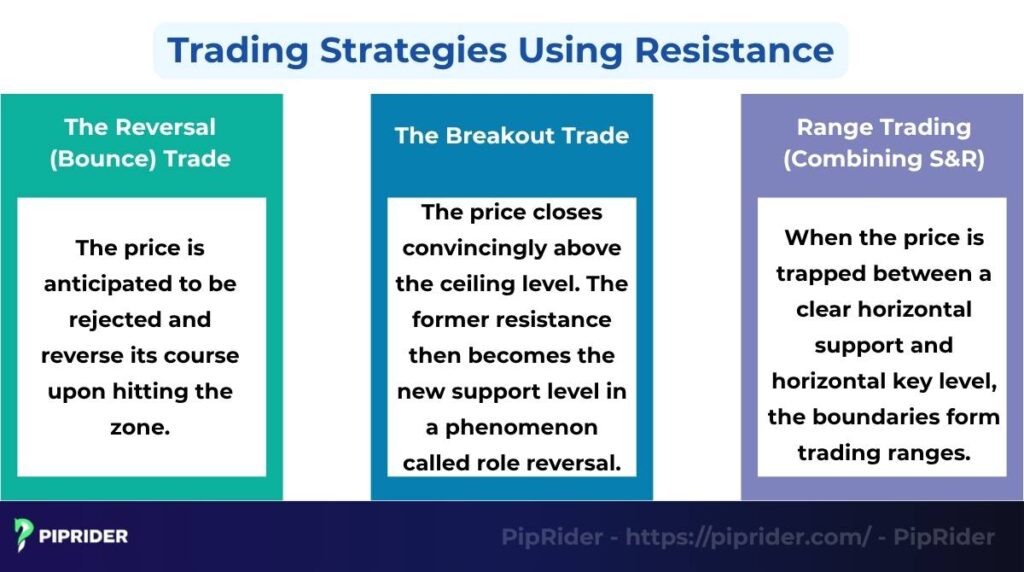
7.1. The Reversal (Bounce) Trade
The reversal strategy assumes that the established resistance level is strong and will hold against the current buying pressure. It is a counter-trend or trend-exhaustion trade.
- How it works: The price is anticipated to be rejected and reverse its course upon hitting the zone.
- Action: When bearish confirmation is seen (e.g., a reversal candlestick like a Pin Bar or Engulfing pattern) at the key level, a Sell/Short position is initiated. This entry is based on expecting a price decline.
- Risk management: The stop-loss order should be placed just above the highest point of the zone to protect against an unexpected breakout.
7.2. The Breakout Trade (Role Reversal)
When price breaks a resistance level convincingly, that level flips its role to become new Support. This is the classic “Role Reversal” setup. However, to avoid getting trapped by a “Fake-out,” you must validate the breakout before entering.
7.2.1. The “True Breakout” Checklist
Before placing a trade, ensure these 4 conditions are met:
- The “Hard” Close: The candle body must close clearly above the resistance zone. If only the wick pokes through, it is likely a trap.
- Impulse Momentum: Look for a large, decisive bullish candle (Marubozu). Small, weak candles indicate a lack of conviction.
- Confluence: Ideally, the breakout aligns with other factors like a round number or a Moving Average crossover.
- Volume Spike: A genuine breakout is almost always fueled by a surge in volume (tick volume in Forex).
7.2.2. Execution Strategy
Once the checklist is passed, choose your entry based on your risk profile:
- Conservative Entry (Recommended): Wait for the price to pull back and touch the broken level (the Retest). Enter only when you see a bullish bounce. This confirms the new support holds.
- Aggressive Entry: Enter immediately on the close of the breakout candle. This captures the move early but carries a higher risk of failure.
7.3. Range Trading (Combining S&R)
Range trading strategy is used when the market is moving sideways, lacking a strong directional trend, a pattern commonly seen in technical analysis.
- How it works: When the price is trapped between a clear horizontal support and horizontal key level, the boundaries form trading ranges.
- Action: Sell/Short asset near the ceiling and Buy/Long asset near floor (support level), taking profit on moves between two support and resistance levels.
- Warning: Range trading requires strict risk management because a powerful breakout of either S&R level will invalidate the strategy and signal a major directional move.
8. Common Mistakes in Resistance Drawing (Concise)
Effective charting means knowing what not to draw. Avoid these four critical mistakes that mislead most beginner traders:
- Cluttering the Chart (Analysis Paralysis): This is the most common error. Drawing every minor pivot creates a “spider web” that makes price action impossible to read. Less is more. Mark only the 3-5 most relevant zones closest to the current price on higher timeframes.
- Treating Resistance as a Single Line: The market is volatile; never plot just one thin ceiling line. Instead, define zones by capturing the area between the candle bodies and the extreme wicks to filter out minor fluctuations.
- Relying on “Noise” Timeframes: Levels identified solely on M5 or M15 charts are often broken easily by institutional order flow. Always validate the strength of a level on a Higher Timeframe (H4 or Daily) before trusting it.
- Using Outdated Levels: Support and resistance are dynamic. A level from 3 years ago that price hasn’t touched recently is likely irrelevant. Regularly “clean house” and delete old lines to keep your analysis sharp.
9. FAQs
10. Conclusion
Mastering resistance drawing is the single most important step in successful technical analysis. It moves you from reacting to the market to anticipating future price movement. By consistently applying the objective steps outlined in this guide, you gain the confidence needed to identify truly strong key levels.
Your Quick Charting Checklist
- Open Chart: Start on the Daily/H4 timeframe.
- Find Highs: Identify and mark significant swing highs or pivot highs.
- Draw Zone: Plot the zones (not a single line) to capture wicks and bodies.
- Check Validity: Ensure the support and resistance levels have been tested at least three times.
The most reliable trade signals are rarely found alone. Always confirm your trade signals by combining your drawn zones with decisive price action (candlestick patterns) and a spike in volume. This confluence is the professional trader’s secret to dramatically increasing trade accuracy, preventing an unexpected price decline.
Ready to enhance your toolkit? Explore Piprider’s full library of analysis techniques and platform guides. View more articles in our Trading Strategies section today.


