

Mistakes such as buying near market tops or selling near bottoms often occur when traders confuse strong price movement with a sustainable trend. The RSI Relative Strength Index is a powerful momentum tool created to mitigate this problem. Developed by J. Welles Wilder Jr., the RSI acts as a momentum gauge, effectively signaling when an asset’s price is entering an overbought or oversold state.
This comprehensive guide will provide everything needed to master the RSI, from its formula and advanced strategies to the key limitations and mistakes to avoid.
Key Takeaways
- RSI is a momentum tool that measures the speed and magnitude of a security’s price change on a 0-100 scale.
- The main signals are generated when RSI indicates an extreme market state.
- Trading with RSI divergence is one of the most powerful advanced techniques.
- The standard 14-period setting is the best for starting and mastering this indicator.
- RSI is a confirmation tool, not a standalone trading system, and is most effective when used with key price levels.
1. What is the RSI Relative Strength Index?
The RSI, short for Relative Strength Index, is a technical indicator designed to measure the velocity and change in price. In simple terms, this tool helps traders identify when an asset is potentially overextended to the upside or downside, making it a powerful part of any analytical framework.

The RSI was created by the brilliant engineer and analyst J. Welles Wilder Jr. and first detailed in his 1978 book, New Concepts in Technical Trading Systems (Wilder, 1978; Investopedia, 2025). In the decades since, it has grown to be one of the most popular technical tools globally, featured on every charting platform from TradingView to MT4 (TradingView, n.d.).
The core purpose of the RSI is to gauge the internal strength of a trend. The indicator functions by contrasting the size of an asset’s recent positive price with the size of its recent negative ones, then charting the outcome on a 0-to-100 scale.
The price chart tells what is happening; the RSI indicator tells how much power is left in the tank. When the price climbs higher but the RSI fails to follow, it serves as a critical warning that the underlying trend is losing power and may soon reverse.
2. How to calculate the Relative Strength Index?
Traders absolutely do not need to calculate the RSI Relative Strength Index by hand, the charting software does it instantly. However, taking a moment to understand the logic behind its formula is what separates traders who use it blindly from those who truly understand what it’s telling them.
2.1. The formula
At its core, the RSI is built from two main parts. It first calculates a value called ‘Relative Strength‘ (RS), then plugs that value into the main RSI formula to normalize it on a 0-100 scale.
Here are the formulas:
| RS = Average Gain / Average Loss |
| RSI = 100 – [100 / (1 + RS)] |
The “Average Gain” and “Average Loss” are calculated over a specific number of periods, which is almost always set to 14 by default. Traders can also add tools like VWAP and volume analytics to get a more complete picture of price behavior.
2.2. The calculation process in simple steps
Let’s break down how your computer thinks when it calculates the RSI Relative Strength Index. Understanding this process helps you appreciate why it’s such a robust tool.
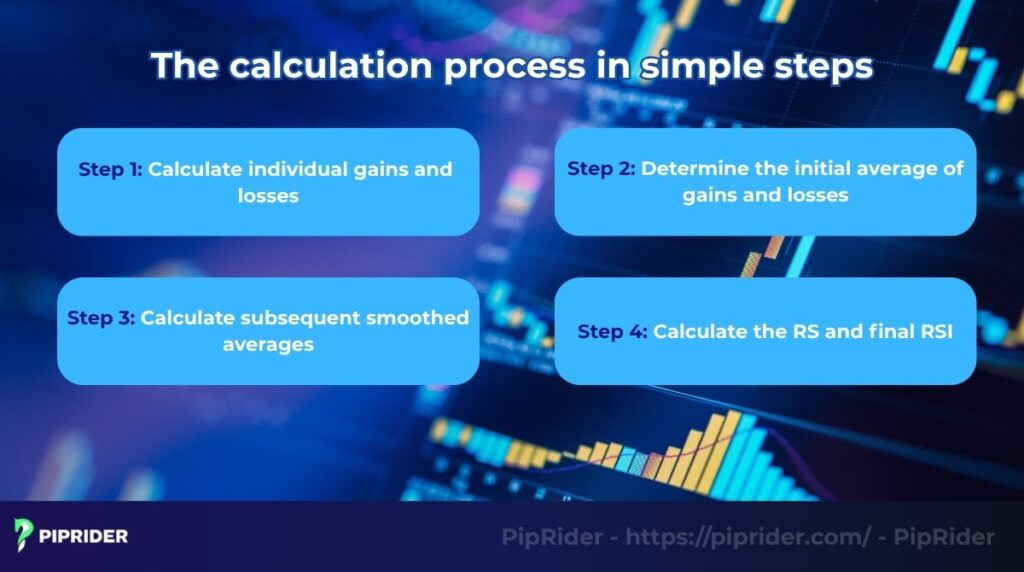
Step 1: Calculate individual gains and losses
The calculation begins by examining the price change over the past 14 periods (e.g., the last 14 days). It then separates these into two lists: one for periods that closed with a gain, and one for those that closed with a loss.
Step 2: Determine the initial average of gains and losses
For the initial calculation, it simply averages all entries from the two lists.
Step 3: Calculate subsequent smoothed averages
This is the clever part that J. Welles Wilder Jr. designed. For every new period after the first one, the indicator uses a unique smoothing method known as Wilder’s Smoothing. While often compared to an Exponential Moving Average (EMA), Wilder’s method reacts slightly slower, preserving the “memory” of past price changes longer to create a more stable indicator line (TC2000, n.d.).
Step 4: Calculate the RS and final RSI
An average gain is divided by an average loss to yield the RS value, which is then plugged into the main formula for the final RSI number you see on the chart.
2.3. A practical example
Let’s make this real with some simple numbers. Imagine we are looking at the last 14 days for the EUR/USD pair.
- After the smoothing process, let’s say the indicator calculates that the average gain over the last 14 days was 20 pips.
- In that same period, the average loss was only 5 pips.
Now, we just plug those into the formula:
- First, we find the RS:
| RS = 20 pips (Average Gain) / 5 pips (Average Loss) = 4 |
An RS value of 4 is very strong. It tells us that, on average, the bullish moves have been four times stronger than the bearish moves recently.
- Then, we calculate the final RSI:
| RSI = 100 – [100 / (1 + 4)] = 80 |
An RSI reading of 80 is a clear signal of powerful overbought momentum.
2.4. How to set up the RSI on TradingView & MT4
Setting up the indicator is straightforward on most platforms. Here is the quick process for the two most popular ones (TradingView, n.d.).
On TradingView:
- Open Indicators: Click the “Indicators” tab on the top toolbar.
- Search: Type “Relative Strength Index” and select the built-in version under “Technicals”.
- Configure: Click the Settings (gear icon) on the indicator line:
- Inputs Tab: Keep Length at 14 (Default).
- Style Tab: Set the RSI Upper Band to 70 and Lower Band to 30. (Note: You can adjust these to 80/20 for volatile markets).
On MetaTrader 4 (MT4):
- Navigate: Go to Insert > Indicators > Oscillators > Relative Strength Index.
- Parameters: In the popup window, set the Period to 14 under the “Parameters” tab.
- Levels: Switch to the Levels tab and ensure 30 and 70 are listed. Click OK to apply.
3. Understanding RSI levels and market conditions
This is the primary function of the RSI Relative Strength Index and the first thing every new trader learns. The indicator’s 0-100 scale is divided into three key zones that help you quickly gauge the market’s state.
3.1. The classic 70/30 levels
The standard and most widely accepted levels were set by Wilder himself. Understanding the meaning of these levels is your first step to interpreting the indicator correctly.
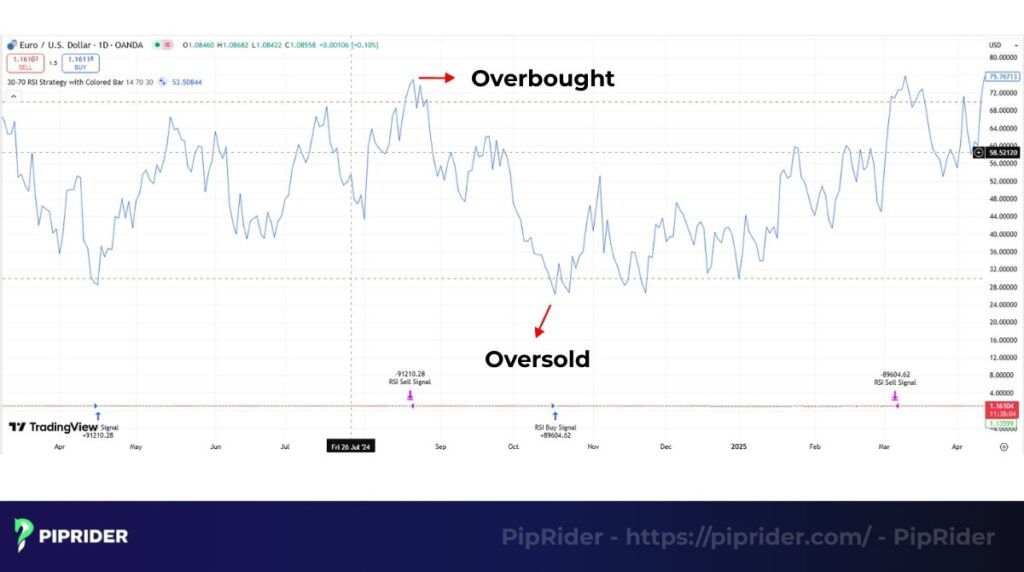
- The chart above shows that an RSI reading that climbs above the 70 mark indicates a state of extreme buying pressure. It’s crucial to understand that this is not a guarantee that the price will reverse right away. It’s better to think of this as a warning sign that the overbought momentum is reaching an extreme, and the trend may be overextended and vulnerable to a corrective pullback.
- Conversely, when the RSI falls below the 30 level, the market is deemed to be in an oversold state. This suggests that bearish pressure has been intense and that the move might be running out of steam. Again, this is a warning, not an automatic trading decision.
3.2. A critical mistake to avoid
One of the single biggest mistake new traders make is to immediately sell the moment the RSI crosses 70, or buy the moment it crosses 30. This is a recipe for disaster.
In a very strong, powerful bullish trend, the RSI can enter the extreme zone and stay there for a very long time as the price continues to grind higher. If you automatically sell every time the RSI shows a high reading in a strong uptrend, you risk being steamrolled by the prevailing trend.
3.3. An advanced tip: Adjusting levels for the trend
This is a professional technique that can dramatically improve your RSI analysis. Instead of always using 70/30, you can adjust the levels based on the primary trend to get more relevant signals.
- In a strong bullish trend: The market will naturally have stronger momentum. In this case, adjust the levels to 80 and 40. The 80 level becomes the new, more reliable overbought signal, and the 40-50 zone often acts as a key area for the RSI during pullbacks.
- In a strong downtrend: The opposite is true. You should adjust the levels to 60 and 20. The 20 level becomes the new oversold signal, and the 50-60 zone often acts as a key area for the RSI during minor rallies.
By adapting your levels to the market’s current personality, you move from a rigid, one-size-fits-all approach to a more dynamic and intelligent form of analysis.
4. 3 High-Probability RSI Trading Strategies
Knowing the levels is one thing, but building a disciplined strategy around them is what truly matters. Without a clear set of rules, an indicator is merely a line on your screen.
We have refined three specific strategies into actionable checklists. Do not take a trade unless all 5 conditions are met.
4.1. Strategy 1: The “Divergence Reversal” (Counter-Trend)
This strategy aims to catch market tops and bottoms when momentum contradicts price action. It is high-risk, high-reward, so confirmation is mandatory.
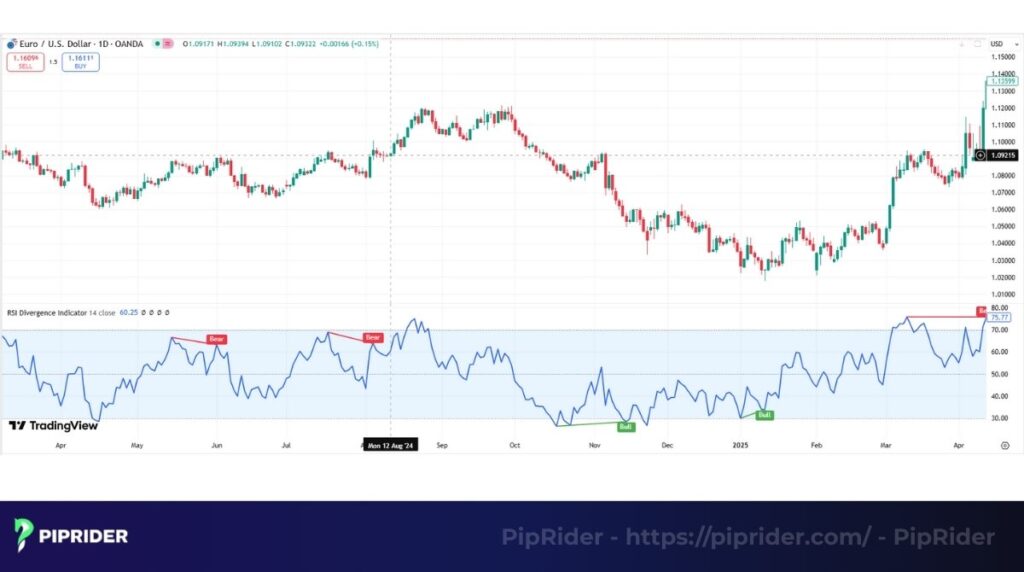
A) Bullish Divergence (Buy Signal)
- Market Condition: Price hits a key Support Level AND makes a Lower Low, while RSI makes a Higher Low.
- Entry Trigger: Wait for price to break a Descending Trendline drawn on the chart OR print a strong Bullish Engulfing/Pinbar. Wait for candle close.
- Stop-Loss Rule: Place SL 5-10 pips below the recent Swing Low (the lowest point of the divergence).
- Take-Profit Rule: TP1: The nearest significant Resistance Level. TP2: The recent Swing High.
- Invalidation (No Go): Cancel setup if RSI breaks below 30 again or price smashes through support with a big bearish candle.
B) Bearish Divergence (Sell Signal)
- Market Condition: Price hits a key Resistance Level AND makes a Higher High, while RSI makes a Lower High.
- Entry Trigger: Wait for price to break an Ascending Trendline OR print a strong Bearish Engulfing/Shooting Star. Wait for candle close.
- Stop-Loss Rule: Place SL 5-10 pips above the recent Swing High.
- Take-Profit Rule: TP1: The nearest significant Support Level. TP2: The recent Swing Low.
- Invalidation (No Go): Cancel setup if RSI breaks above 70 again or price blasts through resistance.
4.2. Strategy 2: The “Trend Pullback” (Continuation)
Instead of fighting the trend, this strategy joins it. In strong trends, RSI rarely hits 30 or 70. We use adjusted zones to catch the “dip”.
A) Uptrend Pullback (Buy the Dip)
- Market Condition: Strong Uptrend (Price > EMA 50/200). RSI Levels adjusted to 80/40.
- Entry Trigger: RSI pulls back into the 40–50 zone (Support Zone), then crosses back ABOVE 50. Price must show rejection wicks at this level.
- Stop-Loss Rule: Place SL below the recent Swing Low formed during the pullback.
- Take-Profit Rule: Target: The recent Swing High (Trend Continuation).
- Invalidation (No Go): Do not enter if RSI crashes below 40 with strong momentum (Trend might be reversing).
B) Downtrend Pullback (Sell the Rally)
- Market Condition: Strong Downtrend (Price < EMA 50/200). RSI Levels adjusted to 60/20.
- Entry Trigger: RSI rallies into the 50–60 zone (Resistance Zone), then crosses back BELOW 50. Price must show rejection wicks.
- Stop-Loss Rule: Place SL above the recent Swing High formed during the rally.
- Take-Profit Rule: Target: The recent Swing Low.
- Invalidation (No Go): Do not enter if RSI pushes above 60 with strong momentum.
4.3. Strategy 3: The “Centerline Crossover” (Breakout)
While Strategy 2 catches pullbacks, this strategy is designed to catch the start of a new trend or a breakout from consolidation. The 50 level (Centerline) is often the hidden gem for confirming market direction (Babypips, n.d.).
A) Bullish Crossover (Start of Uptrend)
- Market Condition: Price breaks above a key Resistance or the 20 SMA. Market wakes up from a slumber.
- Entry Trigger: RSI crosses from below to ABOVE 50 decisively. Must wait for candle close to confirm it’s not a fakeout.
- Stop-Loss Rule: Place SL below the breakout candle or recent Swing Low.
- Take-Profit Rule: Target: The next Resistance zone or when RSI hits 70 (Overbought).
- Invalidation (No Go): CRITICAL: Do not trade if the market is “Choppy” (Candles are small and overlapping, RSI is dancing around 50).
B) Bearish Crossover (Start of Downtrend)
- Market Condition: Price breaks below a key Support or the 20 SMA.
- Entry Trigger: RSI crosses from above to BELOW 50 decisively. Wait for candle close.
- Stop-Loss Rule: Place SL above the breakdown candle or recent Swing High.
- Take-Profit Rule: Target: The next Support zone or when RSI hits 30 (Oversold).
- Invalidation (No Go): Abort if the crossover candle immediately reverses (Fakeout).
4.4. Strategy 4: The “Failure Swing” (Wilder’s Original Signal)
This is a specific pattern identified by J. Welles Wilder Jr. himself. Unlike divergence, the Failure Swing focuses solely on the RSI line, ignoring price action noise. Wilder considered this one of the strongest reversal signals available.
A) Bullish Failure Swing (The “W” Bottom)
- Market Condition: RSI drops below 30 (Oversold), bounces back above 30, then pulls back but fails to drop below 30 again (forming a Higher Low).
- Entry Trigger: Buy when the RSI breaks above its recent Swing High (the middle peak of the “W” shape). Price must confirm with a bullish candle.
- Stop-Loss Rule: Place SL below the lowest point of the recent price swing.
- Take-Profit Rule: Target: The next major Resistance level.
- Invalidation (No Go): Cancel if RSI drops back below 30 before breaking the Swing High.
B) Bearish Failure Swing (The “M” Top)
- Market Condition: RSI rises above 70 (Overbought), drops back below 70, then rallies but fails to rise above 70 again (forming a Lower High).
- Entry Trigger: Sell when the RSI breaks below its recent Swing Low (the middle valley of the “M” shape). Price must confirm with a bearish candle.
- Stop-Loss Rule: Place SL above the highest point of the recent price swing.
- Take-Profit Rule: Target: The next major Support level.
- Invalidation (No Go): Cancel if RSI pushes back above 70 before breaking the Swing Low.
5. Best RSI settings for different trading styles
What is the setting for the RSI Relative Strength Index? The honest answer is that there is no single “best” setting, but there are smarter settings depending on your trading style and goals.
The only parameter you can change is the ‘period’, which is the lookback window for the calculation. The default of 14 periods was chosen by Wilder himself and has become the industry standard for a reason. For most traders, especially when you are starting out, you should master the 14-period RSI first.
With experience, however, you can modify the period to increase or decrease the indicator’s sensitivity. A shorter period makes it faster and more sensitive, while a longer period makes it slower and smoother.
Here is a simple table to guide your adjustments based on your trading style.
| Trading style | Common RSI period | Logic and purpose |
|---|---|---|
| Scalping | 2 to 6 | Needs to be extremely sensitive to very small, immediate price changes. The goal is to catch tiny momentum shifts. |
| Day trading | 7 to 11 | A slightly faster setting than the default to capture momentum shifts within a single trading day. |
| Swing trading | 14 (Standard) | This is the traditional and most widely used setting. It’s the perfect balance for analyzing trends that last several days to weeks. |
| Position trading | 21 to 30 | Needs to be very slow and smooth to filter out all short-term market noise and focus only on the major, primary trend. |
Key takeaway: Don’t endlessly search for a “magic” setting. A shorter setting will always give more signals, but most will be false. A longer setting will give fewer signals, but they will generally be more reliable. Choose the setting that best fits the timeframe you are trading.
6. RSI advantages and limitations
Like any tool in a trader’s toolbox, the RSI is incredibly useful for certain jobs but completely wrong for others. Understanding its strengths and, more importantly, its weaknesses is critical for using it effectively and avoiding costly mistakes.
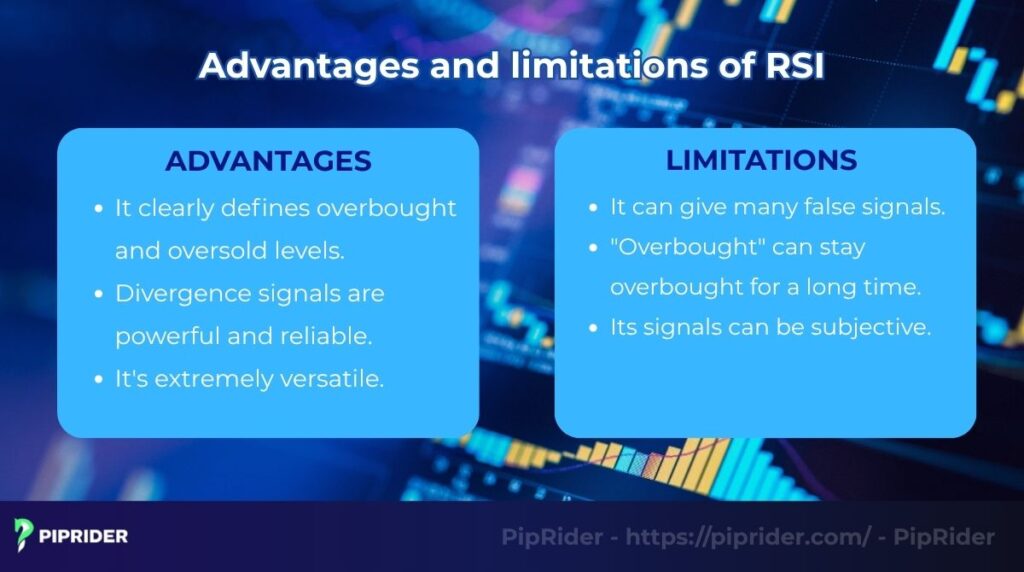
6.1. The advantages of the RSI
When used correctly, the RSI offers some clear and powerful benefits that have made it a favorite among traders for decades.
- Clarity in defining market extremes: The 0-100 scale with classic 70/30 thresholds provides an easy-to-read, objective gauge of overbought and oversold conditions, helping prevent you from chasing an overextended move.
- Reliability of signals: This is one of the most reliable early warning signals that a trend is losing momentum. Catching this pattern at a key price level is a true A+ trading setup.
- Extreme versatility: The RSI can be effectively applied to any financial market, including forex, stocks, and crypto, and it functions on all timeframes.
6.2. The limitations of the RSI
Now for the reality check. Believing the RSI Relative Strength Index is a foolproof, standalone system is a dangerous mindset. Here are its most significant weaknesses.
- Susceptibility to false signals: As a “leading” indicator that tries to predict reversals, it will inevitably be wrong at times. In a strong trend, it often gives a premature signal that gets ignored by the market, which is why it must be confirmed with other tools.
- The persistence of extreme conditions: This is the most important limitation to understand. In a powerful, runaway bullish trend, the RSI can remain in the overbought zone for a long time as the price continues to climb. Selling simply because the RSI is “high” is a classic beginner’s mistake.
- Subjective signal interpretation: While the 70/30 levels are fixed, interpreting a pattern can be subjective. What one trader sees as a clear signal, another might see as just a minor wiggle, which is why having a clear, rule-based definition for the signals you trade is so important.
7. RSI vs. MACD vs. Stochastic: Which indicator is better?
Debating which indicator is “best” (RSI, MACD, or Stochastic) is unproductive, as they are specialized tools designed for different jobs. Effective analysis depends on understanding the unique strengths of each tool. Using an indicator outside of its intended purpose leads to errors.
Traders should supplement these core tools with other analyses, like VWAP or Pivot Points, to add depth and confirmation, especially in ranging markets.
Here is a simple breakdown to help you quickly understand the role of each indicator.
| Feature | RSI (Relative Strength Index) | MACD | Stochastic Oscillator |
|---|---|---|---|
| Classification | Momentum Tool | Trend-Following Momentum | Oscillator Tool |
| What it measures | Speed and magnitude of recent price changes. | Relationship between two moving averages (Trend). | Current price vs. recent high-low range. |
| Scale | Fixed Range (0 to 100) | No Fixed Range | Fixed Range (0 to 100) |
| Primary signals | OB (70) / OS (30), Divergence. | Signal Line & Zero Line Crossovers. | OB (80) / OS (20), Crossovers. |
| Responsiveness | Balanced speed. | Slowest and most smooth. | Fastest and most sensitive. |
| Best used for | Spotting potential reversals and market extremes. | Confirming trend direction and strength. | Timing entries in ranging markets (sideways). |
| Recommendation | Go-to tool for general market health & divergence. | Primary tool for trend validation. | Preferred tool for short-term turning points. |
The key takeaway is this: you don’t need to choose just one. A powerful trading system often involves using two of these indicators together. For example, you might use the MACD to confirm the primary trend and then use the Stochastic to time your entry on a pullback.
8. Frequently asked questions (FAQs)
Here are some quick, no-nonsense answers to the questions I hear most frequently about the RSI.
9. Conclusion
The RSI Relative Strength Index is a timeless and essential tool for technical traders, providing a clear window into market momentum and health. Its primary value lies not as a standalone system, but as a confirmation tool.
The most reliable signals, whether from overbought/oversold levels or divergence patterns, are those that confirm existing price action at key market levels. Mastering the RSI is key to moving from reacting to price to confidently anticipating potential market turning points.
To continue your journey, explore more advanced trading strategies guides in our Learn Forex category right here on Piprider.


