
The quest for a reliable momentum indicator is often hampered by the noise inherent in classics like the standard Stochastic Oscillator, signals that flicker and mislead in choppy markets. Enter the Stochastic Momentum Index (SMI), the ingenious solution developed by William Blau. Designed to filter out market static, the SMI provides an uncluttered and precise view of true buying and selling pressure.
This comprehensive guide will equip you with everything you need: the detailed formula breakdown, a clear comparison to the Stochastic Oscillator, how to interpret the critical divergence and crossover signals, and advanced strategies to integrate the SMI into your trading system.
Key Takeaways
- The Stochastic Momentum Index is a powerful upgrade to standard momentum analysis, offering clearer signals for timing trades.
- Developed by William Blau to provide a less noisy, more responsive momentum measure than the traditional Stochastic Oscillator.
- The oscillator is scaled from −100 to +100. Values above 0 suggest the closing price is above the median range, and below 0 suggests it’s below.
- It uses double smoothing (typically EMAs) in its calculation, effectively filtering out market noise and reducing false swings.
- Look for extreme momentum levels (above +40 or below -40) and crucial setups for early price trend reversal alerts.
1. What Is Stochastic Momentum Index (SMI)?
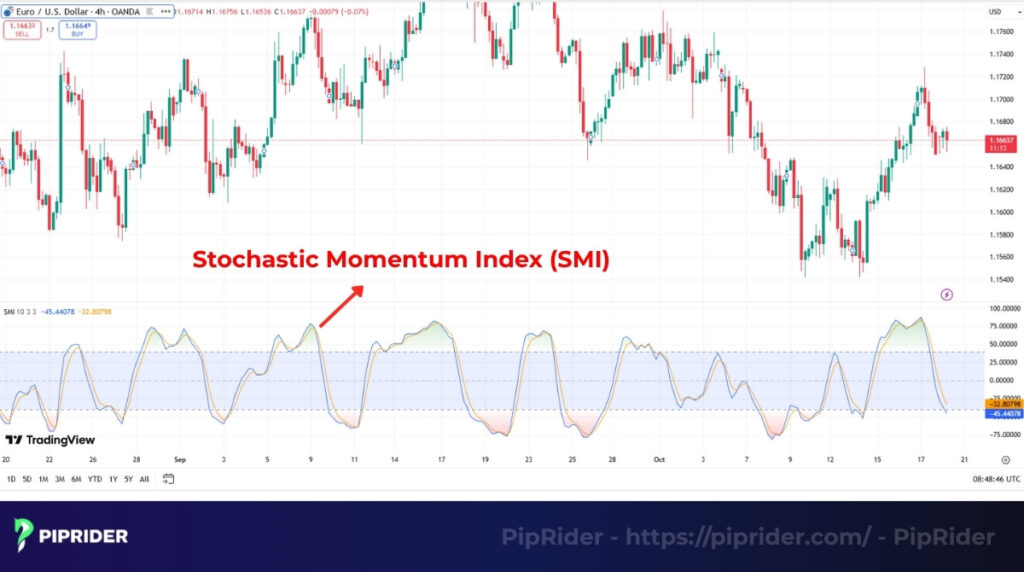
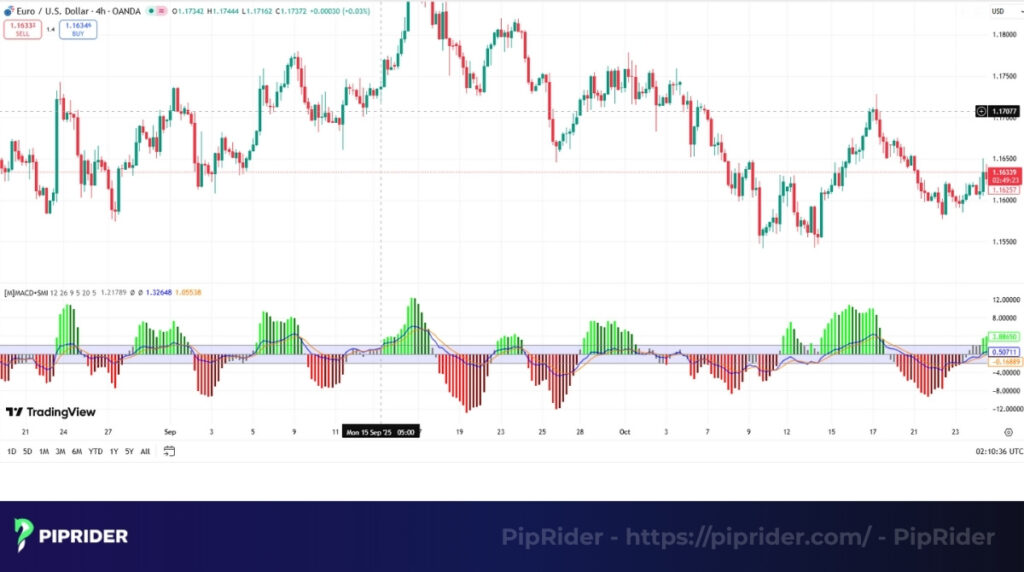
The Stochastic Momentum Index (SMI) is an advanced technical indicator designed to measure the true momentum of an asset price (Blau, 1993). It was developed by analyst and author William Blau and introduced in 1993 as a superior alternative to the widely used but often noisy traditional Stochastic Oscillator.
The SMI refines the standard Stochastic Oscillator primarily by changing its core reference point. Instead of measuring the closing price against the lowest low (standard Stochastic), the SMI compares the close to the median (midpoint) of the recent price range. This midpoint approach, enhanced by double smoothing, effectively filters out short-term market noise, providing a much smoother and more reliable view of market pressure (Investopedia, 2019).
The primary goal of the SMI is to provide a more accurate and stable measure of momentum strength based on the closing price’s position. By comparing the close to the median (midpoint) of the recent price range, the indicator filters out noise and smooths rapid fluctuations. Readings near zero signal market equilibrium, while extremes near +100 or −100 indicate powerful buying or selling momentum, respectively.
2. Understanding the Logic Behind SMI
The SMI’s smooth and precise signals stem from its core mechanism: it measures the current closing price’s position relative to the midpoint of the recent price range.
- Core measurement: SMI calculates how far the closing price is from the range’s median. If the close is above the median, market impetus is positive; if it’s below, market impetus is negative. This central reference point significantly reduces the noise common in other indicators.
- The −100 to +100 range: The SMI is scaled from −100 (extreme selling) to +100 (extreme buying). The Zero (0) line is the neutral point, signaling market equilibrium where the closing price perfectly matches the median of the range.
- Key signals: The SMI generates trading alerts by identifying extremes and shifts in momentum: market exhaustion zones (typically above +40 or below −40) and the crucial centerline crossover (crossing the zero line), which signals a complete reversal in direction.
Read more:
6 Essential Momentum Indicators Forex Traders Should Know
3. How to Calculate the Stochastic Momentum Index
The SMI’s smooth signal results from a multi-step process involving double smoothing of the price components. This procedure is designed to center the close price’s momentum around the median of the high-low range.
3.1. Formula Breakdown
The Stochastic Momentum Index calculation is rooted in these components, with the final line scaled to the −100 to +100 range
Step 1: Define the Lookback Window
Over a specific period of N periods (often referred to as the %K length), identify the Highest High (HH) and the Lowest Low (LL) (TradingView, n.d.)
Step 2: Determine the Midpoint
Calculate the median of this specific price window
Midpoint = (HH+ LL) / 2
Step 3: Calculate the Relative Range
Find the raw distance between the current Close price and the Midpoint
RelativeRange = Close − Midpoint
Step 4: Determine the Total Range
Calculate the total price range of the lookback window
Range = HH − LL
Step 5: Apply Double Smoothing
Apply two layers of Exponential Moving Average (EMA) to both the RelativeRange and the total Range over D periods. This acts as the noise filter
DoubleSmoothed(RelativeRange) = EMA(EMA(RelativeRange, D), D) DoubleSmoothed(Range) = EMA(EMA(Range, D), D)
Step 6: Calculate Final SMI
The final formula scales the double-smoothed relative range against the double-smoothed total range
SMI = 200 × [DoubleSmoothed(RelativeRange) / DoubleSmoothed(Range)]
(Note: This formula is mathematically equivalent to the alternative presentation: 100 × DS(RelativeRange) / (0.5 × DS(Range)).)
3.2. Example Calculation
To illustrate the relationship between the close price and the range, here is a simplified example of SMI calculation (note: this calculation bypasses the multi-period double-smoothing for clarity):
| Parameter | Value | Calculation Step | Result |
| Price Data | Window HH: 50.00 Window LL: 40.00 Close: 48.00 | N/A | N/A |
| Midpoint | (50.00 + 40.00) / 2 | Step 1 & 2: Median Price Range | 45.00 |
| Relative Range | 48.00 − 45.00 | Step 3: Distance from Midpoint | 3.00 |
| Range | 50.00 − 40.00 | Step 4: High-Low Range | 10.00 |
| SMI (Raw) | 200 × (3.00 / 10.00) | Step 5 & 6 (Simplified SMI) | +60.00 |
The resulting value of +60.00 tells a trader that the closing price is significantly above the range’s midpoint, indicating strong positive momentum.
The Role of Smoothing Periods
The two smoothing periods (e.g., the 5 and 5 in the standard 14,5,5 setting) are the key to customizing the SMI:
- Shorter periods (e.g., 3,3) make the indicator more reactive but noisier, suitable for scalping.
- Longer periods (e.g., 10,10) introduce lag but result in a much cleaner signal, ideal for swing trading where confirmation is critical.
4. How to Interpret SMI Readings
The SMI provides clear signals for momentum shifts and potential reversals based on its position and movement relative to key levels.
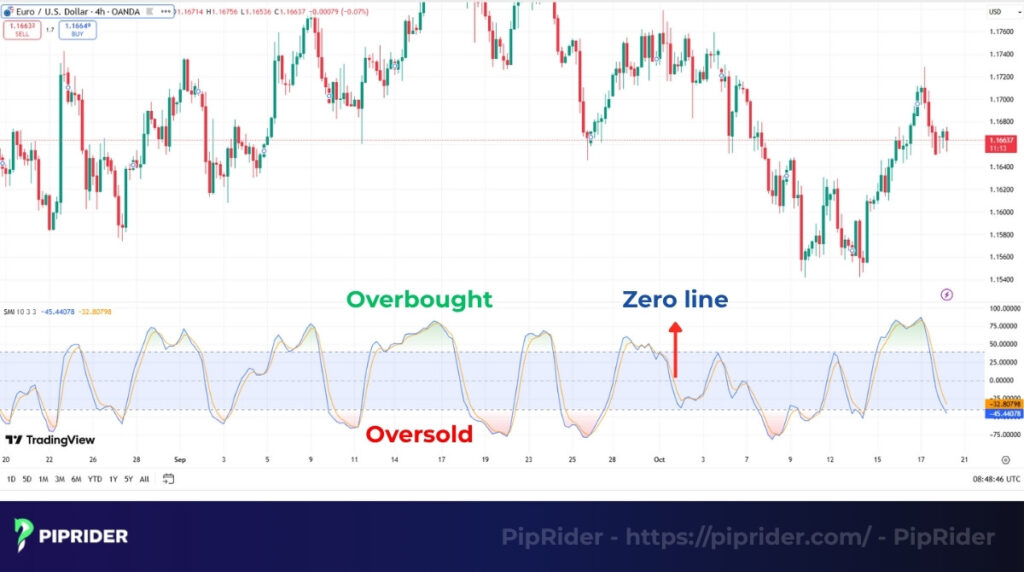
4.1. Overbought and Oversold Conditions
The SMI uses symmetrical extreme bands, typically +40 and −40, to identify unsustainable momentum (Worden Brothers, Inc., n.d.)
- Overbought: A reading above +40 suggests positive momentum is excessively strong, signaling a risk of a bearish correction.
- Oversold: A reading below −40 suggests negative momentum is excessively strong, signaling a risk of a bullish reversal.
4.2. Centerline Crossovers
The zero line (0) acts as the equilibrium point and a crucial signal of a market dominance shift.
- A cross above 0 confirms a shift from bearish to bullish market force (the close price has moved above the median).
- A cross below 0 confirms a shift from bullish to bearish market force (the close price has moved below the median).
4.3. Divergences
Divergence occurs when the price structure and the SMI line disagree, offering the most powerful early warning of a trend reversal.
- Detection: Look for the price making a new high/low that is not confirmed by the SMI. This signals that the underlying market pressure is fading.
- Confirmation: For high-probability trades, divergences should be confirmed by other tools, typically volume or the Relative Strength Index (RSI), to validate the weakness in the current price trend.
5. SMI vs. Traditional Stochastic Oscillator
The Stochastic Momentum Index (SMI) was designed to be a direct improvement on the traditional Stochastic Oscillator (invented by George Lane). While both are momentum oscillators, their differences in calculation directly impact signal quality and application, which is crucial for advanced traders choosing their tools.
| Aspect | Stochastic Momentum Index (SMI) | Traditional Stochastic Oscillator |
| Range | −100 to +100. Symmetrical range centered at 0. | 0 to 100. A single-polarity range. |
| Basis | Measures the closing price’s position relative to the median (midpoint) of the high-low range. | Measures the closing price’s position relative to the lowest low of the period. |
| Smoothing | Double-smoothed (typically using two EMAs). | Single-smoothed (using the %K line and its moving average %D line). |
| Signal Noise | Lower (smoother). Provides a smoother, less noisy signal that reacts more accurately to changes in underlying market force. | Higher (reactive). Highly reactive to price movements, often generating false signals (noise), especially in choppy markets. |
| Best For | Sideways, range-bound markets, and identifying early reversals with greater reliability. | Volatile trends, where reactivity is prioritized, though often requiring stricter confirmation. |
6. How to Use the Stochastic Momentum Index in Trading
The SMI moves beyond basic overbought/oversold readings to offer precise timing signals, particularly effective in range-bound markets.
6.1. Signal Line Cross Strategy
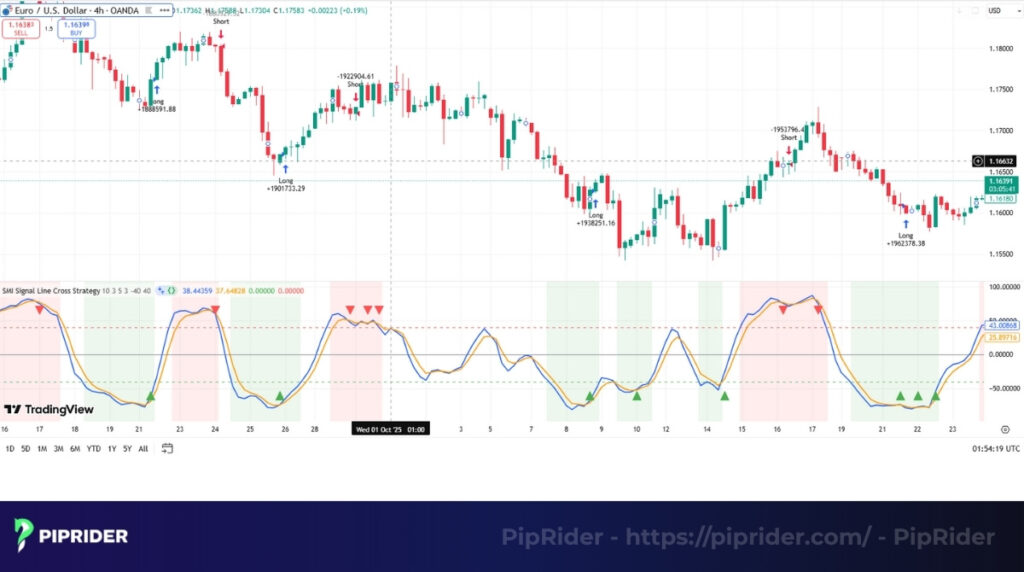
This strategy uses the SMI’s Signal Line (a moving average of the SMI) to confirm momentum shifts, reducing market noise (Charles Schwab & Co., Inc., n.d.)
- Buy: Enter long when the SMI cuts above its line while emerging from the oversold region (below −40).
- Sell: Enter short when the SMI cuts below its line while emerging from the overbought region (above +40).
6.2. Centerline Momentum Reversal
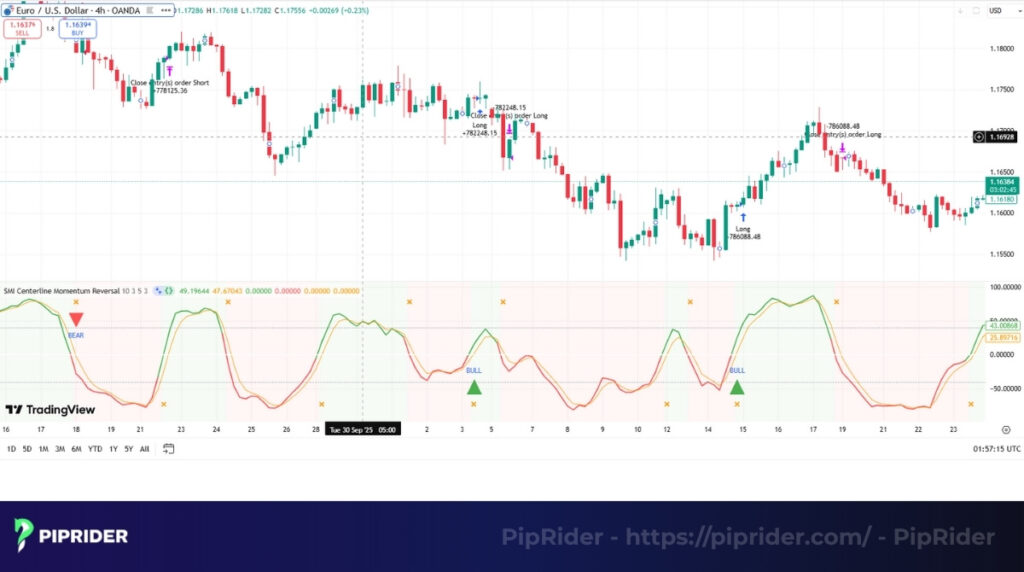
The zero line (0) is used to confirm the dominant force in the market.
- A cross above 0 confirms a shift to bullish momentum (close price is above the median).
- A cross below 0 confirms a shift to bearish momentum (close price is below the median).
Application: Use the 0 cross to validate new trends or confirm reversal trades.
6.3. Divergence Setup

Divergence provides the highest-probability reversal signal, warning that the current trend’s force is weakening.
- Detection: Price makes a new high/low that is not confirmed by a corresponding new high/low on the SMI.
- Action: This is an early alert. Time the trade when the SMI confirms the reversal (e.g., crossing its trigger line).
6.4. Example Trade Setup (Playbooks)
To avoid taking mechanical entries, use these structured playbooks that include filters and invalidation criteria for high-probability setups.
Playbook A — Divergence + Confirmation (Reversal)
- Context: Price is testing a Higher Timeframe (HTF) support or resistance level.
- Trigger: Divergence forms between price and the SMI, followed by the SMI crossing its signal line.
- Entry: Enter on a confirming candle close or a minor structural break.
- Stop Loss (SL): Placed safely below the swing low (for longs) or above the swing high (for shorts).
- Take Profit (TP): Target the next major structural level (avoid generic targets like “R1”).
- Invalidation: The trade setup is invalidated if price breaks the swing point in the opposite direction
Playbook B — 0-Line as a Bias Filter (Trend Continuation)
- Bias: Only look for long setups when SMI > 0; only look for short setups when SMI < 0.
- Entry: Wait for a price pullback, then enter when the SMI and its signal line cross in the same direction as your bias.
- SL / TP: Set based on recent market structure, ensuring your minimum Risk-to-Reward (RR) parameters are met.
7. Combining the SMI with Other Indicators
While the Stochastic Momentum Index is a powerful technical indicator on its own, its effectiveness and signal reliability are dramatically improved when used as a confirmation tool alongside other indicators. Combining different types of analysis, momentum, trend, and volume helps filter out low-probability trades.
- SMI + RSI (Dual Momentum Confirmation): Use the Relative Strength Index (RSI) to confirm the intensity of momentum. If both oscillators signal overbought/oversold or a divergence at the same time, the reversal signal has high conviction.
- SMI + MACD (Trend Filtering): Use the Moving Average Convergence Divergence (MACD) to filter out noise. Only take SMI reversal or crossover signals that align with the established trend direction confirmed by the MACD histogram or signal line.
- SMI + MFI/Volume (Signal Validation): Validate SMI reversal signals by looking at the Money Flow Index (MFI) or trading volume. Use MFI/volume to confirm participation when volume data is reliable. In spot FX, use volume as supportive evidence only, as it acts as a proxy (tick volume) rather than definitive proof of institutional participation.
- SMI + Moving Average (False Breakout Prevention): Use a longer-term Moving Average (e.g., EMA 50 or 200) to define the primary trend. This helps prevent false breakouts by avoiding counter-trend SMI signals unless the price has clearly broken and retested the key Moving Average level.
8. Best Settings and Market Conditions
Optimizing the SMI involves understanding the impact of its three main parameters on signal quality and matching them to your trading horizon.
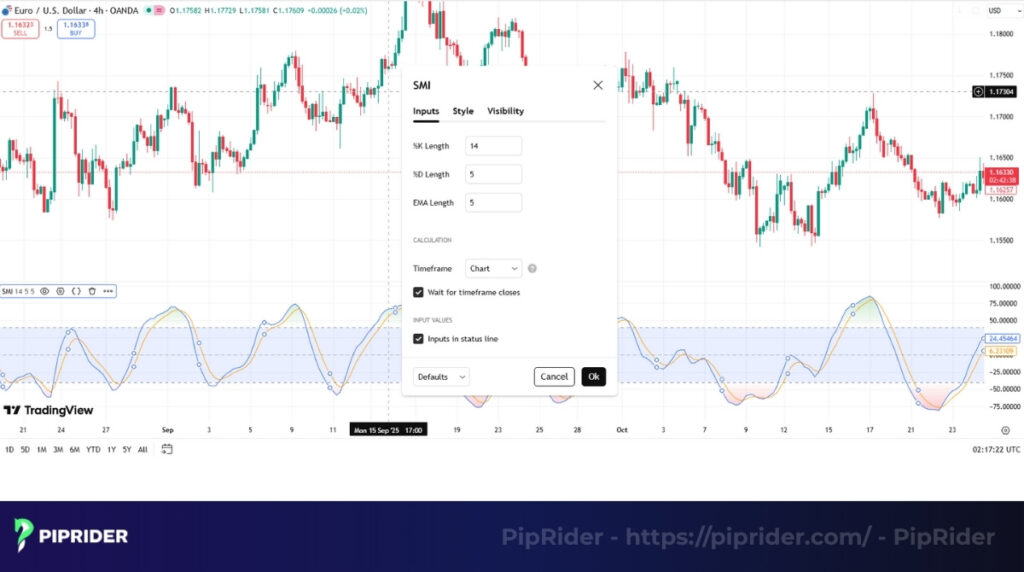
Default settings vary by platform: While older trading literature often cites (14,5,5) as a traditional standard, using a 14-period look-back for the range and 5 periods for two layers of smoothing, defaults today differ significantly depending on the charting platform you use, such as TradingView (TradingView, n.d.) or Thinkorswim (Charles Schwab & Co., Inc., n.d.). Always verify your inputs to ensure they align with your strategy.
Mapping SMI Default Inputs Across Platforms:
| Platform | Lookback (%K Length) | Smoothing / Signal Line Inputs |
| Piprider (Traditional) | 14 | Smoothing 1: 5, Smoothing 2: 5 |
| TradingView | 10 | %D Length: 3, EMA Length: 10 |
| Thinkorswim | 10 | Smoothing 1: 3, Smoothing 2: 3 |
Customization by trading style: The lookback and smoothing periods must be adjusted based on your trade frequency:
- Scalping/Day trading: Use shorter periods (e.g., lookback 9, smoothing 3, 3) for higher sensitivity and quicker signals.
- Swing/Position trading: Use longer periods (e.g., lookback 20, smoothing 10, 10) for a smoother signal and less noise, prioritizing confirmation over speed.
Optimal market condition: The SMI performs best in sideways, range-bound, or consolidating markets. Its signals are less reliable when a market is heavily trending, as it may stay stuck in an extreme zone for prolonged periods.
9. Advantages and Limitations of the SMI
The SMI offers clear benefits over the traditional Stochastic Oscillator, but traders must manage its limitations in specific market conditions.
9.1. Advantages
The SMI’s calculation methodology provides several key benefits for serious traders:
- Cleaner signals: The double-smoothing technique significantly reduces market noise and eliminates most false swings (whipsaws).
- Clear reversals: The −100 to +100 range and midpoint basis make it easier to pinpoint the exact moment momentum shifts (centerline crossovers).
- Versatile: Performs reliably across multiple timeframes when customized with appropriate smoothing periods.
9.2. Limitations
Traders must be aware of the SMI’s weaknesses to manage risk effectively:
- High lag in strong trends: The smoothing can cause the indicator to lag significantly in sustained trends, leading to missed continuation entries or late reversal signals.
- Requires volume: SMI is price-based. Signals degrade in illiquid conditions (wide spreads, erratic prints). Use volume confirmation when reliable volume exists (stocks/futures). In spot FX, treat volume as a proxy and prioritize structure + confirmation.
10. Common Mistakes When Using SMI
To maximize the SMI’s effectiveness, traders must avoid these frequent errors that lead to poor execution and unnecessary losses.
- Trading based solely on crosses: Relying only on the SMI/Signal Line cross or the 0 centerline cross without external confirmation (e.g., price action, volume, or support/resistance) significantly increases the risk of whipsaws.
- Ignoring the larger trend: Taking counter-trend signals from the SMI is risky. Always use a higher-timeframe analysis or a long-term Moving Average to confirm the directional bias before executing any SMI signal.
- Using overly short periods: Setting the smoothing parameters too low (e.g., 5, 2, 2) makes the SMI overly sensitive to noise, resulting in excessive whipsaws and signal fatigue, which defeats the indicator’s purpose of being smooth.
11. Practical Applications and Example Strategy
The true power of the SMI lies in its integration with trend and momentum indicators, creating robust, systematic strategies for different market styles.
- SMI + RSI Divergence (High-Conviction Swing Trading): This is the strongest reversal setup. Use SMI divergence as the primary alert for trend exhaustion and RSI divergence as the secondary filter. Executing only when both oscillators confirm the weakening momentum provides a high-probability swing trade entry.
- SMI + EMA 20/50 (Trend-Following Signals): Use a shorter EMA (e.g., 20 or 50) to define the dominant trend’s direction. Only take SMI centerline crossover signals that align with the EMA direction (e.g., only buy when the price is above EMA 50). This strategy effectively filters counter-trend noise.
- Backtesting for Optimal Results: SMI tends to work better in liquid markets; validate with your own backtests to confirm its effectiveness for predicting reversals and continuations within established ranges for your specific chosen assets.
12. SMI vs. RSI vs. MACD: Quick Comparison
Selecting the right indicator often comes down to understanding what each tool is designed to measure. Here is a quick comparison of the SMI against two other classics, the RSI and the MACD.
| Feature | SMI (Stochastic Momentum Index) | RSI | MACD |
| Input | Price + Median Range (Double Smoothed) | Price only (Smoothed) | Moving Averages (EMA) |
| Type | Momentum Oscillator | Momentum Oscillator | Trend + Momentum |
| Strength | Detects subtle momentum shifts and reduces noise. | Simpler signal for overbought/oversold levels. | Confirms trend direction and strength. |
| Ideal Use | Sideways/Range-Bound Markets, Reversal Setups | Overbought/Oversold Identification, Divergence | Trend Continuation and Crossovers |
13. Frequently asked questions about Stochastic Momentum Index
Here are quick answers to the most common questions traders have about implementing the Stochastic Momentum Index (SMI).
14. Conclusion
The Stochastic Momentum Index (SMI) is a powerful upgrade, offering a smoother, cleaner signal than the traditional Stochastic Oscillator. The SMI excels at identifying momentum shifts and confirming reversal setups in range-bound markets due to its double smoothing and midpoint reference. Remember: the SMI is a confirmation technical indicator, not a forecast. Always combine its signals with trend and volume analysis to reduce risk.
To further elevate your trading knowledge and ensure you are using the best platforms for applying the SMI and other advanced indicators, be sure to explore the comprehensive Broker Reviews section on Piprider for the latest insights.