In trading, not all price levels are created equal. The Volume Weighted Average Price indicator (VWAP) is a technical analysis tool that reveals the “true” average price of a security by taking into account the volume traded at each price level. Used by both retail day traders and large institutions, it acts as a benchmark to determine if the current market price is fair, overvalued, or undervalued for the day.
This guide will cover everything from the definition and formula to practical trading strategies.
Key Takeaways
- VWAP finds an asset’s average price, giving more weight to levels with higher trading volume.
- It helps traders see if the current price is cheap (below VWAP) or expensive (above VWAP) for the day.
- The VWAP line often acts as a key level of support during uptrends and resistance during downtrends.
- Because it resets daily, VWAP is a tool specifically designed for day traders.
- Its signals are most reliable when combined with price action or other indicators like the RSI.
1. What Is Volume Weighted Average Price (VWAP)?
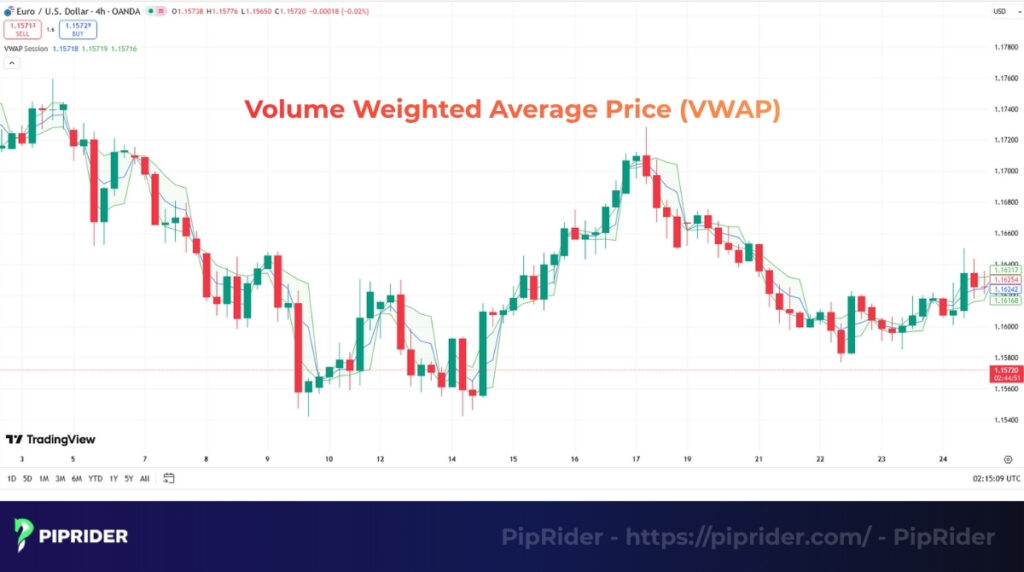
The Volume-Weighted Average Price (VWAP) is a technical analysis indicator that calculates the true average price of an asset over a single trading day, based on both price and volume. Its primary purpose is to give traders a benchmark for the day’s “fair value”. By anchoring the average price to the volume, it gives more weight to price levels where significant buying activity or selling activity occurred.
In practice, the VWAP line helps traders quickly assess the current market sentiment.
- When the price is trading above the VWAP, it’s generally considered bullish, suggesting the asset is “expensive” relative to the day’s average.
- When the price is below the VWAP, it’s considered bearish, suggesting the asset is “cheap.”
Because of its focus on intraday price and volume, it’s a critical tool for both retail day traders and institutional investors looking to execute large orders with minimal market impact.
2. How to Calculate VWAP
The VWAP calculation is a cumulative, multi-step process that happens in the background on your charting platform. It continuously updates throughout the day, providing a real-time average price weighted by volume.
2.1. VWAP Formula
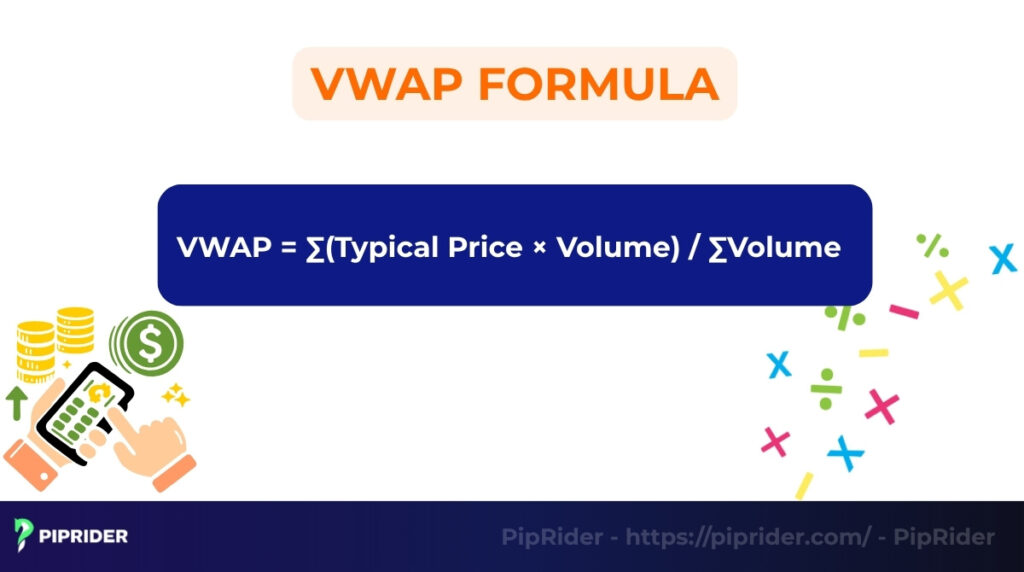
The formula for the Volume Weighted Average Price indicator is:
Where:
- Typical Price: The average price of a trading period.
- Volume: The number of shares or contracts traded during that same period.
- Σ (Sigma): This symbol signifies that the values are cumulative, meaning they are summed up from the start of the trading session.
2.2. Step-by-Step Calculation
Here’s a simplified breakdown of how the indicator is calculated from the start of the trading day:
1. Calculate the Typical Price for each period. For every candle (e.g., a 5-minute candle), it is calculated using this formula:
2. Multiply by Volume. This Typical Price is then multiplied by the volume that was traded during that same period to get the period’s volume-weighted price.
3. Keep a Cumulative Total. The indicator maintains two running totals from the start of the session: the cumulative Price × Volume value and the total volume traded.
4. Calculate the VWAP. The final VWAP is the ratio of the cumulative Price × Volume total to the cumulative volume total.
Crucially, the VWAP calculation resets at the start of each new trading day. This is why it is strictly an intraday indicator best viewed on intraday charts and cannot be used on daily or weekly charts like a standard moving average.
3. How to Use the VWAP Indicator in Trading
The VWAP functions as a real-time gauge of institutional consensus, distinguishing between “fair market value” and emotional price extremes. By incorporating volume, it provides a more accurate “line in the sand” for intraday sentiment than standard price-only indicators.
3.1. Establishing the Intraday Market Bias
Determining the market regime is the most fundamental use of the VWAP. It acts as a definitive filter for choosing which side of the market to trade, reducing the risk of fighting institutional momentum.
- Bullish Bias: When price sustains trade above the VWAP (closing and holding for multiple candles), it signals that the average participant is in profit. In this environment, traders prioritize long setups, treating the VWAP as the baseline for bullish conviction.
- Bearish Bias: When price sustains trade below the VWAP, it indicates that the average buyer is currently “underwater” (in a loss). This confirms seller dominance, and traders should focus exclusively on short opportunities.
- Neutral/Chop: If the price frequently crosses the VWAP line with no sustained follow-through, the market is in a “mean-reverting” or range-bound state, signaling caution for trend-followers.
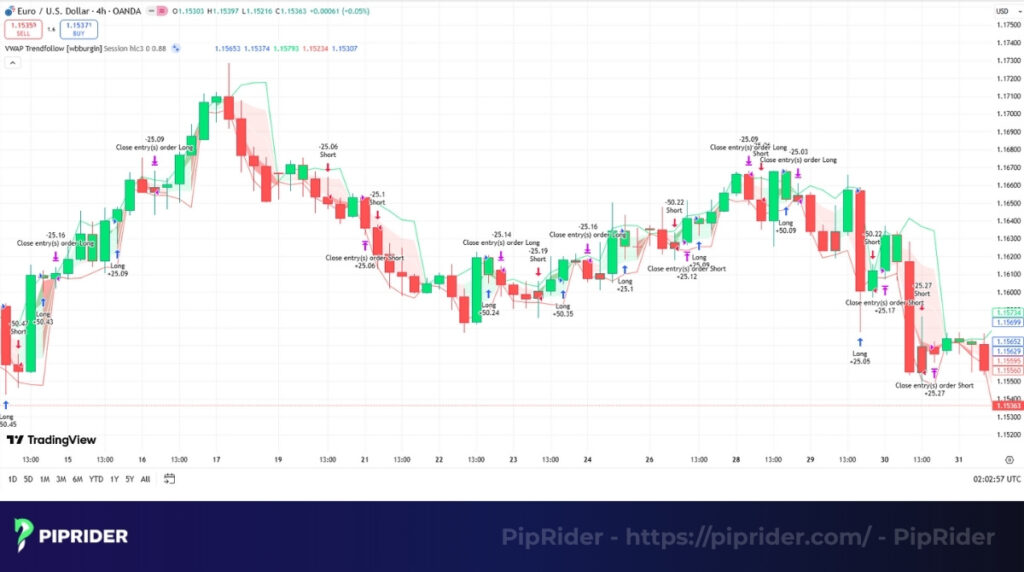
3.2. VWAP as a Dynamic Liquidity Zone (Support & Resistance)
Because the VWAP represents the “Center of Gravity” where the highest volume has transacted, it naturally acts as a zone of high liquidity. Unlike static support lines, the VWAP evolves with every tick, making it a “dynamic” level of interest.
- Institutional Floor (Uptrend): In a healthy uptrend, institutions often use pullbacks to the VWAP to add to their positions. This creates a strong dynamic support level where “Smart Money” re-accumulates.
- Institutional Ceiling (Downtrend): During bearish regimes, the VWAP acts as a primary resistance level. It is the zone where sellers re-emerge to defend the day’s average price, capping any relief rallies.
3.3. Benchmarking Execution Quality (Wholesale vs. Retail)
For institutional players, the goal is “Efficient Execution.” They use the VWAP to ensure they aren’t moving the market against themselves or buying at unfavorable price extremes.
- Wholesale Pricing: Buying at or below the VWAP is considered “Wholesale” (good value). It means you are entering at a price better than or equal to the day’s volume-weighted average.
- Retail Pricing: Buying far above the VWAP is considered “Retail” (expensive). Entering here puts the trader at risk of a “mean reversion” move, where the price snaps back to the average, often hitting poorly placed stop-losses.
- Execution Benchmark: Retail traders should adopt this institutional mindset: Avoid “chasing” the move. Instead, wait for the price to return to the area of high-interest value (the VWAP) before executing a trade.
4. VWAP vs. Simple Moving Average (SMA)
Both the VWAP and a Simple Moving Average (SMA) appear as single lines on a chart and measure an average price. However, they are fundamentally different tools designed for different purposes. The key distinction is that VWAP incorporates volume into its calculation, while an SMA only considers price.
This difference leads to distinct characteristics and uses for each indicator.
| Aspect | Volume-Weighted Average Price (VWAP) | Simple Moving Average (SMA) |
|---|---|---|
| Input Data | Based on both Price and Volume. | Based on Price only. |
| Update Mechanism | Resets at the start of each new trading day. | A continuous, rolling calculation. |
| Main Goal | To measure intraday “fair value”. | To smooth out the long-term trend. |
| Signal Type | Highly responsive to volume spikes. | Smoother and slower to react. |
| When to Use | Day Trading & Execution. | Swing Trading & Trend Following. |
| Best For | Pinpointing entries in volatile intraday sessions. | Identifying the primary direction on Daily/Weekly charts. |
In short, VWAP is a specialized instrument for day traders to pinpoint where the day’s business is conducted. In contrast, the SMA is a more versatile indicator used across all trading styles to gauge the long-term trend.
5. Professional VWAP Trading Strategies (The Execution Blueprint)
Successful VWAP execution requires a deep understanding of intraday liquidity. Instead of chasing lines, professional traders look for areas where institutional “fair value” aligns with price structure.
Expert Note: These strategies perform best on 5-minute and 15-minute charts. Always prioritize setups during the London or New York open, as high liquidity during these sessions makes the VWAP a more reliable benchmark.
5.1. VWAP Breakout Strategy (Capturing Momentum Ignition)
Momentum ignition occurs when the market shifts from a low-volatility “coil” into a decisive directional move, often driven by institutional news or session openings.
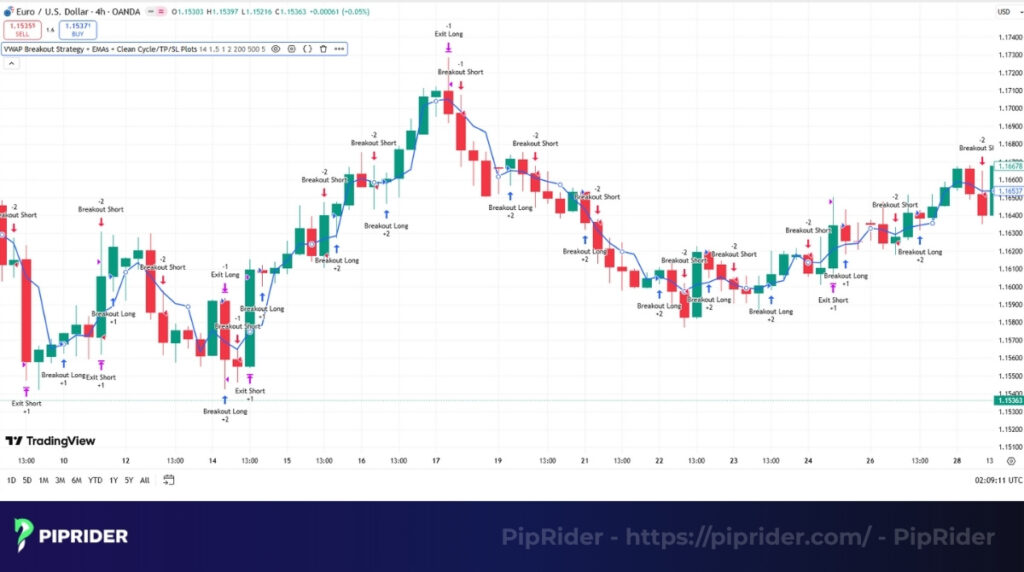
- The Setup: Identify a “Squeeze” where the price has been hugging the VWAP for at least 30-60 minutes in a tight range.
- The Trigger: Enter on a Decisive Body Close above/below the VWAP. The candle must exhibit a “Range Expansion”, its body should be significantly larger than the previous five candles.
- Confirmation (Forex Focus): Verify the move with volatility expansion (ATR). Because the spot FX market is decentralized, brokers use tick volume as a proxy for actual liquidity (OANDA, n.d.). Therefore, a breakout without a corresponding ATR spike is highly susceptible to being a “bull trap” or “bear trap.”
- Stop Loss: Place below the VWAP line + a 2-pip buffer (to account for spread).
- Exit Strategy: Target the next major liquidity level (previous day’s high/low). Maintain a minimum 1:2 Risk-to-Reward ratio.
5.2. VWAP Pullback Strategy (Institutional Trend Following)
Trend following near the VWAP offers the highest probability of success by treating the indicator as an “Institutional Floor” for re-accumulation or distribution.
- The Setup: Establish that a trend is in play (Price has stayed above/below VWAP for over an hour).
- The Trigger: Wait for a “Mean Reversion” back to the VWAP. Enter only after a rejection candle (Pin Bar or Engulfing) touches the line and closes.
- Stop Loss: Position the stop beyond the most recent Structural Swing Low/High. Avoid “tight stops” directly on the VWAP; institutional “stop hunting” often dips slightly past the line before the trend resumes.
- Exit Strategy: Target the recent trend extreme. Close 50% of the position to secure profit and trail the remaining half using the VWAP line as a trailing stop.
5.3. VWAP Mean Reversion (Trading the Rubber Band)
Mean reversion profits from price exhaustion. It operates on the principle that price, like a rubber band, can only stretch so far from its “Volume-Weighted Center” before snapping back.
- The Setup: Only execute this during Sideways/Range Days. If the ADX (Trend Strength) is above 25, discard this strategy immediately.
- The Trigger: Price reaches an extreme distance from the VWAP (Overextended) + RSI Overbought/Oversold (>70/<30).
- Stop Loss: Place 3-5 pips beyond the “Exhaustion Wick” of the reversal candle.
- Exit Strategy: The VWAP line is the Mandatory Exit. Do not “hope” for the price to cross to the other side; the VWAP is the point of equilibrium where momentum often dies.
- Danger Warning: This is the most dangerous VWAP setup. Never fight a “Trend Day” (e.g., NFP Friday). High-momentum markets will stay overextended for the entire day, wiping out counter-trend traders.
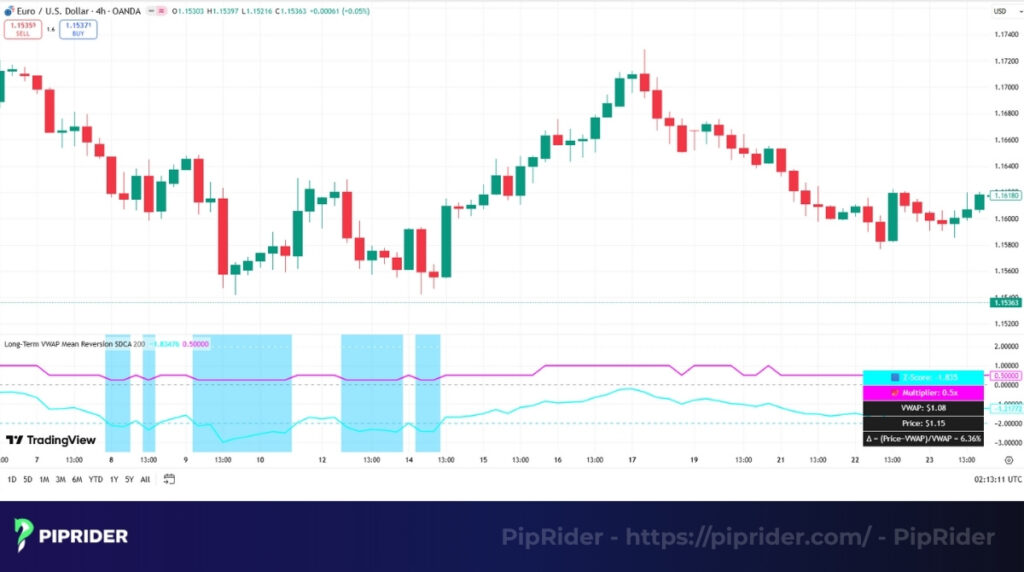
6. Advanced VWAP Variants: Scaling Beyond Intraday
Professional traders utilize advanced VWAP variants to bridge the gap between short-term liquidity and long-term market structure. These tools solve the primary limitation of the standard VWAP—the daily reset—allowing for a continuous view of institutional “fair value” over weeks or even months.
6.1. Anchored VWAP (AVWAP): Pinpointing Trend Conviction
The Anchored VWAP (AVWAP) serves as a surgical tool for trend analysis, enabling you to measure the market’s center of gravity from any significant turning point. Unlike the standard version, you manually select the starting candle to align the calculation with a specific shift in market psychology.
- Logic: By anchoring the indicator to a major catalyst, such as an NFP release, a Central Bank rate decision, or a structural Swing High you see the average price paid by every market participant since that event.
- Execution: If the price remains above the AVWAP anchored to a major bottom, it confirms that the “Smart Money” from that event is still in profit and likely to defend that level.
6.2. Multi-Day & Rolling VWAP: Identifying Institutional Accumulation
Multi-Day and Rolling VWAP variants eliminate the noise of daily resets by maintaining a continuous, cumulative calculation over extended periods (e.g., 5-day or 20-day). This provides a macro view of where the average institutional position is built.
- Logic: Institutional players rarely complete their orders in a single session. A Weekly VWAP acts as a “Market Regime” filter; trading above it signals a decisively bullish environment, while trading below it suggests a heavy distribution phase.
- Expert Tip: Use the Multi-Day VWAP on 1-hour charts to identify zones of “Institutional Value” that simple 200-period moving averages often fail to detect.
7. How to Add VWAP and Anchored VWAP on TradingView
TradingView provides the most robust official support for volume-weighted tools, making it the preferred platform for institutional-grade analysis. The configuration steps below align with the official documentation to ensure your charts accurately reflect global liquidity data (TradingView, n.d.).
7.1. Implementing the Standard VWAP for Intraday Analysis
Configuring the standard VWAP requires a precise “Anchor Period” setting to ensure the data accurately reflects the current trading session’s start.
- Open Indicators: Press
/on your keyboard and search for “VWAP” (built-in version by TradingView). - Adjust Inputs: Open the settings “Gear” icon. Under the “Inputs” tab, verify that “Anchor Period” is set to “Session.” This ensures the calculation resets exactly at the market open.
- Refine Style: In the “Style” tab, most professionals uncheck “Upper Band” and “Lower Band.” Keeping the chart clean allows you to focus solely on the central VWAP “fair value” line.
7.2. Using the Anchored VWAP (AVWAP) Tools
TradingView offers two distinct ways to apply the Anchored VWAP, giving you the flexibility to measure conviction from any historical price peak or news catalyst.
- The Toolbar Method: Navigate to the left-hand sidebar. Click on the “Prediction and Measurement Tools” group (the icon that looks like a Long Position tool). Scroll down to find “Anchored VWAP.” Click on the specific candle where you want the calculation to begin.
- The Right-Click Shortcut: For the fastest execution, simply right-click on any significant candle (like an NFP spike or a Swing Low) and select “Add Anchored VWAP.”
Pro Tip: If the AVWAP line appears “choppy,” ensure you are on a lower timeframe (like 5m or 15m) to see the granular volume distribution more clearly.
8. Limitations of VWAP: Avoiding the Trading Traps
While the VWAP is a powerful institutional benchmark, it is not a “holy grail.” Understanding its structural weaknesses is essential to avoid false signals and capital depletion during abnormal market conditions.
- The Lagging Factor: Like all averages, the VWAP is a reactive tool, not a predictive one. Since it relies on cumulative historical data, the line becomes more “heavy” and slower to react as the trading session progresses. Early morning signals are often more sensitive than those in the late afternoon.
- Liquidity Gaps (Low-Volume Markets): In thinly traded assets or exotic Forex pairs, the VWAP can become highly erratic. Without significant trading volume to anchor the average, the indicator loses its “fair value” authority and can produce multiple false crossovers.
- Volatility Distortion (The News Spike): Extreme price shocks, such as an NFP release or an unexpected interest rate hike can create a “Volume Spike” that skews the VWAP for the rest of the day. If a single 5-minute candle contains 40% of the day’s volume, the VWAP will stay “pinned” near that price, rendering it less effective for the remaining hours.
- Strict Intraday Constraint: Because the standard calculation resets every 24 hours, it is structurally incapable of accounting for multi-day trends. Attempting to use a standard VWAP on a Daily chart is a technical error; for swing trading, the Anchored VWAP is the only viable alternative.
- The Need for Confluence: The VWAP is a benchmark of value, not a complete trading system. A price cross is merely an invitation to look closer, not a signal to enter. Reliable execution requires confirmation from price action (candlestick patterns) or momentum oscillators like the RSI to filter out “fakeouts.”
9. Frequently asked questions about Volume Weighted Average Price Indicator
10. The Bottom Line
The Volume Weighted Average Price indicator (VWAP) is an essential tool for day traders. It offers a clear benchmark to assess whether the current price is cheap or expensive relative to the day’s trading activity. While it excels in intraday analysis, its signals are most powerful when confirmed with tools like the Volume Profile, RSI, or MACD.
To avoid false signals, traders should always use the VWAP in the context of the broader trend. For more in-depth guides on essential trading tools, explore our comprehensive Technical Indicators List and elevate your trading edge with PipRider.