
In the world of technical analysis, the Ascending Triangle Chart Pattern is widely regarded as one of the most reliable continuation signals in a bull market. This formation occurs when buyers consistently push prices higher, creating higher lows against a static resistance level.
This comprehensive guide will equip you with the skills to accurately identify this powerful setup, filter out false breakouts, and execute high-probability trades with precision.
Key Takeaways
- The Ascending Triangle is a bullish continuation pattern that typically forms during an established uptrend.
- A horizontal resistance line combined with rising higher lows indicates that buyer strength is aggressively absorbing selling pressure.
- A valid breakout requires a significant surge in volume, confirming that institutional money is fueling the move.
- The standard profit target is calculated by measuring the vertical height of the triangle and projecting it upward from the breakout point.
- This pattern is effective across all liquid markets, including Forex, Crypto, Stocks, and Indices.
1. What Is an Ascending Triangle Chart Pattern?
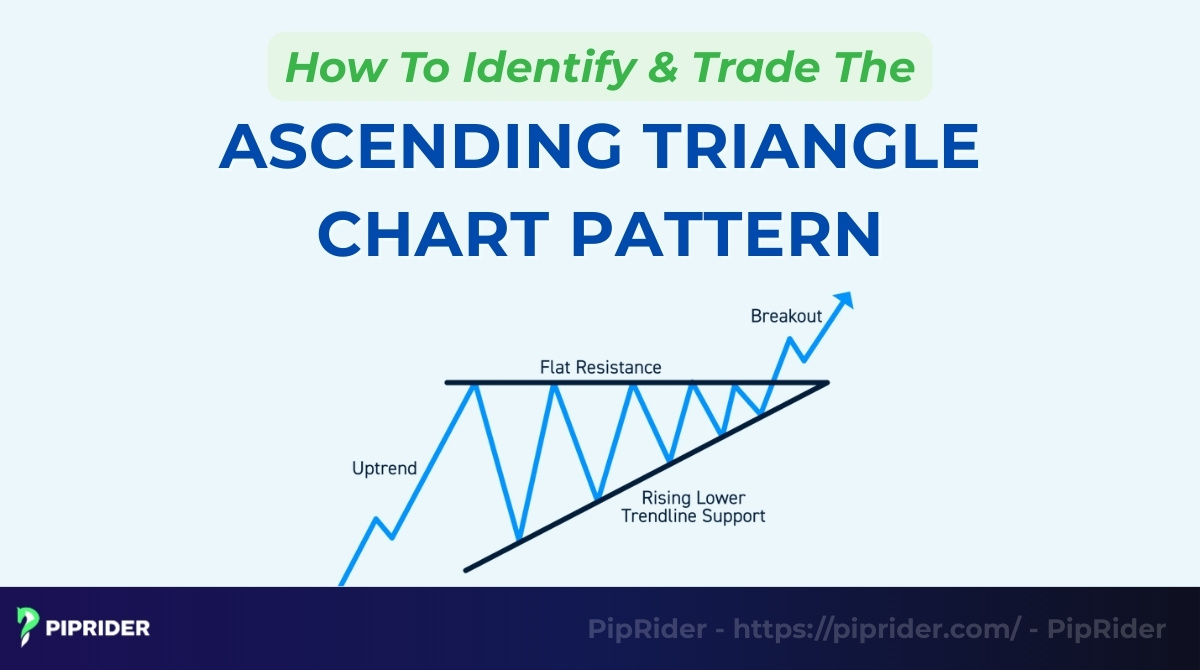
The Ascending Triangle is a bullish chart pattern defined by a flat, horizontal resistance line and a rising support trendline formed by a series of higher lows. According to the Corporate Finance Institute (CFI), this formation signals significant buying pressure, where buyers are aggressive enough to create higher lows while sellers hold a fixed price ceiling (CFI Team, n.d.).
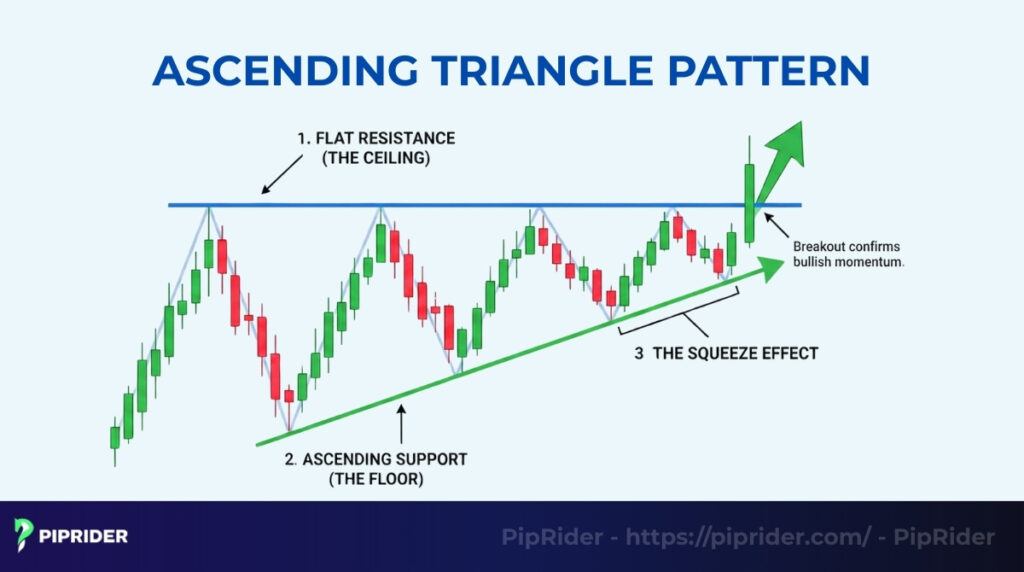
To confirm a valid pattern, you must identify two converging trendlines that create a “squeeze” effect:
- Flat Resistance (The Ceiling): Price hits a specific high level multiple times but fails to break it, creating a horizontal line of resistance where sellers are active.
- Ascending Support (The Floor): Crucially, the price creates a series of higher lows, visually forming rising troughs. This proves that buyers are impatient, stepping in at higher prices during each dip.
1.1. Why Is an Ascending Triangle a Bullish Signal?
It is considered a reliable bullish pattern because it visualizes a specific market battle known as “Supply Absorption”.
- The Mechanism: Sellers are trying to defend the resistance level. However, buyers keep attacking this level without letting the price drop back to previous lows.
- The Result: Eventually, the supply of sell orders at the resistance level dries up. Once the sellers are exhausted, the price has nowhere to go but up, triggering an explosive breakout.
1.2. Where Does the Ascending Triangle Appear?
This pattern relies on human psychology, making it effective across all liquid markets:
- Stock Market: Common during accumulation phases before earnings reports.
- Crypto: Highly reliable in Bitcoin/Ethereum during consolidation periods before a pump.
- Forex: Frequently seen on intraday charts (15m, 1H) in pairs like USD/JPY.
2. Structure of a Valid Ascending Triangle
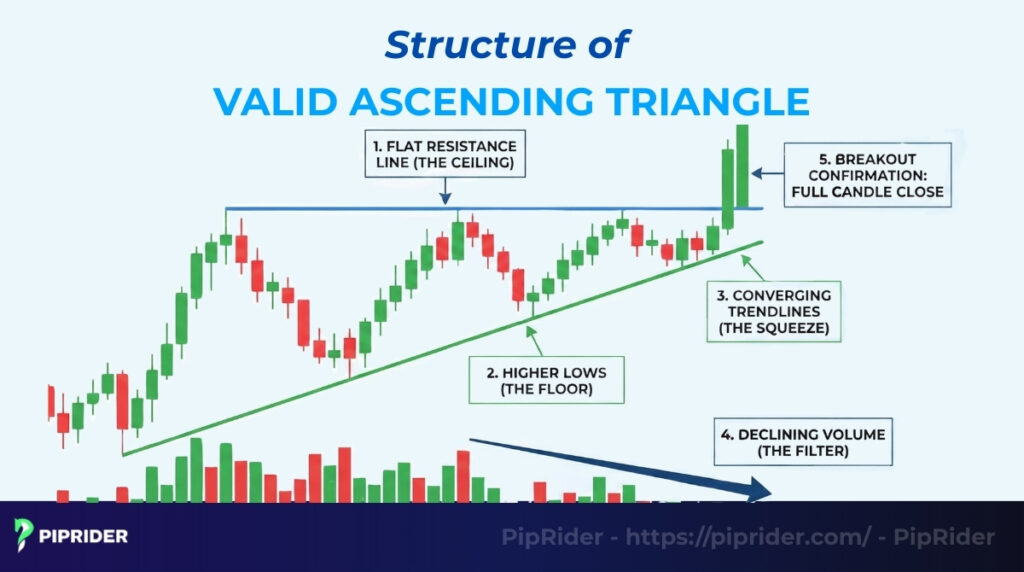
To distinguish a high-probability setup from random noise, confirm these five structural elements before trading.
- Flat Resistance Line (The Ceiling): The upper trendline must be horizontal, connecting at least two swing highs. This horizontal line represents a fixed supply zone where sellers are absorbing demand. Slight deviations are acceptable, but significant slopes invalidate the pattern.
- Higher Lows (The Floor): The lower trend line connects a sequence of higher lows. This rising slope is the key signal of buyer aggression. It proves they are paying a premium to enter early rather than waiting for the price to drop back to previous lows.
- Converging Trendlines (The Squeeze): The flat resistance and rising support must converge to squeeze the price into a narrow apex. This volatility contraction builds potential energy like a coiled spring; the tighter the squeeze, the more explosive the breakout.
- Declining Volume (The Filter): As the pattern matures, trading activity should noticeably decrease. This “drying up” of volume indicates that selling pressure is evaporating, setting the stage for a demand-driven breakout.
- Breakout Confirmation: Professional traders never act on a simple wick. You need a full candle close (preferably H4 or Daily) decisively above the resistance line to confirm that buyers have overwhelmed the sellers.
3. What Is the Market Psychology Behind the Pattern?
The chart is a footprint of human emotion. The Ascending Triangle chart pattern reveals a specific battle where aggressive buyers systematically exhaust the supply of passive sellers.
3.1. Sellers Defend the “Line in the Sand”
A large institution or group of sellers is camped at the resistance line, supplying liquidity at a fixed price. They believe the asset is overvalued and are happy to exit, creating a temporary ceiling that absorbs buying pressure.
3.2. Buyers Show Aggression (The Squeeze)
While sellers are passive, buyers are impatient. Instead of waiting for the price to drop back to previous lows, they “bid up” the price earlier during every dip. The formation of higher lows proves that demand is increasing and buyers are willing to pay a premium to enter.
3.3. The Breakout Chain Reaction
Eventually, the sellers run out of inventory. When the supply wall disappears, the price shoots up through resistance. This triggers a double wave of buying: short sellers panic-covering and breakout traders entering, fueling the explosive move.
4. What Are the Types of Ascending Triangle Chart Pattern Setups?
The Ascending Triangle chart pattern appears in three primary scenarios. Identifying the specific market context is crucial for predicting the likely trend bias of the breakout.
4.1. Classic Ascending Triangle (Continuation)
This is the “textbook” setup and statistically the most reliable variation. It appears in the middle of an established uptrend, acting as a temporary pause where the market digests recent gains.
- The Logic: Early buyers are taking profits (creating resistance), but new buyers are eager to get in (raising support).
- The Outcome: Once the supply is absorbed, the dominant uptrend resumes with renewed energy.
4.2. Ascending Triangle as Reversal Pattern (Rare Case)
Although less common, this pattern can form at the very bottom of a downtrend, marking the transition from a bear market to a bull market.
- The Logic: It functions as an accumulation phase. Smart money begins accumulating positions, absorbing the final selling pressure from the bear market.
- The Outcome: A breakout above the flat resistance signals that the long-term downtrend is over and a new bull market has begun.
4.3. Failed Ascending Triangle (The Bull Trap)
Not every triangle breaks upward. A “failed” pattern occurs when the price breaks below the ascending support line, trapping aggressive bulls who bought early.
- The Trap: Buyers exhaust their capital trying to break the resistance but fail. When they realize the breakout won’t happen, they panic-sell.
- The Outcome: This triggers a cascade of stop-losses, causing the price to crash below the trendline. This is often called a “Bull Trap.”
5. How Do You Identify a High-Probability Ascending Triangle?
To confirm a high-probability setup in technical analysis, you must identify four distinct technical traits: a minimum of four touchpoints on the trendlines, a clearly defined horizontal resistance, declining volume during formation, and a pre-existing uptrend context.
5.1. Minimum 4 Touchpoints (The Rule of 4)
A valid geometric pattern requires sufficient data points to confirm that the trendlines are real market structures, not just random drawings.
- The Requirement: You need a minimum of two distinct touches on the upper resistance line and two higher lows touching the support line.
- The Logic: A line drawn with only two points is tentative. A confirmed trend line requires three or more touches. The more touches, the more reliable the eventual breakout.
5.2. Resistance Must Be Well-Defined
The upper trendline acts as the “line in the sand.” It must represent a clear, visible zone where sellers are actively defending their positions.
- Horizontal Accuracy: The highs should align horizontally. While minor wicks can poke through, the bodies of the candles should respect the level.
- Supply Zone: If the resistance line slopes significantly downward or upward, the pattern is likely a Wedge or a Pennant, which requires different trading rules.
5.3. Volume Contraction + Expansion on Breakout
Volume analysis acts as your truth detector. It reveals the hidden flow of money moving into or out of the asset during the consolidation phase.
- During Formation: Volume should contract (decrease) as the price moves toward the apex. This shows that the market is running out of sellers.
- At Breakout: The breakout candle must be accompanied by a massive volume spike. This confirms that institutional “Smart Money” is fueling the move, reducing the chance of a fakeout.
5.4. Context: Must Preferably Be in an Uptrend
The Ascending Triangle is a continuation pattern by design. Its predictive power is statistically highest when it is used to rejoin an existing trend.
- The Trend Check: Zoom out. Is there a clear uptrend leading into the triangle?
- The Filter: Avoid trading this pattern if it appears in a choppy, sideways market or immediately after a parabolic crash. It works best as a “pause” in a rising market, not a reversal from a crash.
6. How Should You Trade the Ascending Triangle Pattern?
Developing a solid trading strategy for this pattern depends on disciplined execution. You can choose between an aggressive entry to catch the initial move or a conservative entry to confirm the breakout.
6.1. Entry Strategy 1: The Breakout Entry (Aggressive)
Aggressive traders often prioritize speed to ensure they don’t miss the move if the price explodes upward without looking back.
- The Trigger: Enter a long position immediately when a candle closes decisively above the horizontal resistance line.
- The Risk: Entering early carries a higher risk of a “fakeout” (false breakout) if the price reverses quickly back into the triangle.
6.2. Entry Strategy 2: The Retest Entry (Conservative)
Professional traders focused on high win rates often prefer waiting for confirmation.
- The Process: Allow the breakout to happen, then wait for the price to pull back to the broken resistance level.
- The Trigger: Enter only when you see a bullish rejection candle (like a Hammer or Engulfing pattern) forming at the retest level. This confirms that old resistance has successfully flipped into a new support level.
6.3. Stop Loss Placement (Risk Management)
Risk management is non-negotiable. Never enter a trade without a predefined exit point for failure.
- Aggressive SL: Place the stop loss just below the most recent higher low within the triangle. This offers a tighter risk-to-reward ratio but is more susceptible to volatility.
- Conservative SL: Place the stop loss below the rising trendline or the “base” of the triangle. This gives the trade more room to breathe but requires a smaller position size to manage risk.
6.4. Take Profit Using Measured Move
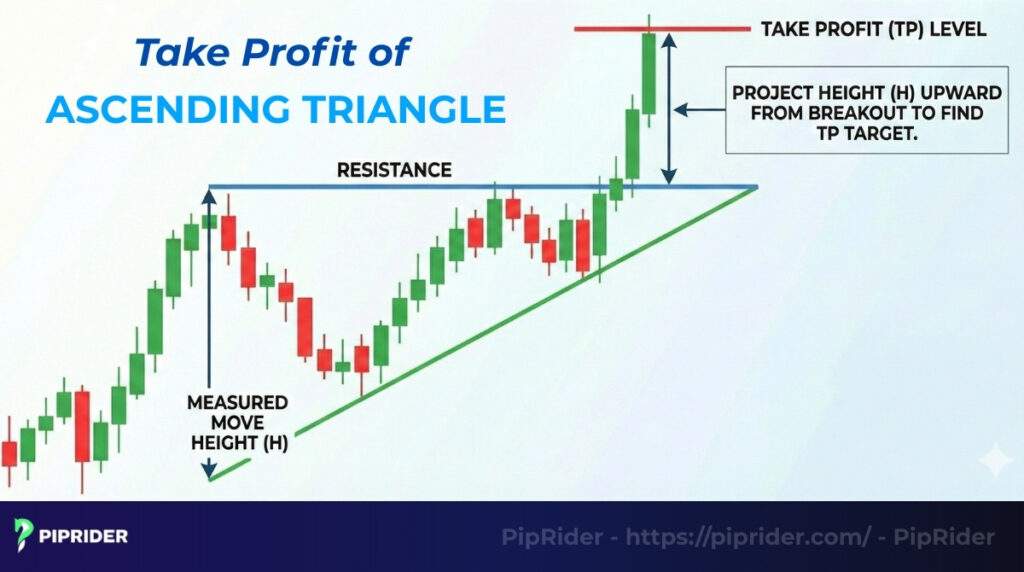
The Ascending Triangle chart pattern offers a clear price projection based on its own geometry.
- The Formula: Measure the widest vertical distance (height) of the triangle at its start (base).
- The Target: Project that exact distance upward from the breakout point. This serves as your minimum Take Profit (TP) level.
6.5. Multi-Timeframe Confirmation
Filtering out low-quality signals is easier when you check the bigger picture. If you are trading a triangle on the 1-Hour chart, always check the 4-Hour or Daily chart for context. If the larger trend is also bullish and the price is above key moving averages (like the 200 EMA) on the higher timeframe, the breakout probability increases significantly.
7. Which Indicators Best Improve Ascending Triangle Accuracy?
Price action is king, but specific technical indicators act as your loyal advisors. Use this quick checklist to filter out bad signals and confirm the strength of the breakout.
| Indicator | What to Look For | Why It Matters |
| Volume | Spike on Breakout | Confirms “Smart Money” participation. |
| RSI | Break above 50/70 | Shows momentum is favoring buyers. |
| MACD | Bullish Crossover | Confirms trend direction shift. |
| EMA | Price > 20/50 EMA | Acts as dynamic support below price. |
- Volume Breakout Confirmation (Non-Negotiable): Volume is the breakout’s fuel. While activity should dry up during consolidation, the breakout candle demands strict volume confirmation (ideally 1.5x–2x average). This validates institutional backing; a low-volume breakout is usually a trap.
- RSI Bullish Momentum: Use the RSI to gauge buyer strength. Look for the indicator to clear the 50-level or break its own downtrend line before the price breaks resistance. This serves as a powerful “leading signal” for an early entry.
- MACD Crossover: This confirms trend direction. A bullish crossover occurring right before the breakout, combined with histogram bars flipping positive, indicates that bullish momentum is accelerating at the critical moment.
- EMA Trend Support: Ensure the price is trading above the 50-period EMA to confirm a healthy trend. Ideally, the triangle’s rising support line should align with this EMA, creating a “dual layer” of defense against bearish pressure.
8. How Does the Ascending Triangle Differ From Similar Patterns?
Misidentifying the pattern can lead to entering a trade in the wrong direction. Use this quick comparison guide to distinguish the Ascending Triangle chart pattern from other common formations.
| Pattern | Upper Trendline | Lower Trendline | Signal Bias |
| Ascending Triangle | Flat (Horizontal) | Rising | Bullish (Continuation) |
| Symmetrical Triangle | Sloping Down | Rising | Neutral (Wait for breakout) |
| Rising Wedge | Sloping Up | Rising (Steeper) | Bearish (Reversal) |
| Bull Flag | Sloping Down | Sloping Down | Bullish (Continuation) |
8.1. Ascending Triangle vs. Symmetrical Triangle
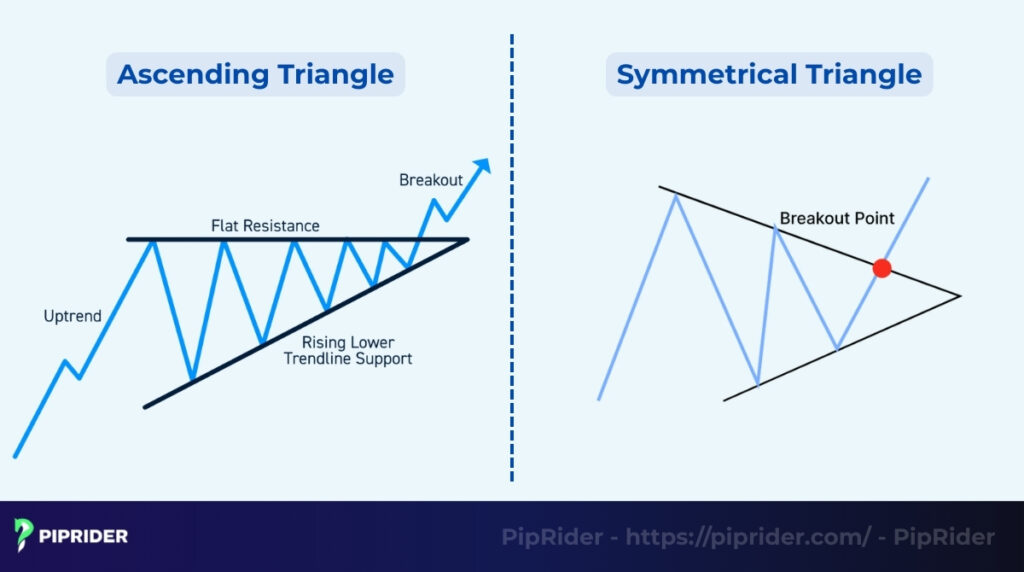
While both are consolidation patterns, they reveal different levels of buyer aggression.
- Resistance: The Ascending Triangle chart pattern has a flat resistance (buyers attacking a fixed level), while the Symmetrical Triangle has a descending resistance (sellers pushing price down).
- Bias: The Ascending Triangle is inherently bullish. The Symmetrical Triangle is neutral; the breakout can happen in either direction, requiring more patience.
8.2. Ascending Triangle vs. Rising Wedge
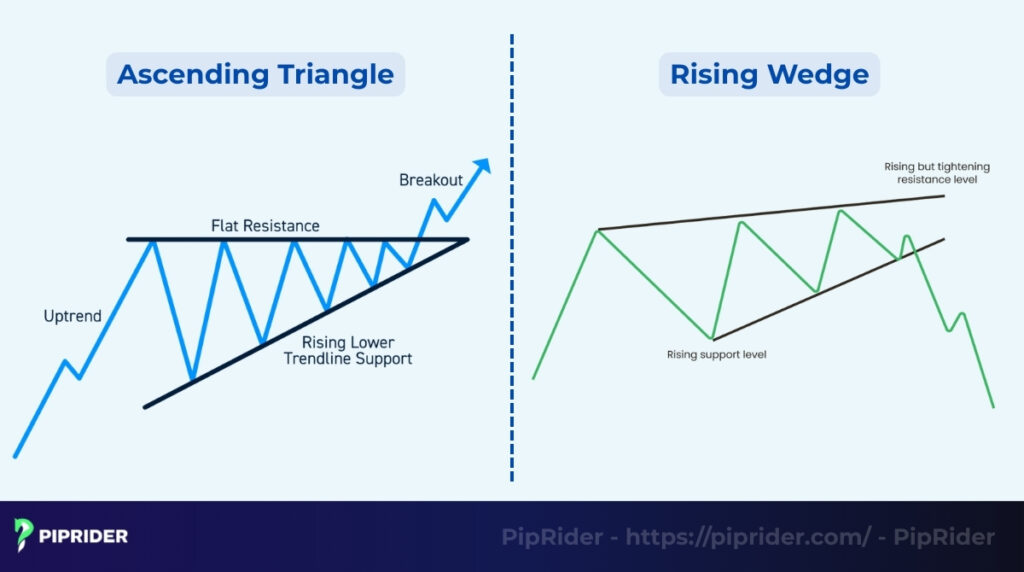
This is the most dangerous confusion because the signals are opposite.
- The Slope: In an Ascending Triangle, the top is flat. In a Rising Wedge, both lines slope upward.
- The Outcome: The Ascending Triangle signals that buyers are absorbing supply (Bullish). The Rising Wedge signals that buyers are exhausting themselves chasing price (Bearish Reversal).
8.3. Ascending Triangle vs. Bull Flag
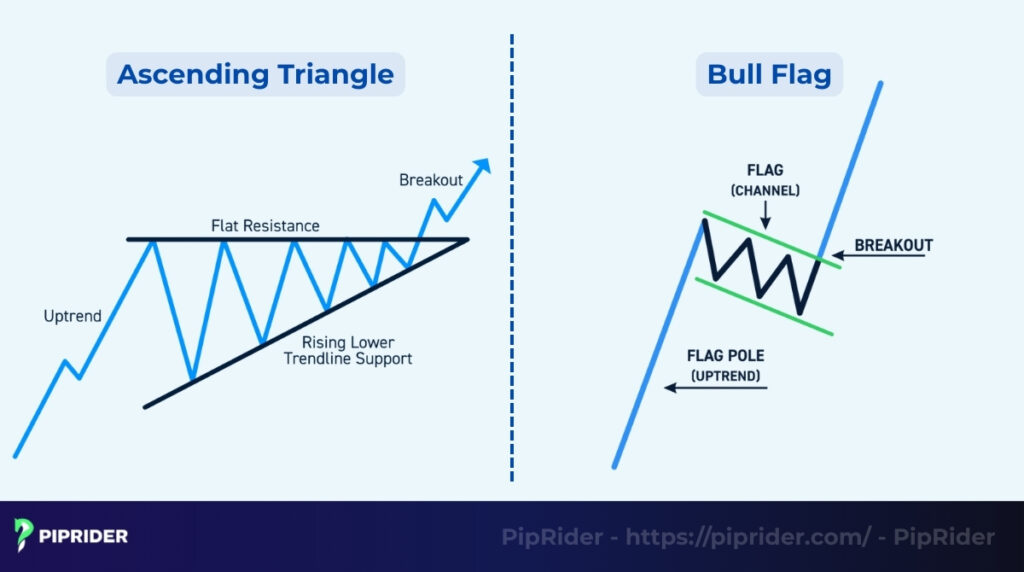
Both are bullish continuation patterns, but they operate on different timeframes and structures.
- Geometry: The Triangle has converging lines (volatility squeeze). The Bull Flag has parallel lines sloping downward (channel).
- Duration: Flags are typically short-term “pauses” (1-3 weeks) after a sharp spike. Triangles are medium-term “structures” (weeks to months) that build significant energy.
9. How Does the Ascending Triangle Look in Real Markets?
Theory is useless without application in technical analysis. While the psychology remains the same, each market has unique nuances. Use this table to adjust your strategy based on the asset class.
| Market | Key Characteristic | Strategy Tip |
| Forex | High Liquidity | Best for clean Retest Entries (intraday). |
| Crypto | Extreme Volatility | Beware of wicks. Wait for Candle Close. |
| Stocks | Volume & Gaps | Must see massive Volume Spike on breakout. |
9.1. Ascending Triangle in Forex (EUR/USD)
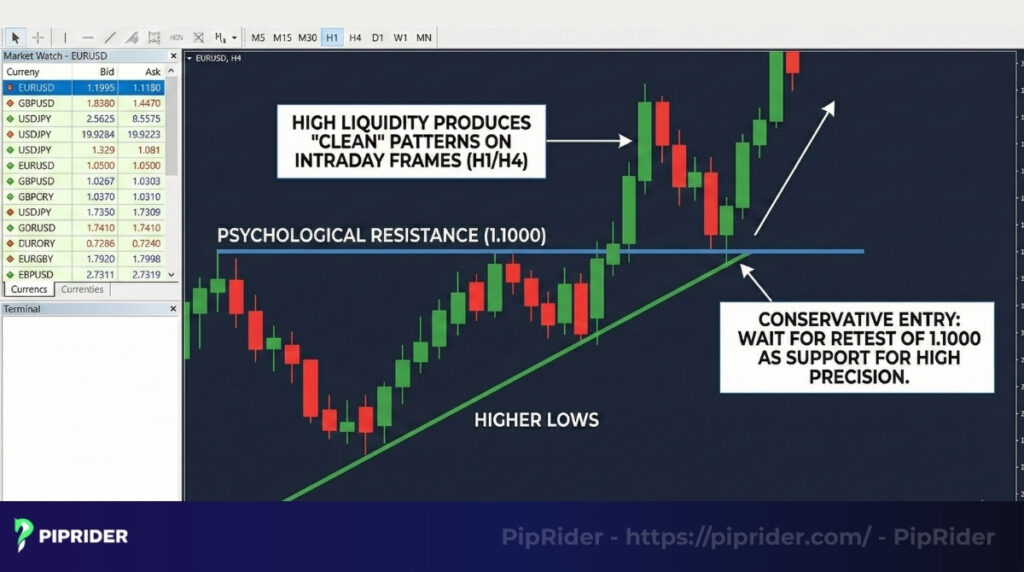
The Forex market is highly liquid, often producing the “cleanest” patterns on intraday timeframes like the 1-Hour (H1) or 4-Hour (H4).
- The Setup: EUR/USD rallies but hits a wall at a psychological number (e.g., 1.1000). Over several days, it attacks this level repeatedly while forming higher lows.
- The Execution: Due to high liquidity, the price often breaks out and pulls back perfectly to test 1.1000 as support. Conservative traders should wait for this retest to enter with high precision.
9.2. Ascending Triangle in Crypto (Bitcoin – BTC/USD)
Crypto markets are famous for explosive moves and “stop hunts.” Triangles here often signal the end of a re-accumulation phase before a parabolic run.
- The Danger: Crypto breakouts are violent and often accompanied by long wicks (false breakouts) designed to trigger stop losses.
- The Fix: Never trade the initial tick. Always wait for a confirmed close on daily charts above the resistance level to ensure the breakout is genuine.
9.3. Ascending Triangle in Stocks (Apple – AAPL)
In the stock market, this pattern is a classic setup leading into earnings reports or during strong bull runs.
- The Setup: AAPL trends up but pauses for 2 months. Institutions quietly accumulate shares at higher prices (higher lows), while retail traders sell at a resistance level (e.g., $150).
- Volume Rule: Unlike forex trading, stocks have centralized volume data. You must see a massive volume bar on the breakout day. If the price breaks resistance on low volume, it is likely a trap.
10. What Are Common Mistakes Traders Make?
Even with a perfect pattern, human error can ruin the trade. Avoid these four common traps that turn profitable setups into losses.
- Confusing trading patterns: Mistaking a Rectangle Pattern (a sideways range with a flat top and flat bottom) for a triangle. Always check that the support line is clearly rising, indicating increasing buyer aggression, rather than just moving sideways.
- FOMO trading: Entering before the breakout candle actually closes. This is essentially gambling on a prediction rather than trading a confirmation, and it often leads to buying the exact top just before the price rejects resistance and reverses.
- Ignoring volume: Trading a breakout that occurs on low or average volume. A valid, sustainable move requires a significant surge in volume to confirm that institutional money is fueling the breakout; otherwise, it’s likely a “bull trap.”
- Poor stop loss: Placing the stop loss too tight, such as exactly on the rising trendline. Market noise and volatility wicks often puncture the trendline momentarily before the price rallies. Always leave a small buffer or use an ATR-based stop to let the trade breathe.
11. Which Scanners and Tools Can Automatically Detect the Pattern?
Manually scanning hundreds of charts is inefficient and prone to error. Professional traders leverage specialized software for serious technical analysis to automate the hunt.
- TradingView (Built-in & Community):
Open a chart -> Click “Indicators” -> Type “Chart Patterns” -> Select “Ascending Triangle”. This official tool will automatically highlight valid patterns on your chart in real-time. - FinViz (Free Stock Screener):
Go to the “Screener” tab -> Select “All” -> Under the “Signal” dropdown menu, choose “Triangle Ascending”. This instantly filters thousands of stocks down to a shortlist of high-probability candidates. - TrendSpider (Automated Analysis):
Enable the “Auto-Analysis” button. The AI will instantly draw trendlines across multiple timeframes. You can set dynamic alerts that trigger only when price touches or breaks the resistance line, saving you hours of screen time. - MT4/MT5 Custom Indicators:
Visit the MQL5 Market and search for plugins like “Autochartist” or “ZUP”. These tools scan Forex pairs in the background and pop up an alert window whenever a triangle pattern is detected on your chosen timeframe.
12. Frequently asked questions about Ascending Triangle Chart Pattern
Quick answers to the most common questions traders have about this chart pattern.
13. Conclusion
The Ascending Triangle chart pattern is a premier tool for identifying high-probability trend continuations. Its clear structure, distinct higher lows, and volume contraction provide a roadmap of buyer aggression.
Success lies in disciplined execution. Never rely on shape alone. Always confirm the breakout with a significant volume spike, support from key EMAs, and a valid candle close to avoid costly bull traps. Ready to master the markets? Follow Piprider today for professional insights and advanced trading strategies.


