Author for Forex Learn Levels 1–3, creating accessible, research-driven modules that simplify forex and personal finance for beginner to intermediate learners.
Mistakes such as buying near market tops or selling near bottoms often occur when traders confuse strong price movement with a sustainable trend. The RSI Relative Strength Index is a powerful momentum tool created to mitigate this problem. Developed by J. Welles Wilder Jr., the RSI acts as a momentum gauge, effectively signaling when an...
The Price Rate of Change (ROC) is a momentum indicator designed to measure the percentage change in price between the current period and a past period. By tracking this market velocity, the ROC helps traders objectively confirm trend strength and anticipate potential exhaustion points before a reversal occurs. This guide provides the complete formula, clear...
Pivot Point constitutes a fundamental yet powerful technical analysis tool designed to identify potential support and resistance levels in the market. By utilizing the high, low, and closing prices of the preceding trading session, Pivot Points furnish critical reference markers that help traders determine the trend bias and systematically plan their trades. This comprehensive guide...
The Fibonacci retracement is a popular technical analysis tool that helps identify potential support and resistance zones. Based on key ratios from the Fibonacci sequence, it helps traders pinpoint where a price correction within a trend is likely to pause or reverse. This guide will cover everything from drawing the levels accurately on platforms like...
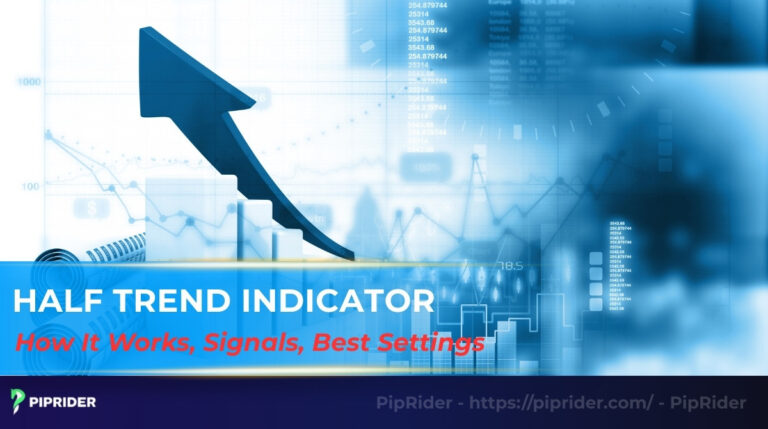
The Half Trend indicator is a non-repainting technical tool designed to simplify trend identification using Average True Range (ATR) calculations. It excels at capturing sustained moves in strong trending environments but requires a secondary filter during sideways consolidation to avoid false signals. This guide covers how to filter out these false signals, apply dynamic risk...
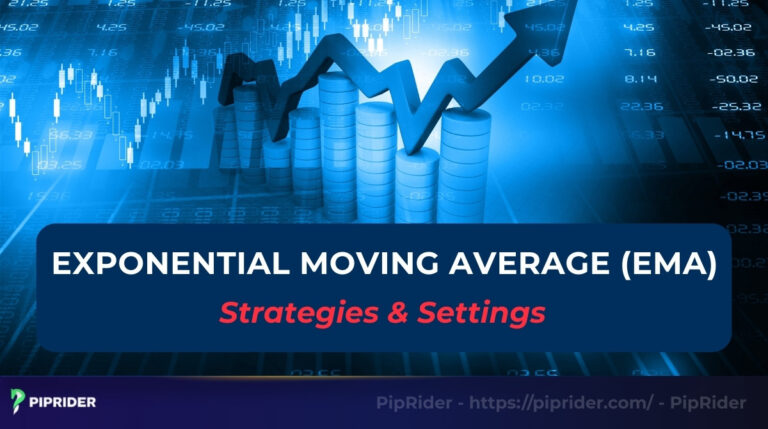
In the world of technical analysis, traders are constantly searching for clarity amidst the noise of market price fluctuations. The Exponential Moving Averages EMA indicator is a foundational tool designed to provide that clarity. It’s a dynamic and responsive moving average that helps traders identify the underlying trend and momentum with greater speed and precision...
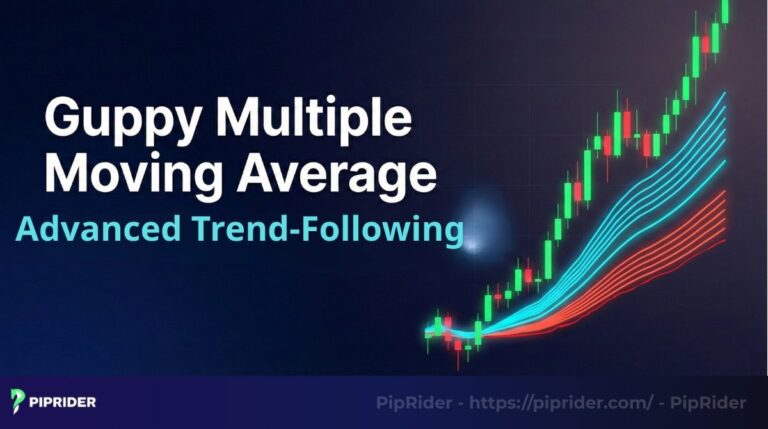
How can you distinguish between a powerful, sustainable trend on EUR/USD and a fleeting price spike that’s about to collapse? The guppy multiple moving average (GMMA) is a brilliant visual instrument designed to answer that very question, helping traders to see the complete picture of market psychology and trend vitality. This guide serves as a...
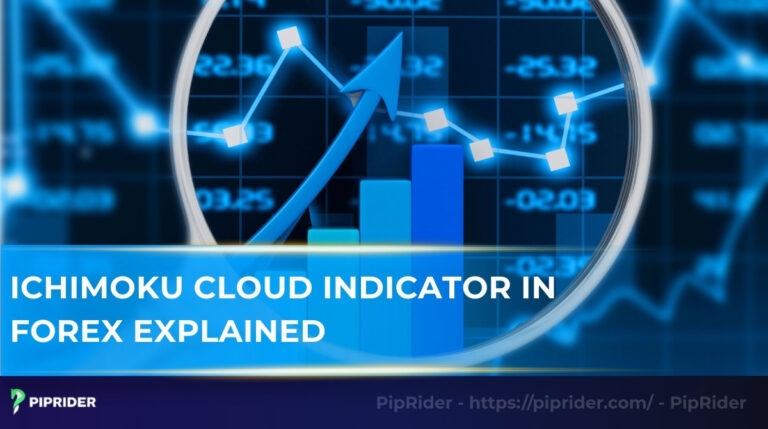
The Ichimoku Kinko Hyo (commonly known as the Ichimoku Cloud) is a technical analysis system developed to visualize market equilibrium. Unlike standard indicators that typically track a single data point, Ichimoku aggregates trend direction, momentum gauges, and forward-looking support and resistance zones onto one chart. In this guide, you will find the Ichimoku Cloud indicator...
How can one objectively pinpoint significant swing highs and lows on the fast-paced charts of currency pairs like EUR/USD or GBP/JPY? The central idea of fractal trading, a concept introduced by the legendary trader Bill Williams, uses the fractal indicator to solve this very challenge. These fractal patterns provide clean, unambiguous levels for potential support...
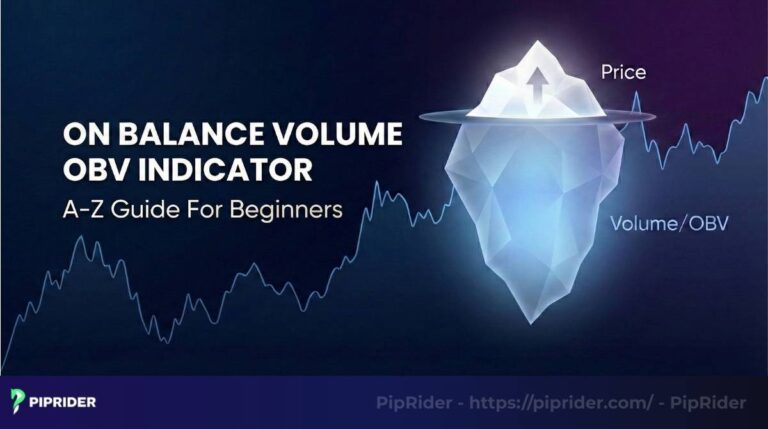
Failed breakouts frequently occur when price movements are not supported by the necessary trading volume. The On-Balance Volume OBV indicator is a momentum tool designed to measure cumulative buying and selling pressure within an asset. By tracking this volume flow, OBV helps traders verify the conviction behind a price trend. This guide provides a direct...
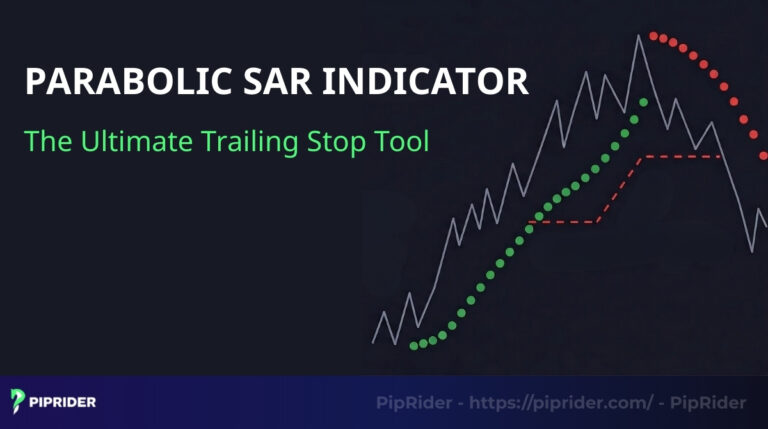
The Parabolic SAR (Stop and Reverse) is a trend-following indicator designed to solve a specific trading problem: Managing exits. Unlike static support levels, it acts as a dynamic trailing stop-loss that moves with the price, helping traders lock in profits as a trend accelerates. This guide breaks down exactly how to read its signals and...
The Donchian Channel is a straightforward technical indicator that maps the highest and lowest prices over a set period. It transforms chaotic price movements into clear, actionable signals, helping forex traders identify trends and potential breakouts with greater confidence. This guide will walk you through everything from its core mechanics to practical trading strategies. You’ll...
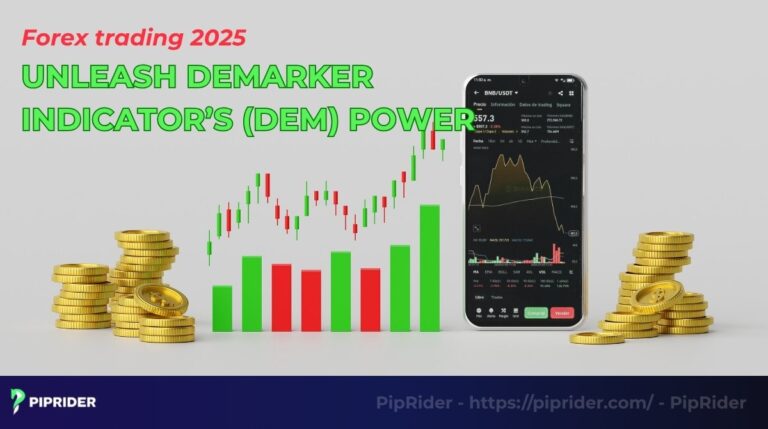
Are you searching for a responsive oscillator to help pinpoint trend fatigue but find the RSI can be overly erratic at times? The DeMarker indicator (DeM), a powerful yet often underutilized tool, offers a compelling solution. This indicator presents a distinct view of market dynamics and serves as a fantastic alternative or companion to the...
Are you tired of endlessly flipping through dozens of charts, trying to find a currency pair that’s actually moving? The Currency Strength Indicator (also known as a Currency Strength Meter, CSM, or CS indicator) is a tool designed to solve this problem, giving you an instant, high-level overview of the entire Forex market in a...
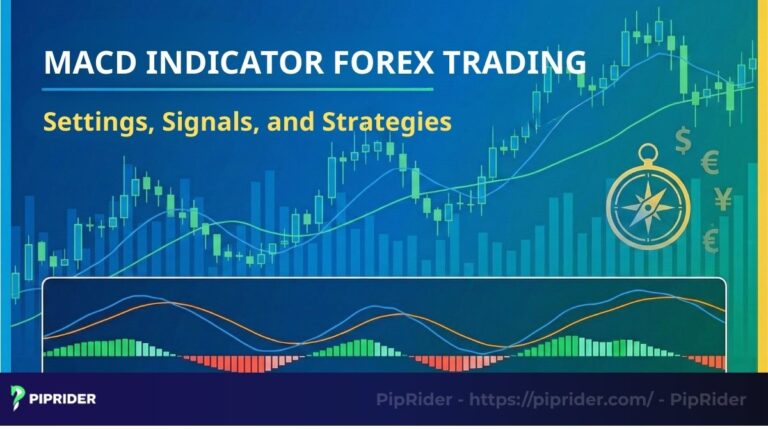
Market volatility often disguises a lack of true momentum. The Moving Average Convergence Divergence (MACD) indicator is the powerful tool used to solve this problem. It acts as a speedometer for a trend, tracking the relationship between two moving averages to show strength and direction. In this guide, Piprider will break down the MACD indicator...
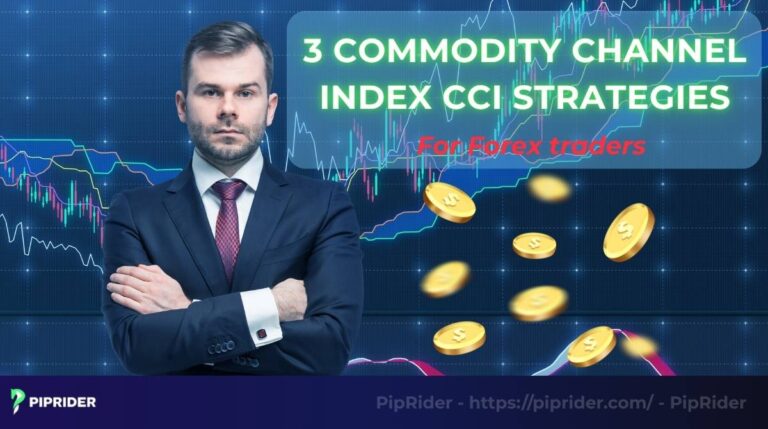
Have you ever looked at a trend and questioned its endurance? Is it gaining strength, or is it merely running on fumes before a reversal? The Commodity Channel Index CCI, the brainchild of the brilliant technical analyst Donald Lambert, was engineered to provide answers. Though originally for commodities, the CCI has proven to be a...
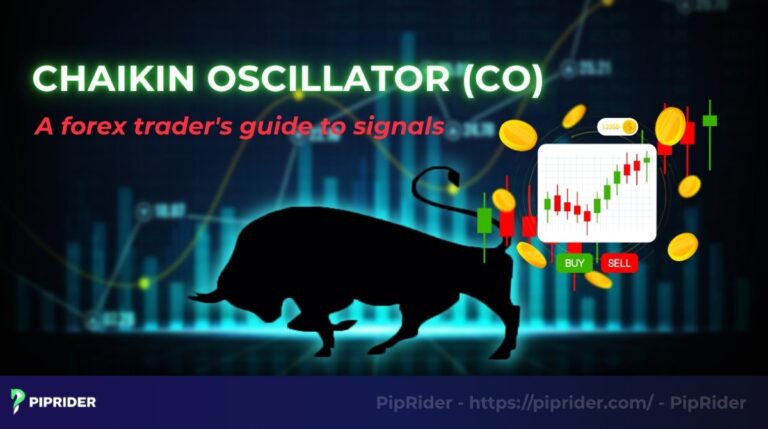
Price charts only tell part of the story. What if you could see the conviction behind price movements, the actual buying and selling force that fuels a trend? The Chaikin Oscillator (CO) is a powerful technical indicator designed to do precisely that. It moves beyond price alone to analyze the momentum of money flowing into...
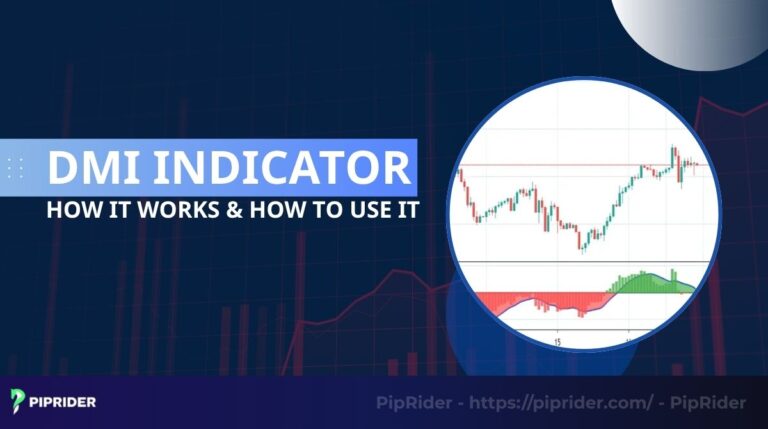
Years ago, I sat staring at my trading screen, heart racing as I tried to guess where the market was headed. Trends seemed like waves in a stormy sea unpredictable and overwhelming. Then I stumbled upon the DMI indicator, and it felt like finding a compass in the chaos. The DMI indicator, or Directional Movement...