
The Bullish Harami Pattern is a reliable reversal signal when found in a downtrend at key support levels. This formation on a candlestick chart shows that selling momentum is fading, alerting price action traders to a potential bullish reversal. This guide teaches you how to filter false signals using volume and RSI, identify valid structures, and execute high-probability entries.
Key Takeaways
- The Bullish Harami is a reversal pattern that appears during a bearish trend.
- It features a large bearish “mother” candle followed by a small bullish or neutral “baby” candle completely contained within the mother’s body.
- The pattern signals that selling pressure is weakening and indecision has set in, often preceding a trend shift.
- Reliability increases significantly when combined with volume spikes, key support levels, or RSI divergence.
- This setup is effective across all major markets, including Forex, Crypto, and Stocks.
1. What Is the Bullish Harami Pattern?
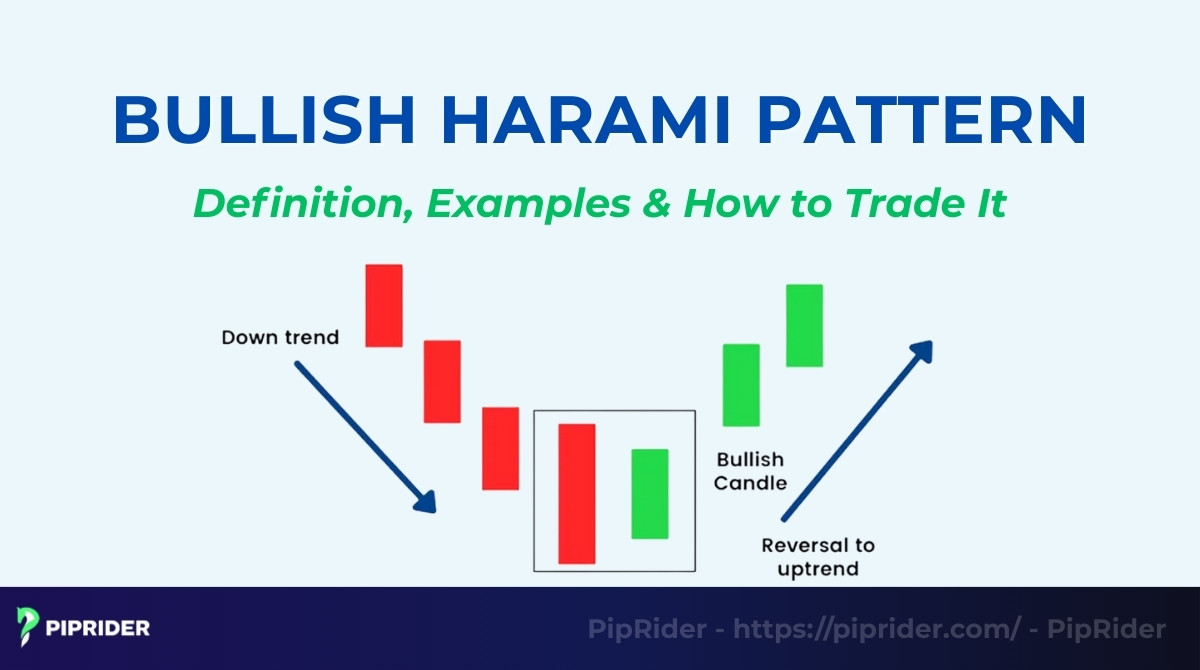
The Bullish Harami is a two-candle Japanese pattern found at the bottom of a downtrend. It signals that the intense selling pressure has paused, opening the door for a potential market reversal.
1.1. Definition in Technical Analysis
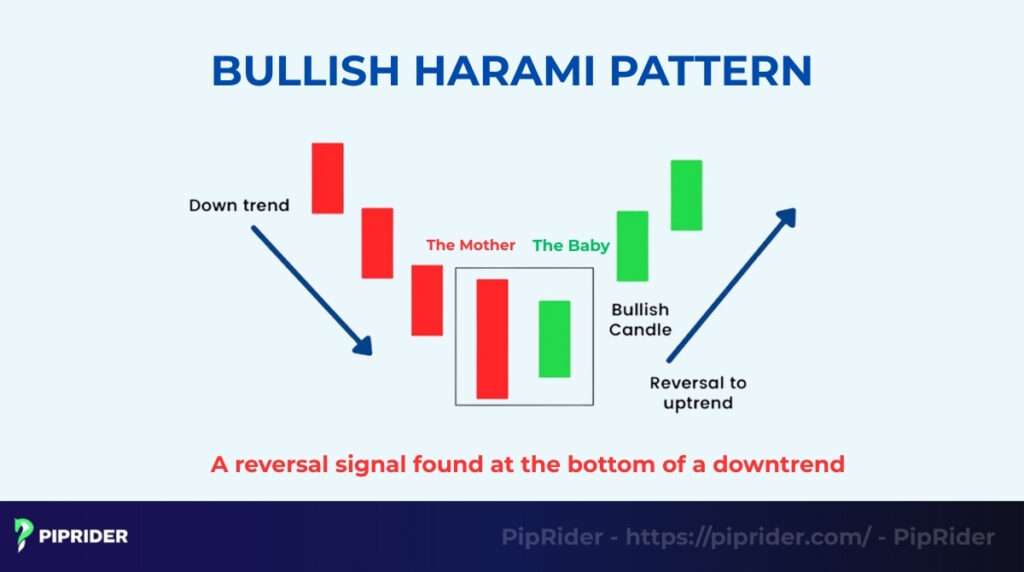
According to Investopedia (2025), the name “Harami” means “pregnant woman” in Japanese (Chen, 2025), which perfectly describes its look on a candlestick chart:
- The Mother (First Candle): A long, bearish (red) candle representing the strong downtrend.
- The Baby (Second Candle): A small bullish (green) or neutral candle. Its entire body must be contained inside the body of the first candle.
This visual metaphor represents the “birth” of a new uptrend.
1.2. Why It Indicates a Reversal
The pattern reveals a shift in market psychology.
- The Drop: The long red candle shows sellers are in control.
- The Pause: The next day, the price opens higher (gaps up) and refuses to drop further.
- The Shift: This failure to make a new low proves selling momentum has evaporated, allowing buyers to step in.
1.3. Bullish Harami vs. Harami Cross
A powerful variation is the Harami Cross, where the second candle is a Doji (Opening Price ≈ Closing Price). Because a Doji represents extreme indecision and a total freeze in selling, the Harami Cross is often considered a stronger signal than the standard version.
2. What Does a Valid Bullish Harami Look Like?
Not every small candle following a large one is a tradeable Harami. To distinguish a high-probability reversal from random noise, traders must verify these four strict technical criteria on the candlestick chart.
- The Pre-Condition (Downtrend): Context is everything. A Harami pattern is meaningless if it appears in a sideways market or an existing uptrend. Traders must clearly see a series of lower lows and lower highs leading into the pattern, confirming that a bearish trend is active immediately before the signal forms.
- The Mother Candle (Large & Bearish): The first candle represents the final, aggressive push of the sellers. It must be a long bearish candle (Red/Black) with a substantial body, indicating that selling pressure was intense and the price closed near the session low.
- The Baby Candle (Small & Contained): The second candle signals that the trend has hit a wall. It must be a small candle (ideally bullish/green, though neutral is acceptable). The crucial rule is that its entire real body must be contained within the vertical range of the first candle’s body.
- The Gap Up (Surprise Factor): For a valid setup, the price must gap up at the open of the second candle (opening higher than the previous close). This gap surprises the bears, who expected the price to continue falling, marking the first sign of a sentiment shift.
3. What Is the Market Psychology Behind the Bullish Harami?
The Bullish Harami is more than just a shape on a candlestick chart; it represents a critical moment of doubt. It visualizes the transition from fear (panic selling) to hope (potential recovery) within the market.
3.1. Selling Climax & Exhaustion (The Bear Trap)
The first large red candle represents the climax of bearish pressure. Bears are confident, dumping shares aggressively to close at the lows. However, the second small candle acts as a “brake.”
- The Shock: The fact that the price gaps up the next day and refuses to drop lower shocks the bears.
- The Realization: Sellers realize the “easy money” on the short side has been made. They can no longer push the price down efficiently, leading to profit-taking.
3.2. Buyers Step In at Key Demand Zone
The Harami rarely works in a vacuum. Its power comes from where it forms.
- Smart Money: Institutional buyers often place large buy limit orders at key support levels or demand zones.
- Absorption: As retail traders panic-sell during the first candle, institutions absorb this liquidity. The second “inside” candle proves that this demand wall has successfully halted the decline.
3.3. Market Indecision → Potential Trend Shift
The small inside candle represents a state of equilibrium.
- The Pause: Volatility contracts. The market is catching its breath after the plunge.
- The Shift: This pause is dangerous for bears holding short positions. If the price breaks upward from this consolidation, it triggers a cascade of short-covering, fueling the new uptrend.
4. What Are the Types of Bullish Harami Patterns?
Not all Harami patterns are created equal. The shape of the second candle and the surrounding market context determine the strength of the reversal signal.
4.1. Standard Bullish Harami
The Standard Bullish Harami is the classic version most traders learn first. It represents a modest but clear shift in sentiment where selling pressure has been absorbed.
- Structure: A large bearish candle (Mother) followed by a smaller bullish candle (Baby) with a visible real body.
- The Signal: Buyers pushed the close higher than the open, showing regained strength. It is a moderately bullish signal that often needs confirmation.
4.2. Bullish Harami Cross
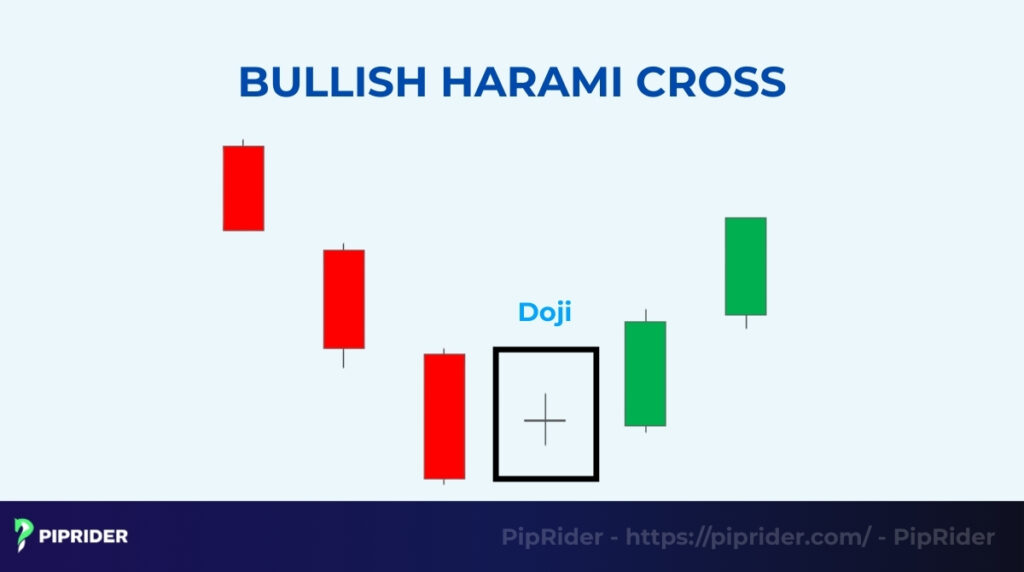
The Bullish Harami Cross is a more potent and volatile variation of the standard candlestick chart pattern. It often appears at market bottoms during high-stress periods.
- Structure: A large bearish candle followed by a Doji (Open ≈ Close).
- The Signal: A Doji means “Complete Freeze” after aggressive selling. This dramatic halt suggests the downtrend hit a brick wall, making it a stronger reversal signal than the standard version.
4.3. High-Probability Harami (Context-Driven)
This isn’t a different “shape” per se, but a specific “Grade A” setup that professional traders hunt for. It combines the pattern with market confluence.
- Structure: Forms exactly at a key support level or demand zone.
- The Signal: Combining high volume on the drop (climax) with low volume on the pause (exhaustion) creates a high-win-rate setup.
5. Bullish Harami vs. Similar Patterns: How to Avoid Confusion
Misidentifying a pattern can lead to poor entry timing or false signals. Use this quick guide to distinguish the Harami from other bullish reversals on a candlestick chart.
| Pattern | Key Difference (The “Tell”) | Signal Strength |
| Bullish Harami | Small green candle inside red body | Moderate (Pause in selling) |
| Bullish Engulfing | Huge green candle engulfs red body | Strong (Buyers overwhelm) |
| Piercing Pattern | Green candle closes above 50% of red body | Strong (Aggressive buying) |
| Inside Bar | General term (Can be Continuation) | Depends on Trend Context |
| Morning Star | 3 candles: Red → Small → Strong Green | Very Strong (Confirmed reversal) |
5.1. Bullish Harami vs. Bullish Engulfing Pattern
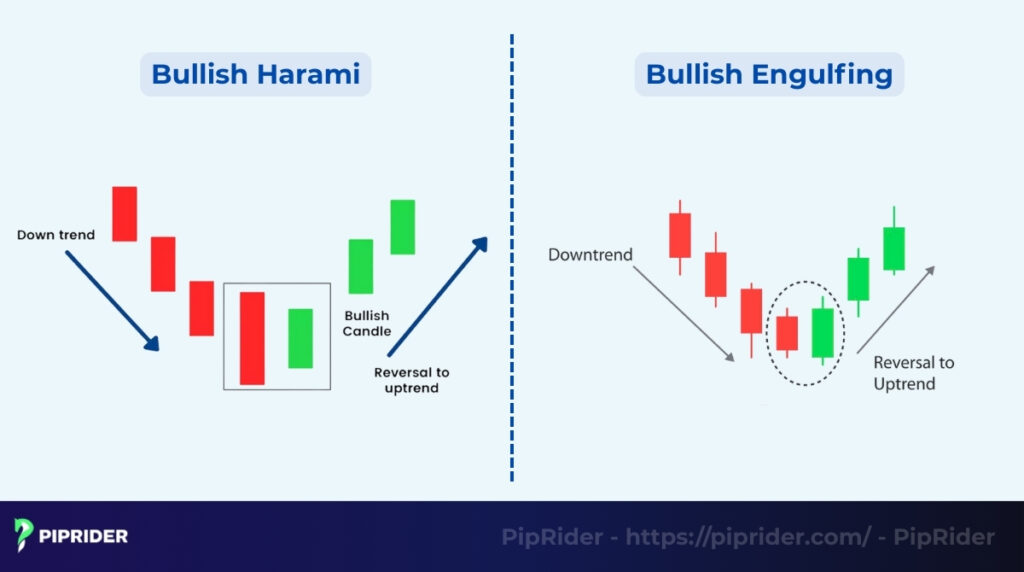
The difference lies in the strength of the signal.
- Harami: The second candle is small and contained inside the first red candle. It signals a “pause” in selling.
- Engulfing: The second candle is huge and completely engulfs (covers) the first red candle. It signals an “overwhelming” return of buyers.
The Engulfing pattern is a stronger and more immediate reversal signal than the Harami.
5.2. Bullish Harami vs. Piercing Pattern
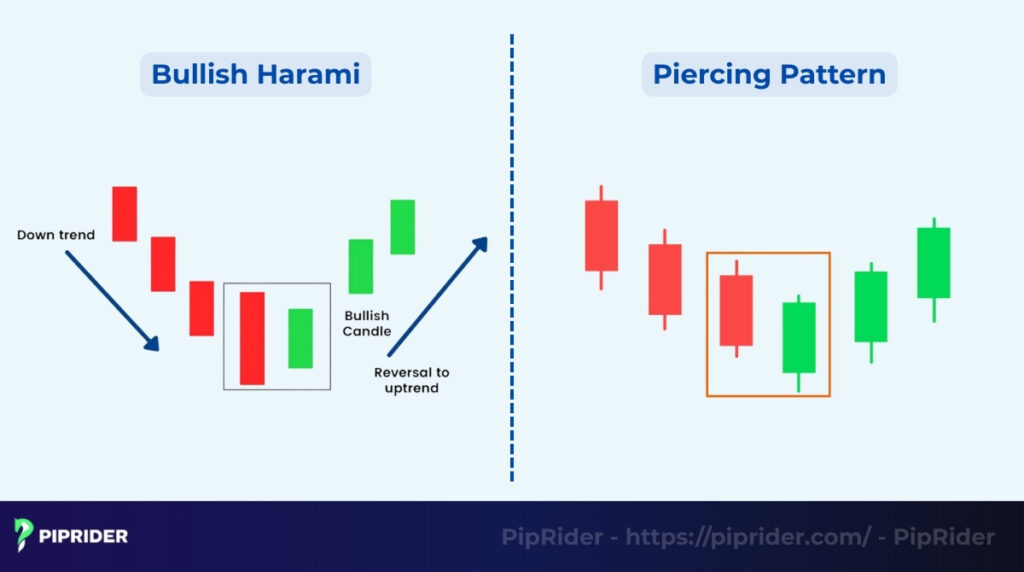
The difference is in the closing price of the second candle.
- Harami: The second candle opens higher (gap up) but stays inside the first candle’s range. It does not need to close above the midpoint.
- Piercing candlestick pattern: The second candle opens lower (gap down) but rallies strongly to close above the 50% midpoint of the first red candle.
The Piercing Pattern indicates more aggressive bullish pressure than the Harami because buyers pushed the price up from a new low.
5.3. Bullish Harami vs. Inside Bar
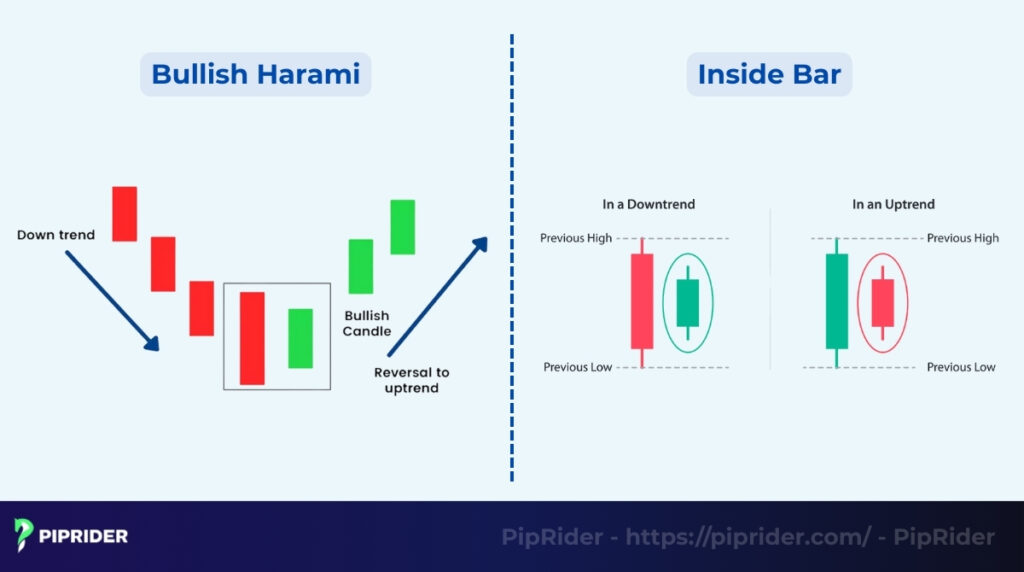
Every Bullish Harami is an Inside Bar, but not every Inside Bar is a Bullish Harami.
- Inside Bar: A general term for any candle contained within the previous one. It can appear in an uptrend (continuation) or downtrend.
- Bullish Harami: A specific type of Inside Bar that must appear in a downtrend. Context (the downtrend) is what defines the Harami.
5.4. Bullish Harami vs. Morning Star
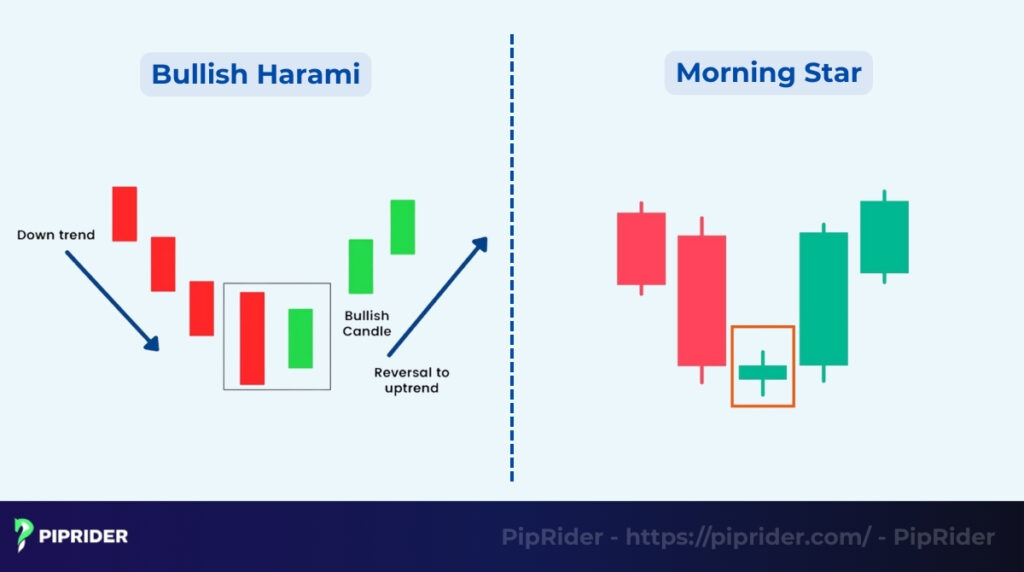
Traders often mix up these two because they both signal a bottom, but the Morning Star provides more confirmation.
- Harami: A 2-candle pattern (Red → Small Green). It shows the selling has stopped.
- Morning Star: A 3-candle pattern (Red → Small Star → Strong Green). The third candle confirms that buyers have aggressively taken control.
The Morning Star is statistically more reliable because the third candle acts as immediate confirmation of the reversal.
6. How to Identify a High-Probability Bullish Harami
Don’t trade with every Harami you see. To filter out noise and maximize your win rate through careful trend analysis, look for the confluence of these four confirmation factors.
6.1. Clear Downtrend Context
The Bullish Harami is a reversal pattern, so a clear bearish trend must exist beforehand. Look for distinct lower lows and lower highs. Avoid trading this pattern in a choppy or sideways market, as the failure rate is significantly higher.
6.2. Support Zone Confluence
Location is more important than the shape itself. A Harami forming “in the middle of nowhere” is often a trap. The pattern must form exactly at a key support level, a demand zone, or touch a long-term bullish Trendline. This confluence proves that buyers were already waiting at this level to absorb the selling pressure.
6.3. Volume Analysis (Decrease & Stabilization)
Volume confirms the validity of the psychological shift. Ideally, the mother candle (Red) should have high volume (Panic Selling), while the baby candle (Green) should have noticeably lower volume. This signals exhaustion; sellers have run out of ammunition, and no one is willing to sell at lower prices.
6.4. RSI Oversold or Bullish Divergence
Momentum indicators reveal the internal strength of the price action. Look for the RSI to dip below 30 (Oversold) or, even better, form a bullish divergence (Price makes a lower low, RSI makes a higher low). This divergence provides critical trend confirmation that bearish momentum had already faded before the Harami appeared.
7. How to Trade the Bullish Harami Pattern
Identification is only the first step. To turn this pattern into profit, follow this precise trading strategy designed to maximize reward while limiting risk.
| Strategy Component | The Rule | Why? |
| Entry (Aggressive) | Buy Stop above Mother Candle High | Captures immediate momentum. |
| Entry (Conservative) | Limit Order at Baby Candle High | Better price, lower risk (Retest). |
| Stop Loss | Below Mother Candle Low | Defines the point of failure. |
| Take Profit | Next Swing High or 1:2 Ratio | Ensures positive expectancy. |
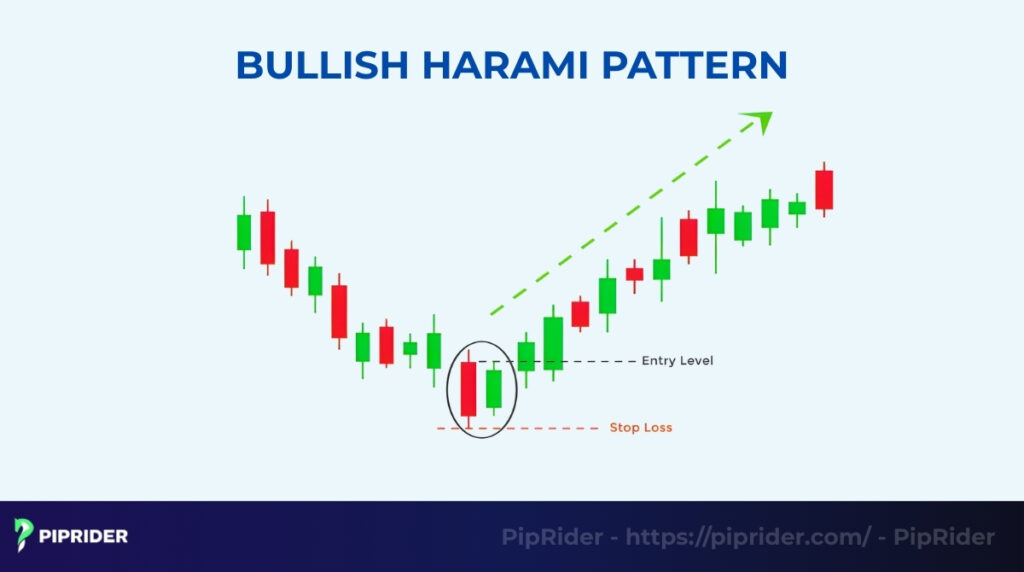
7.1. Entry Strategy 1: The Breakout (Classic)
This method focuses on capturing speed and momentum as soon as the buyers take control of the trend. This helps capture the initial price increase.
- The Trigger: Place a buy stop order 1-2 pips above the high of the mother candle (the large red candle).
- A break above the mother candle’s high confirms that buyers have completely erased the previous selling pressure. The downtrend is officially broken.
7.2. Entry Strategy 2: The Retest (Conservative)
This method prioritizes a better risk-to-reward ratio over speed, allowing you to enter at a discount. It creates a safer entry point.
- The Trigger: Wait for the price to break out, then place a limit order near the high of the baby candle.
- Price often pulls back to test the breakout level before rallying. Entering here allows for a tighter stop loss, although you risk missing the trade if the market moves too fast.
7.3. Stop Loss Placement (Protect Capital)
Never trade without a safety net, as even the best patterns can fail due to unforeseen market volatility. Proper risk management ensures you survive to trade another day without taking excessive losses.
- Standard SL: Place the stop just below the absolute low of the mother candle. If the price breaks this low, the reversal has failed, and the downtrend is resuming.
- Advanced SL: If the Harami formed at a major support zone, place the SL slightly below that zone to avoid “stop hunting” wicks.
7.4. Take Profit Strategy
Set targets based on market structure, not greed, to ensure you lock in gains before the trend exhausts itself. Using predefined levels removes emotion from the exit decision.
- Target 1 (Resistance): The first target should always be the most recent swing high or resistance level.
- Target 2 (Extension): If momentum is strong, aim for the 1.272 Fibonacci extension of the Harami leg.
- Golden Rule: Always ensure the potential reward is at least 2x the risk (1:2 Ratio). If your SL is 50 pips, your Target must be at least 100 pips.
8. Which Indicators Best Strengthen the Bullish Harami Signal?
Price action is king, but technical indicators are your loyal advisors. Using these tools creates a “confluence” of signals that drastically reduces the risk of entering a false reversal.
- RSI Oversold or Divergence: This is the most powerful confirmation. Look for the RSI (Relative Strength Index) to be below 30 (Oversold). Even better, spot a bullish divergence where the price makes a lower low (on the mother candle) while the RSI makes a higher low. This proves the selling momentum is hollow.
- MACD Bullish Crossover: The MACD (Moving Average Convergence Divergence) confirms the shift in trend direction. A bullish crossover (MACD line crossing above Signal line) occurring right after the Harami forms is a green light that momentum is aligning with your trade.
- EMA Dynamic Support: Ideally, the Harami should form right on top of a key Moving Average, such as the 50-period EMA or 200-period EMA. The moving average acts as a dynamic floor, adding an extra layer of defense against bears.
- Volume Spike on Confirmation: Volume is the fuel for the reversal. While volume often drops during the Harami itself (signaling indecision), traders need a massive volume spike on the breakout candle (the candle after the Harami). This surge confirms that institutions are aggressively buying the dip.
9. Real Chart Examples: Seeing the Reversal in Action
Recognizing the pattern on a live candlestick chart requires practice. Here are real-world examples of how the Bullish Harami manifests across different financial markets.
9.1. Forex Market Example (EUR/USD)
Forex markets often produce clean Harami patterns on the 4-Hour (H4) or Daily charts.
- The Setup: EUR/USD drops for 5 days, hitting a major support level at 1.0500.
- The Pattern: A long red candle appears, followed by a small green inside candle. The second candle gaps up slightly.
- The Trade: Traders enter on the break of the red candle’s high. The pair rallies 80 pips to the next resistance zone.
9.2. Crypto Example (Bitcoin – BTC/USD)
Crypto volatility creates explosive Harami setups on the candlestick chart, often marking the end of a “dump.”
- The Setup: Bitcoin crashes 15% in a week. RSI hits 20 (Extreme Oversold).
- The Pattern: A massive red “capitulation” candle forms. The next day, the price stabilizes, forming a tiny green Harami Cross (Doji).
- The Trade: This “total freeze” in selling is the signal. A buy order above the high triggers a 20% relief rally.
9.3. Stocks Example (Apple – AAPL)
In stocks, Harami patterns are powerful when combined with gap ups.
- The Setup: AAPL pulls back during a bull market to test the 50-day Moving Average.
- The Pattern: After a red day, the stock gaps up at the open and stays inside the previous range. Volume on the red day was high; volume on the green day is low.
- The Trade: This “drying up” of selling confirms the pullback is over. The stock resumes its primary uptrend.
10. What Are Common Mistakes Traders Make?
Even a perfect setup can fail if executed poorly. Avoid these four common errors that turn profitable opportunities into poor trading decisions.
- Trading in consolidation: The Harami is a reversal pattern. If you trade it during a sideways or choppy market, there is no trend to reverse. This is essentially gambling on noise.
- Ignoring trend context: Never trade the shape in isolation. If the overall market structure is still making aggressive lower lows without hitting support, a single Harami is unlikely to stop the crash.
- Mistaking an inside bar for a harami: Remember, every Harami is an Inside Bar, but not every Inside Bar is a reversal. An Inside Bar in an uptrend is a continuation signal, not a reversal. Confusing the context leads to trading in the wrong direction.
- Entering without confirmation: Jumping in immediately after the baby candle closes is risky. Without a volume spike or a third bullish candle to confirm the shift, you are vulnerable to a “dead cat bounce” or a continuation of the downtrend.
11. Which Scanners and Tools Can Automatically Detect the Pattern?
Manually scanning charts is inefficient. Leverage specialized tools to scan raw price data and instantly find high-probability Harami setups across thousands of assets.
TradingView (All Candlestick Patterns): Use the built-in indicator named “All Candlestick Patterns”.
- Add it to your chart, go to settings, and check the box for “Bullish Harami”. The chart will automatically label every valid pattern with a “BH” tag in real time.
MT4/MT5 Custom Indicators: The MetaTrader marketplace offers specialized plugins like “Pattern Graphix” or “ZUP”.
- These tools scan Forex pairs in the background and can send push notifications to your phone immediately when a Harami forms on your chosen timeframe (e.g., H4 or Daily).
TrendSpider (Market Scanner): Use the “Market Scanner” to build a custom query.
- Set the condition: “Candlestick Pattern = Bullish Harami” AND “RSI < 30”. This instantly filters out low-quality setups and presents you with only the most oversold opportunities.
FinViz (Stock Screener): Free stock screener for US markets.
- Go to the “Screener” tab → Select “All” → Under the “Signal” dropdown menu, choose “Harami”. This lists all stocks currently forming the pattern.
LuxAlgo (AI Detection): This premium script uses advanced pattern recognition algorithms to detect setups on the candlestick chart and assigns a “Confidence Score” based on historical win rates.
12. Frequently asked questions about Bullish Harami Pattern
Quick answers to the most common questions traders have about this reversal pattern.
13. Conclusion
The Bullish Harami pattern is a powerful tool for spotting market bottoms, but its simplicity on the candlestick chart can be deceptive. A valid reversal requires more than just two candles; it demands the “Perfect Storm” of support confluence, volume validation, and momentum divergence. By waiting for these confirmations instead of rushing in, you turn a common pattern into a high-probability trading edge.
Ready to master the markets? Stop guessing and start trading with precision. Follow Piprider today for professional insights and advanced trading strategies to grow your portfolio.


