
Price charts only tell part of the story. What if you could see the conviction behind price movements, the actual buying and selling force that fuels a trend?
The Chaikin Oscillator (CO) is a powerful technical indicator designed to do precisely that. It moves beyond price alone to analyze the momentum of money flowing into or out of an asset. By measuring the rate of change of the Accumulation/Distribution Line (ADL), it offers a crucial perspective on a trend’s health and sustainability.
This in-depth guide will break down the mechanics of this sophisticated tool. We will explore its core components, clarify its formula, and demonstrate actionable trading strategies with clear examples, giving you the confidence to integrate it into your Forex analysis.
Key Takeaways
- The Chaikin Oscillator measures the momentum of buying and selling pressure.
- It helps traders spot potential trend reversals or confirm existing trends.
- Signals often occur when the oscillator crosses the zero line, indicating a shift in market control.
- Bullish or bearish divergences between the oscillator and price can predict upcoming trend changes.
- Like most indicators, it’s most effective when combined with other analysis methods for confirmation.
1. What is the Chaikin Oscillator?
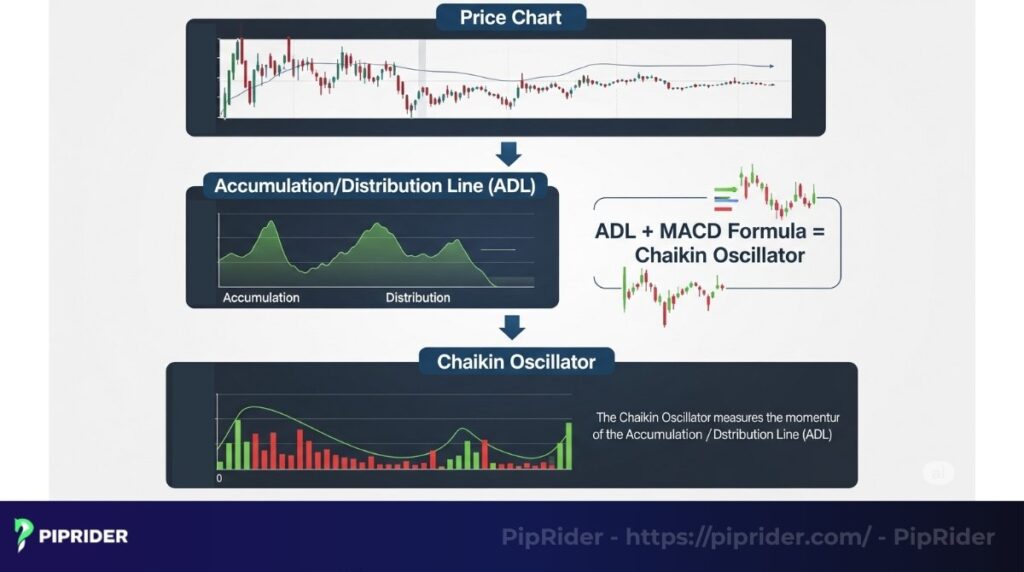
The Chaikin Oscillator (CO) is a technical indicator developed by Marc Chaikin that measures the momentum of the Accumulation/Distribution Line (ADL). It essentially applies the MACD formula to the ADL, quantifying the underlying buying and selling pressure.
By analyzing the rate of change in money flow, the CO helps traders identify potential trend reversals and confirm the strength of existing trends, offering a volume-based perspective distinct from price-based tools like the True Strength Index.
2. The components of the Chaikin Oscillator
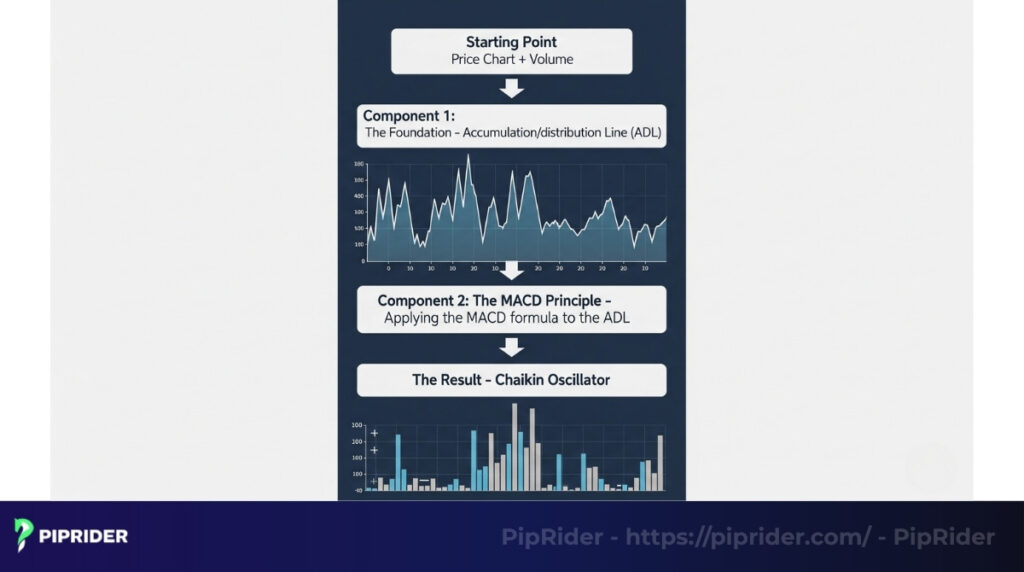
To master the Chaikin Oscillator, you must recognize it as a two-layer system, not a single calculation. The indicator first uses the Accumulation/Distribution Line (ADL) as its foundation to measure money flow. It then applies the well-known MACD framework to this ADL data to calculate its momentum.
2.1. The Accumulation/Distribution Line (ADL)
The entire calculation of the Chaikin Oscillator is driven by the ADL, which serves as its exclusive data source. The ADL is a volume-weighted indicator that maintains a running total of money flowing into or out of an asset.
It trends upward when an asset closes in the upper portion of its trading range (signaling accumulation) and trends downward when it closes in the lower portion (signaling distribution).
2.2. The Moving Average Convergence-Divergence (MACD) Principle
The Chaikin Oscillator borrows its mathematical structure from the MACD. Similar to the logic used in the percentage price oscillator, it calculates the spread between a fast Exponential Moving Average (EMA) and a slow EMA to gauge momentum. However, instead of applying this to the asset’s price, Chaikin applied it directly to the ADL.
This is why the indicator is often called the “MACD of the Accumulation/Distribution Line”.
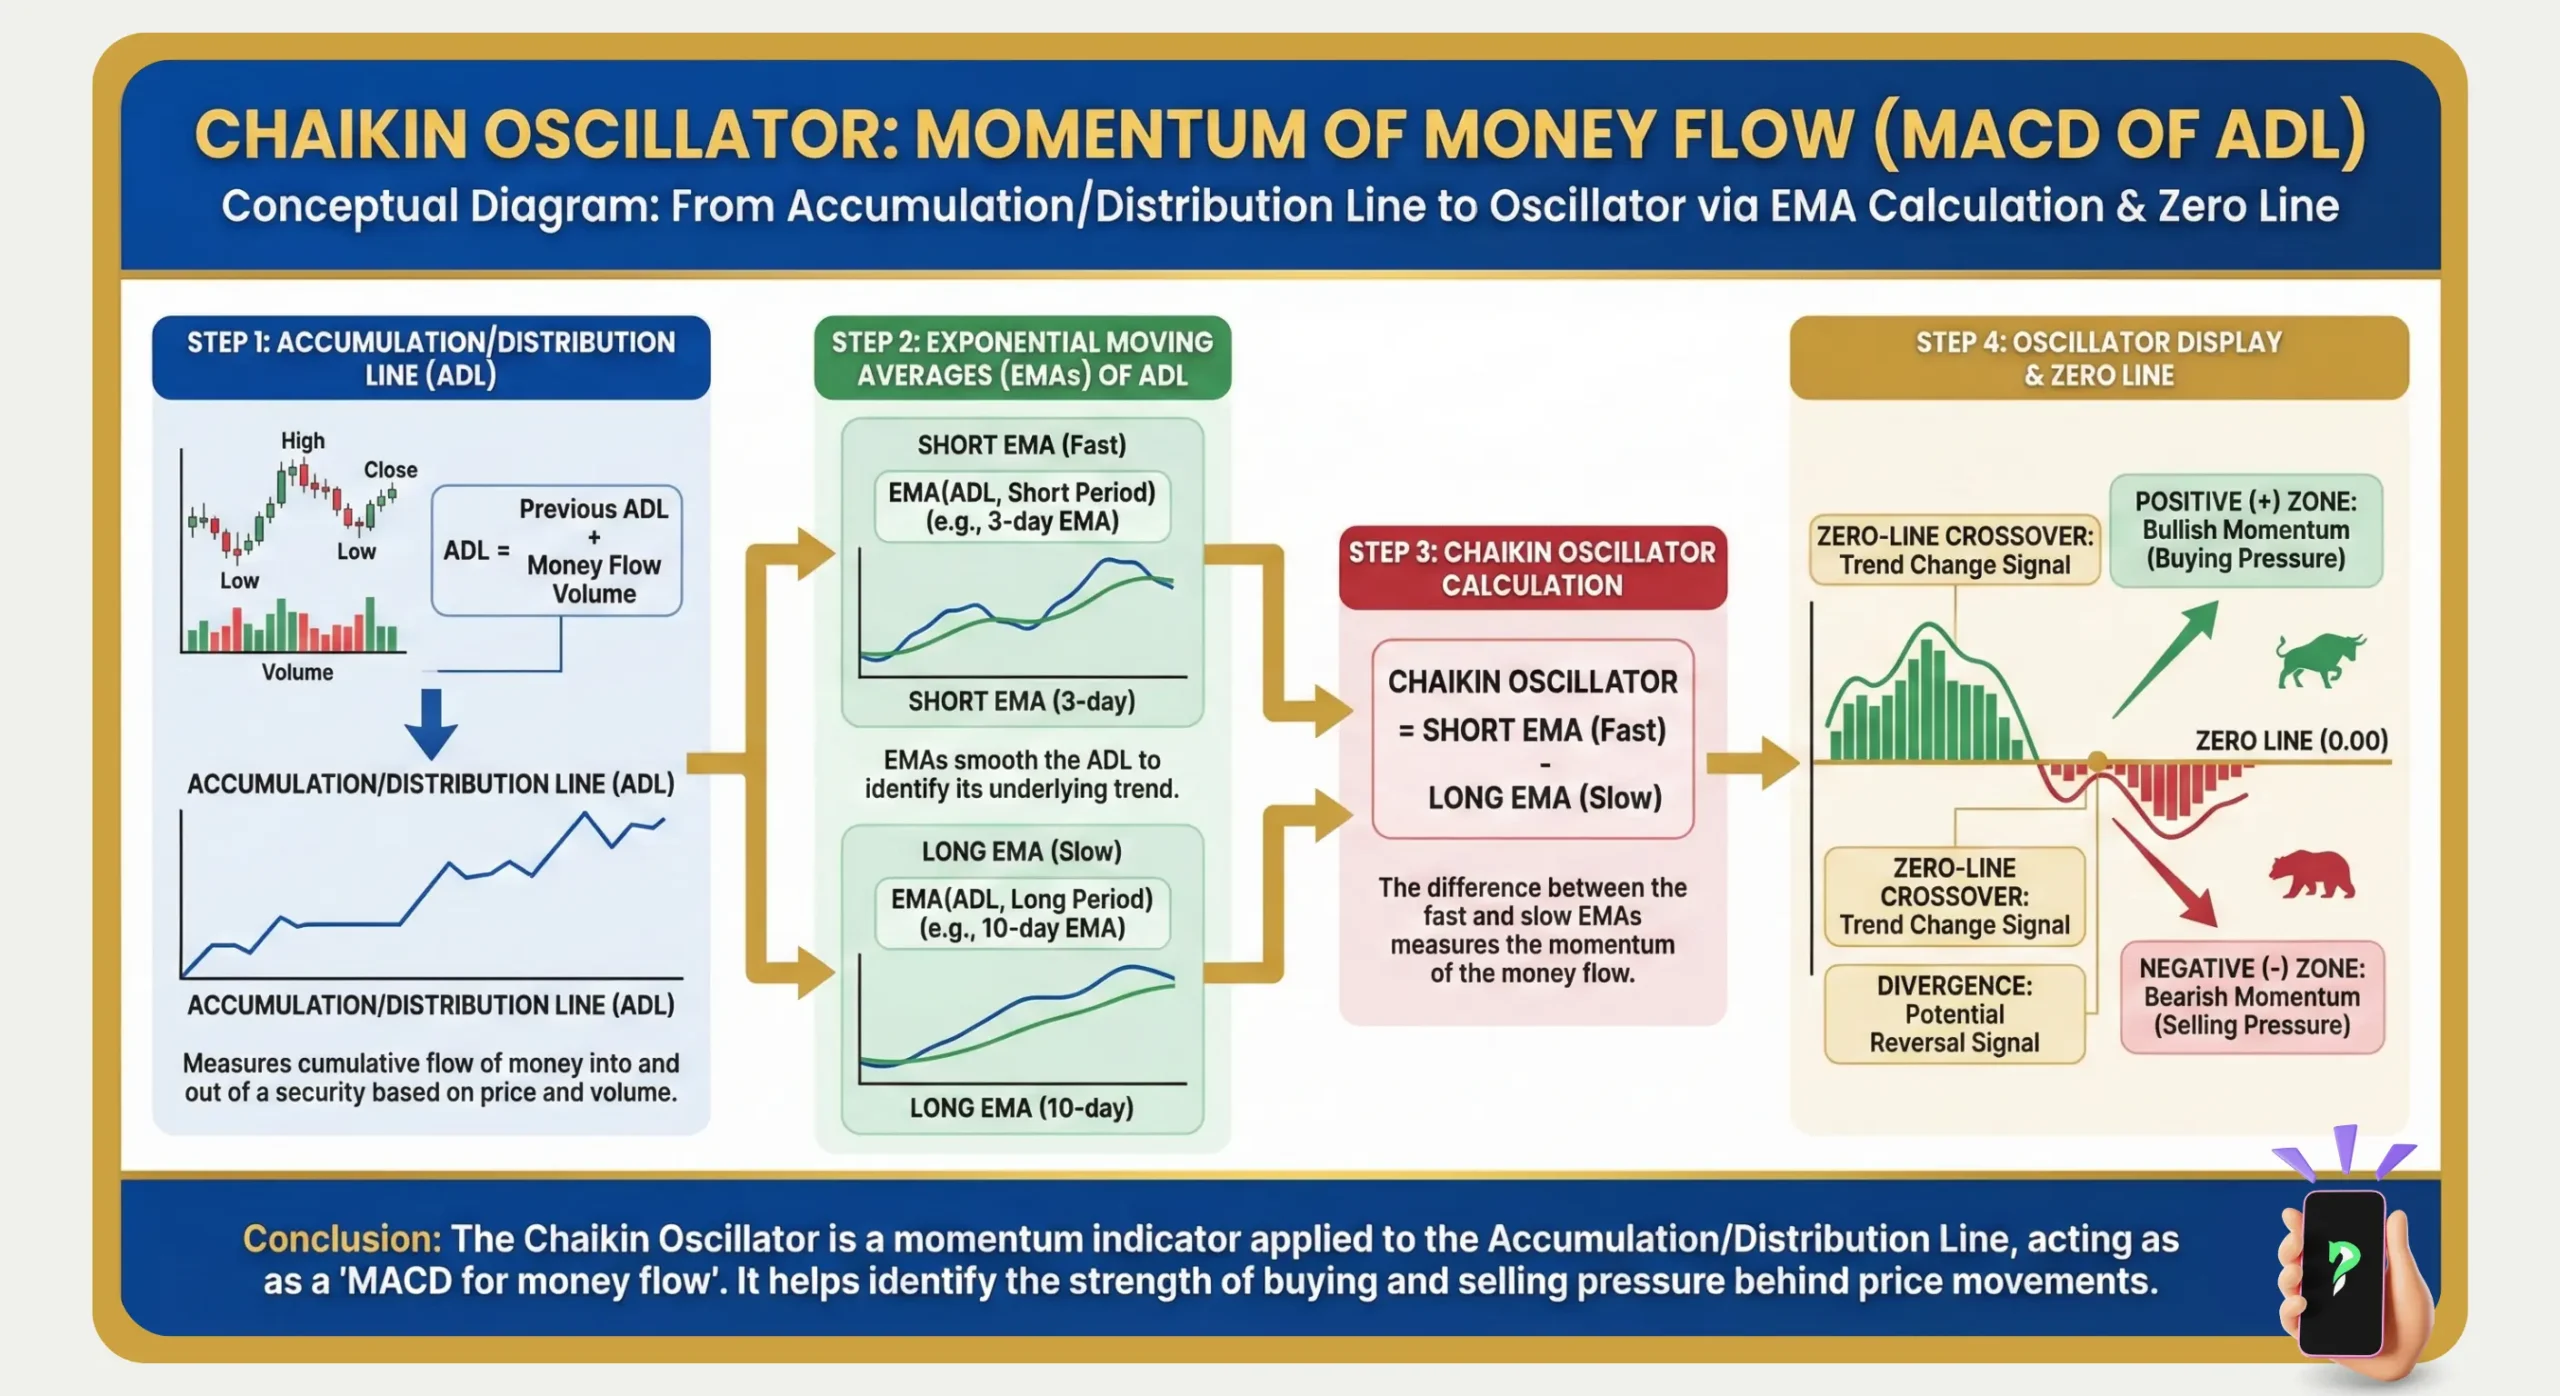
3. The calculation formula of the Chaikin Oscillator
The formula for the Chaikin Oscillator translates raw price and volume data into a sophisticated momentum reading. The calculation is a multi-stage process that first computes the foundational Accumulation/Distribution Line before using exponential moving averages to measure how quickly it is changing.
Step 1: Calculating the Accumulation/Distribution Line (ADL)Before the oscillator can be derived, the ADL must be calculated for each period in two steps:
- The formula for the Money Flow Multiplier is: [(Close – Low) – (High – Close)] / (High – Low)
- The period’s Money Flow Volume is then: Money Flow Multiplier x Volume
- The ADL value is then derived by maintaining a running sum of the Money Flow Volume from one period to the next.
Step 2: The Chaikin Oscillator FormulaThe final oscillator value is determined by this formula, using standard 3- and 10-period EMAs:
- Chaikin Oscillator Value = (3-period EMA of the ADL) – (10-period EMA of the ADL)
- This final value reveals not only the direction of money flow (via the ADL) but, more importantly, the momentum behind that flow.
4. How to interpret the Chaikin Oscillator on a Forex chart
Reading the Chaikin Oscillator involves more than just noting its value; it’s about interpreting its position, direction, and amplitude. To analyze its signals correctly on a Forex chart, you must focus on its relationship with the central zero line and understand what the height and depth of its waves signify about market conviction.
- The Zero Line: The line of equilibriumThe zero line is the most critical reference point, representing a balance between buying and selling momentum.
- CO in positive territory (> 0): A reading above the zero line indicates that bullish forces are prevailing and buying pressure is the dominant market force.
- CO < 0 (negative territory): When the oscillator is below zero, it confirms that bearish momentum is in control and selling pressure is dominant.
- Magnitude and directionThe absolute value (or distance from zero) of the oscillator indicates the intensity of the momentum. A high positive reading suggests strong, accelerating buying pressure.
Conversely, a sharp fall toward the zero line, even while the reading is positive, suggests that bullish force is waning. Monitoring the oscillator’s peaks and troughs can provide early warnings of a power shift.
5. 2 effective trading strategies using Chaikin Oscillator
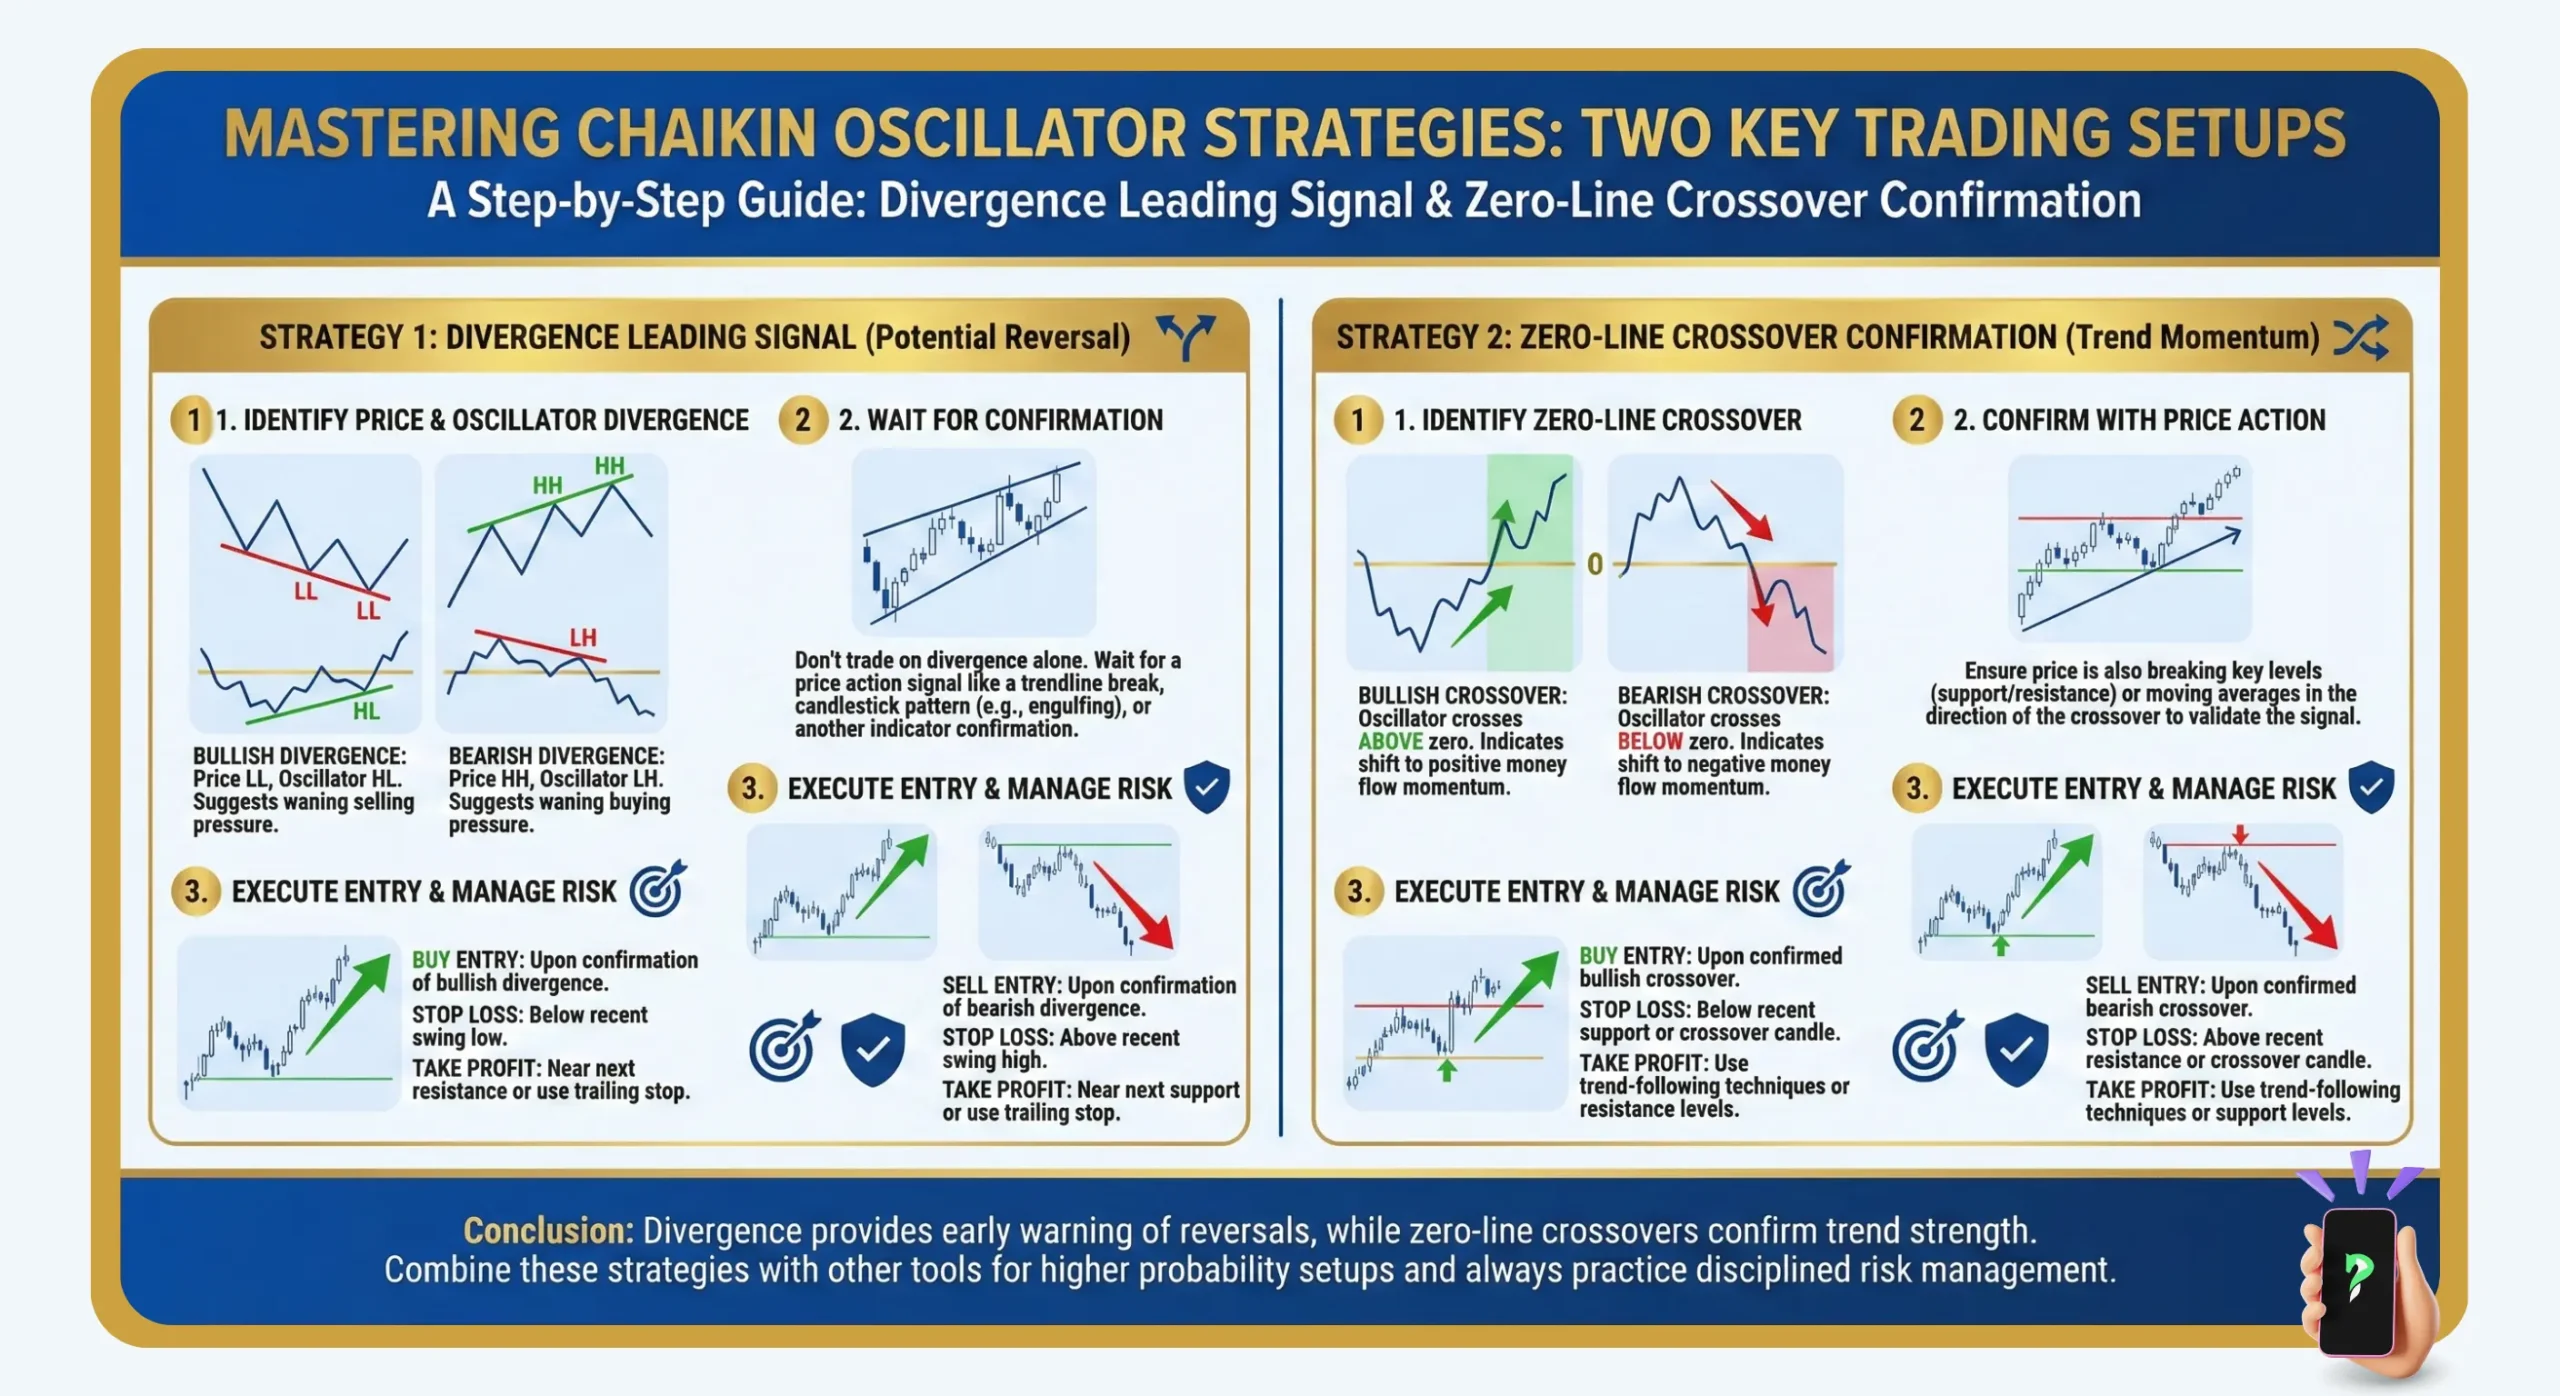
While the Chaikin Oscillator provides valuable market intelligence, its true power is unlocked through clear, actionable trading strategies. The indicator is best known for generating two primary signal types: powerful leading signals via divergences and reliable confirming signals through its zero line crossovers.
5.1. Price-oscillator divergence (A leading signal)
Divergence is arguably the most potent signal from the Chaikin Oscillator because it can foreshadow a price reversal. It occurs when there is a disconnect between price action and the underlying money flow.
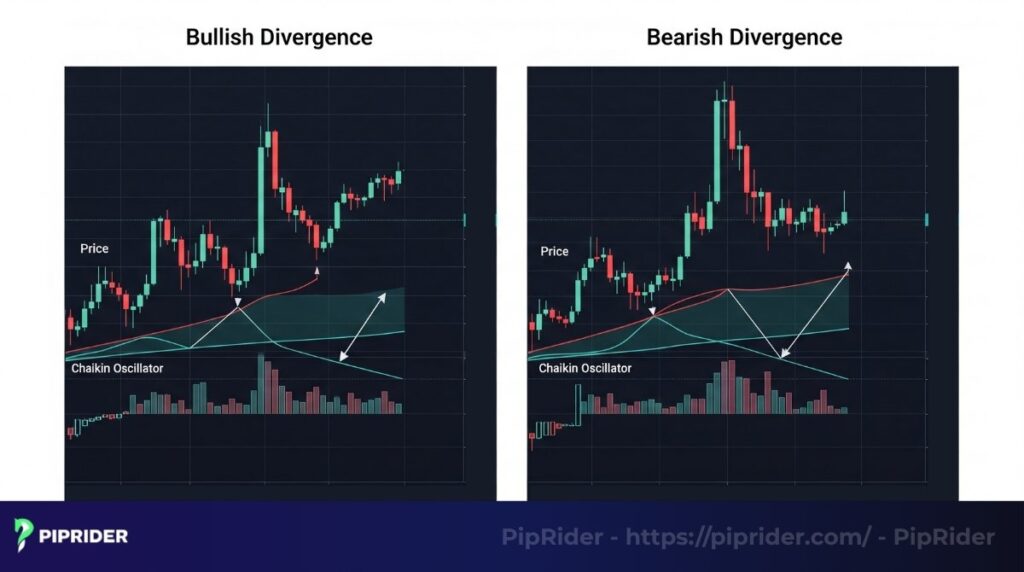
- Bullish Divergence: The price prints a new lower low, but the oscillator forms a higher low. This pattern strongly suggests that even as prices fall, the underlying selling force is weakening, signaling that the downtrend is potentially running out of momentum.
- Bearish Divergence: The price forges a new higher high, but the oscillator creates a lower high. This serves as a warning that even as the price climbs, buying pressure is weakening, making the uptrend vulnerable to a reversal.
5.2. Using the zero line crossover for confirmation
This signal is less of a predictive tool and more of a confirmation mechanism, as it inherently lags behind price action.
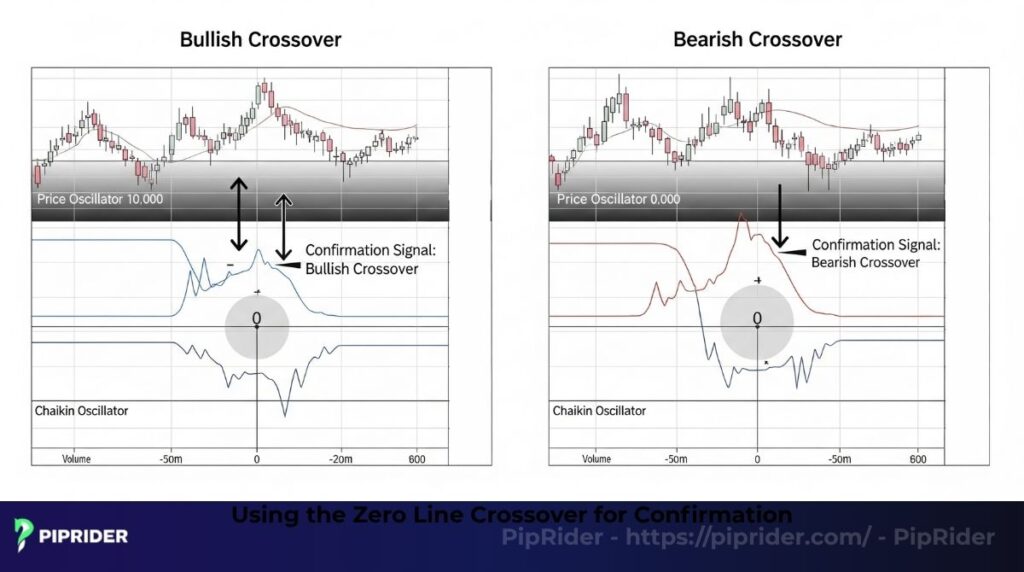
- Bullish Crossover (Buy Signal): The oscillator crossing from negative to positive territory confirms that the momentum of money flow has officially shifted in favor of the buyers. Traders frequently use this crossover to confirm the validity of a preceding bullish divergence.
- Bearish Crossover (Sell Signal): The oscillator crossing from positive to negative territory confirms that selling pressure has overwhelmed buying pressure. Such a crossover can serve as confirmation to either exit a long position or initiate a new short trade.
Summary of two Chaikin Oscillator trading strategies
| Strategy | Signal Type | Summary |
| Divergence | Leading | Detects a discrepancy between price action and money flow, signaling a potential reversal. |
| Bullish Divergence | Reversal to bullish | Price makes a lower low while the oscillator makes a higher low. |
| Bearish Divergence | Reversal to bearish | Price makes a higher high while the oscillator makes a lower high. |
| Zero-Line Crossover | Confirmation | Confirms a shift in money flow momentum. |
| Bullish Crossover | Buy Signal | The oscillator crosses from negative to positive territory, confirming that money flow has shifted to favor buyers. |
| Bearish Crossover | Sell Signal | The oscillator crosses from positive to negative territory, confirming that selling pressure has overcome buying pressure. |
6. A practical walkthrough: Trading with the Chaikin Oscillator
Theory is one thing, but seeing an indicator in action solidifies your understanding. This section provides a practical, step-by-step example on a real currency pair, showing how to combine a divergence signal with a crossover for a high-probability trade setup. Based on my personal experience, this is the most effective way to use this indicator.
Context: We’re analyzing the EUR/JPY chart on the 4-hour (H4) timeframe. The currency pair has been in a distinct upward trend.
- Step 1: Observation (The Divergence): The price of EUR/JPY rallies to create a new high. However, looking at the Chaikin Oscillator below, the corresponding peak is visibly lower than the previous one. This forms a classic bearish divergence, providing an initial signal that buyers’ dominance may be waning.
In my experience, a divergence is a powerful warning, but it’s only an early alert. Acting on divergence alone can lead to false signals, which is why confirmation is so important.
- Step 2: Confirmation (The Crossover): An aggressive trader might act on the divergence alone, but a conservative one waits for more proof. A few candles later, the oscillator pushes downward and crosses below the zero line.
This is the most crucial step that I always follow. It confirms that selling momentum has now truly taken over. This crossover signal helps filter out “fake divergences” and ensures that the shift in money flow is strong enough to potentially reverse the price trend.
- Step 3: Execution (The Trade): With both a leading signal (divergence) and a confirming signal (crossover), the setup is robust. A trader could now enter a short (Sell) position, placing a protective stop-loss above the recent swing high in price.
My personal advice is to always combine the Chaikin Oscillator with your overall market analysis. Consider key support and resistance levels, and don’t take trades that go against the prevailing trend on a higher timeframe. The Chaikin Oscillator is a fantastic tool for finding reversal points, but it works best when it’s aligned with other technical indicators and a broader market context.
Read more:
How to Trade Using the DeMarker Indicator Strategies
3 Proven Trading Methodologies using the CCI Trading Strategy in Forex
7. Pros and cons of the Chaikin Oscillator
Like any tool in technical analysis, the Chaikin Oscillator has its own set of strengths and weaknesses and is not infallible. To use this tool effectively and manage risk, it is vital to have a balanced view of both its key strengths and its inherent limitations.
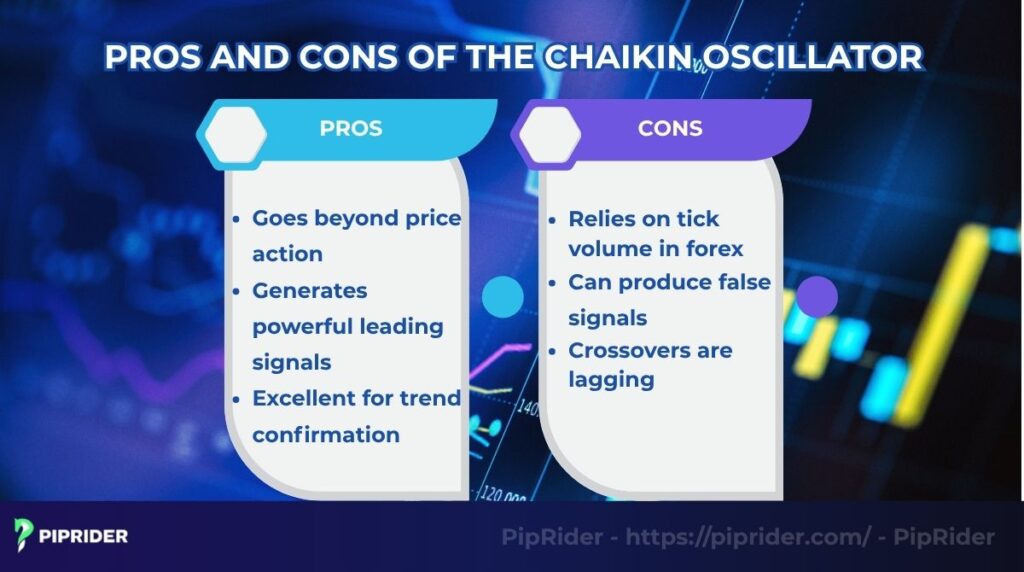
7.1. Pros of the Chaikin Oscillator
- Goes beyond price action: By incorporating volume, it provides insight into the “health” or “conviction” of a trend, which price-only indicators miss.
- Generates powerful leading signals: Its ability to spot divergence can give traders an early warning of trend exhaustion and potential reversals.
- Excellent for trend confirmation: Sustained readings above or below zero can give a trader the confidence to remain in a profitable trade.
7.2. Cons of the Chaikin Oscillator
- Relies on tick volume in forex: Unlike stocks, the Forex market is decentralized and lacks a central volume feed. The indicator uses tick volume (the number of price changes), which is an approximation and can sometimes be less reliable.
- Can produce false signals: In low-volatility or sideways (range-bound) markets, the oscillator can whipsaw across the zero line, creating confusing noise.
- Crossovers are lagging: By design, any EMA-based crossover will confirm a move after it has already begun, which may result in some missed profit.
Read more:
Using Williams %R Indicator with Other Indicators
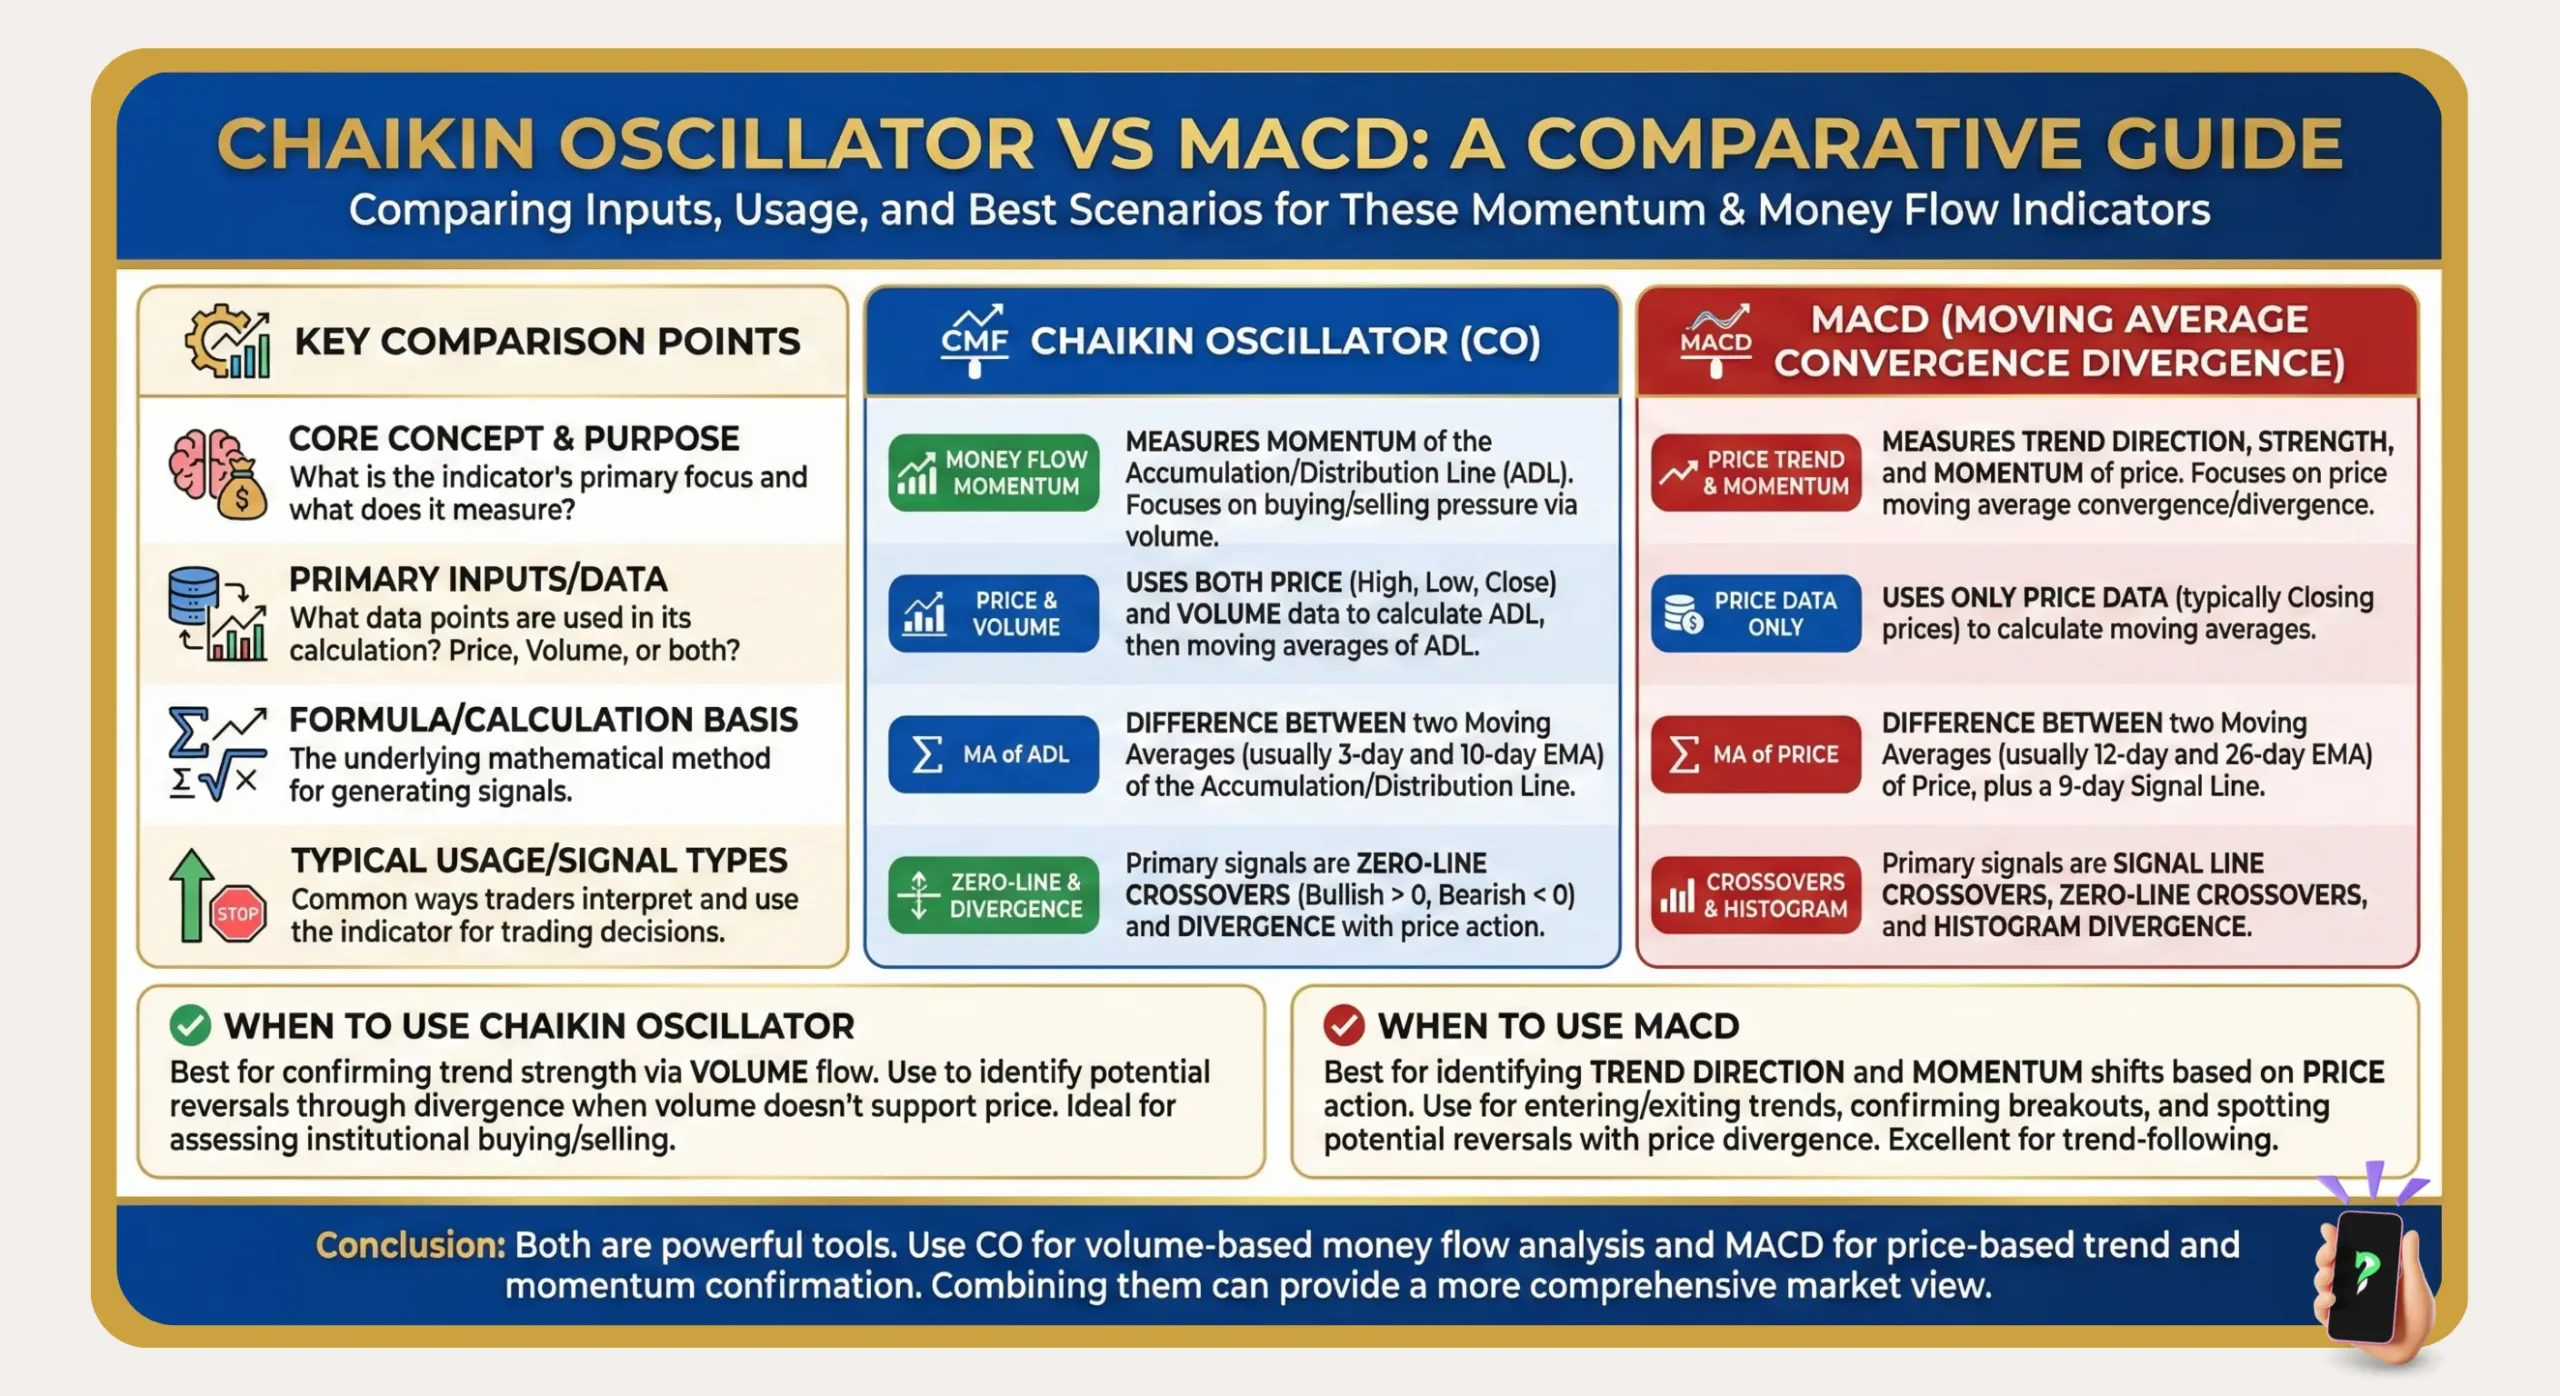
8. Chaikin Oscillator vs. MACD: Which is better for a Forex trader?
Given their similar construction, it’s a classic question: how does the Chaikin Oscillator compare to the more famous MACD? While they share a similar moving average formula, their fundamental difference lies in their input data. This leads them to tell two very different, but equally valuable, stories about the market.
| Feature | Chaikin Oscillator | MACD |
| Data Source | ADL (which incorporates Price & Volume) | Price (typically the Close) |
| What it Gauges | The Momentum of underlying Money Flow | The Momentum of Price changes |
Conclusion: Neither is inherently superior; they are complementary tools. In essence, the MACD reveals the velocity of price changes. The Chaikin Oscillator tells you how strong the conviction is behind that change. For a Forex trader, using the MACD for a primary signal and the Chaikin Oscillator for confirmation can create a powerful synergy. A MACD crossover is far more reliable if the CO is on the same side of the zero line.
9. Tips for applying the Chaikin Oscillator effectively in the Forex market
Understanding how the Chaikin Oscillator works is only half the battle. Applying it effectively in the unique Forex environment requires specific tactics. These expert tips, born from my own trading experience, will help you maximize its strengths while mitigating its weaknesses.
- Always confirm with market structure: The most compelling signals appear when the Chaikin Oscillator confirms a price action event. It’s truly exciting to see a divergence form right at a major historical support or resistance level.
This isn’t just a random signal; it’s the market whispering a story, and the oscillator is helping you hear it clearly.
- Stick to major pairs for reliability: The oscillator’s reliance on volume data makes it most effective on highly liquid major pairs (e.g., EUR/USD, GBP/USD, USD/JPY).
I’ve learned the hard way that using it on exotic pairs can lead to frustration and false signals, as the underlying data simply isn’t robust enough. You want to trade where the big money is flowing, and that’s usually in the majors.
- Understand the market context: The Chaikin Oscillator performs best in trending or reversing markets. In a tight, range-bound market, its signals can feel like a confusing mess. It’s like trying to listen for a specific sound in a noisy room, you have to understand the environment you’re in. Before you even look at the oscillator, ask yourself: Is the market moving? Is there a clear direction?
- Use it for confirmation, not as a crystal ball: This is perhaps the most important lesson I’ve learned. Treat the Chaikin Oscillator as a tool to verify your trading hypothesis, not as a standalone system to blindly predict the future. It’s not a magic bullet, but it’s an incredible ally.
I’ve found that my most confident and successful trades were the ones where the oscillator’s signal simply confirmed what my price action analysis was already telling me. It’s the final piece of the puzzle that lets you pull the trigger with conviction.
10. FAQs
11. Conclusion
Ultimately, the Chaikin Oscillator stands out as a sophisticated tool that enriches technical analysis by incorporating the crucial dimension of money flow dynamics. By mastering its primary signals, the predictive power of divergence and the confirming strength of zero-line crossovers, you can significantly enhance your ability to gauge trend health and anticipate market turning points.
It’s crucial to remember, however, that it represents one component of a comprehensive analysis, not a complete solution in itself. Its signals are most potent when used to confirm insights from other forms of analysis, like price action and market structure. Building proficiency and confidence with this indicator comes from consistent and purposeful practice.
Ready to dive deeper into the world of oscillators? Make sure to follow Piprider and our Best Technical Indicators category for regular updates and valuable insights. Don’t hesitate to leave a comment below with any questions you may have!
Infographic Section
-
Chaikin Oscillator vs. MACD -
Chaikin Oscillator: Momentum of Money Flow -
Mastering Chaikin Oscillator Strategies


