
Have you ever looked at a trend and questioned its endurance? Is it gaining strength, or is it merely running on fumes before a reversal?
The Commodity Channel Index CCI, the brainchild of the brilliant technical analyst Donald Lambert, was engineered to provide answers. Though originally for commodities, the CCI has proven to be a remarkably potent tool in the Forex market, delivering sharp insights into trend velocity and critical turning points.
This guide is designed to be your definitive manual, deconstructing the CCI’s mechanics, its defining features, and three specific, actionable trading strategies crafted for Forex traders.
Key Takeaways
- The CCI calculates how far the current price has strayed from its statistical mean, highlighting moments of exceptional momentum.
- In contrast to the RSI, the CCI is not confined within a set range, enabling it to track powerful market momentum without limitation.
- Breaching these levels signifies that momentum has become statistically significant, going beyond simple overbought or oversold notions.
- When the CCI’s direction conflicts with price action, it can serve as a powerful early warning of a potential trend shift.
- The CCI is a formidable instrument, but its signals gain immense reliability when corroborated by other indicators or price analysis.
1. What is the Commodity Channel Index CCI?
The Commodity Channel Index (CCI) is a momentum-based oscillator introduced by Donald Lambert in the 1980s. While his initial aim was to pinpoint cyclical shifts in commodities, its application has become universal.
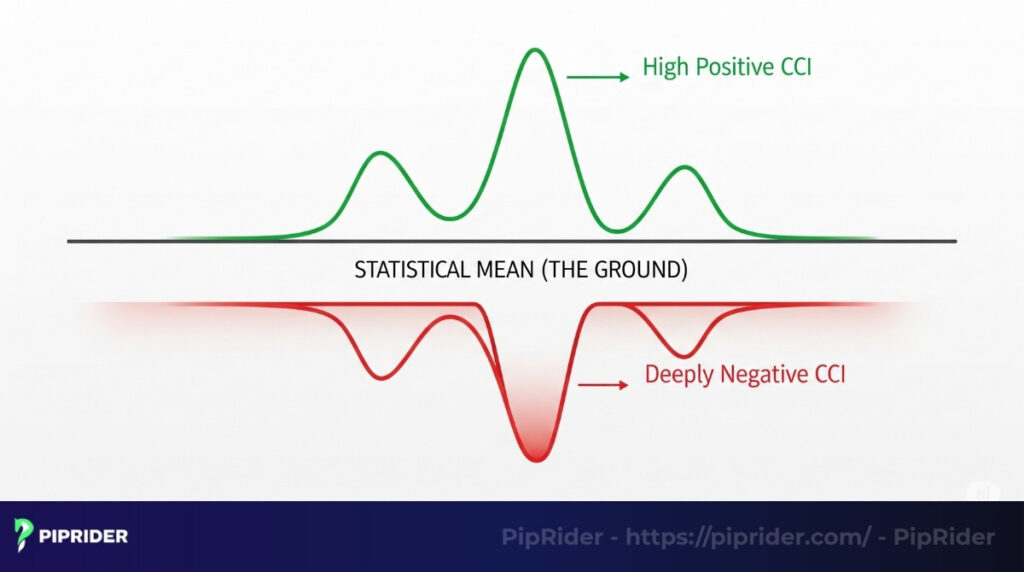
The CCI functions by quantifying the variation of a currency pair’s price from its statistical mean. In short, it tells you just how stretched or compressed the current price is relative to its recent history.
For a Forex trader, this information is invaluable. A high positive CCI value indicates that the price is trading significantly above its mean, which signals powerful bullish strength. In contrast, a deeply negative reading indicates the price has plunged well below its average, pointing to significant bearish pressure.
My own work with the indicator has shown that its greatest strength is in assessing a trend’s sustainability. While a Chaikin Oscillator assesses money flow, the CCI excels at detecting the subtle price momentum shifts that often precede a major market turn.
2. Defining key features of the CCI indicator
The CCI has several distinct traits that set it apart from other oscillators, giving it a unique analytical advantage. To harness its full potential, it’s vital to grasp not just what these features are, but the logic behind Donald Lambert’s design choices.
- A momentum gauge:At its core, the CCI is built to measure the velocity of price. It acts like a speedometer for the market: it doesn’t just show the direction (up or down) but also how fast the price is moving and, critically, whether that speed is increasing or decreasing.
- Unbounded by design:This is its most powerful and defining characteristic. While the Williams Percent Range or RSI is locked into a 0-100 scale, the CCI has no such constraints and can move freely. I’ve analyzed countless Forex trends where the RSI flatlines at 95, providing no new information. The CCI, in the same scenario, can soar to +200 or +300, precisely reflecting that the trend’s underlying momentum is still building.
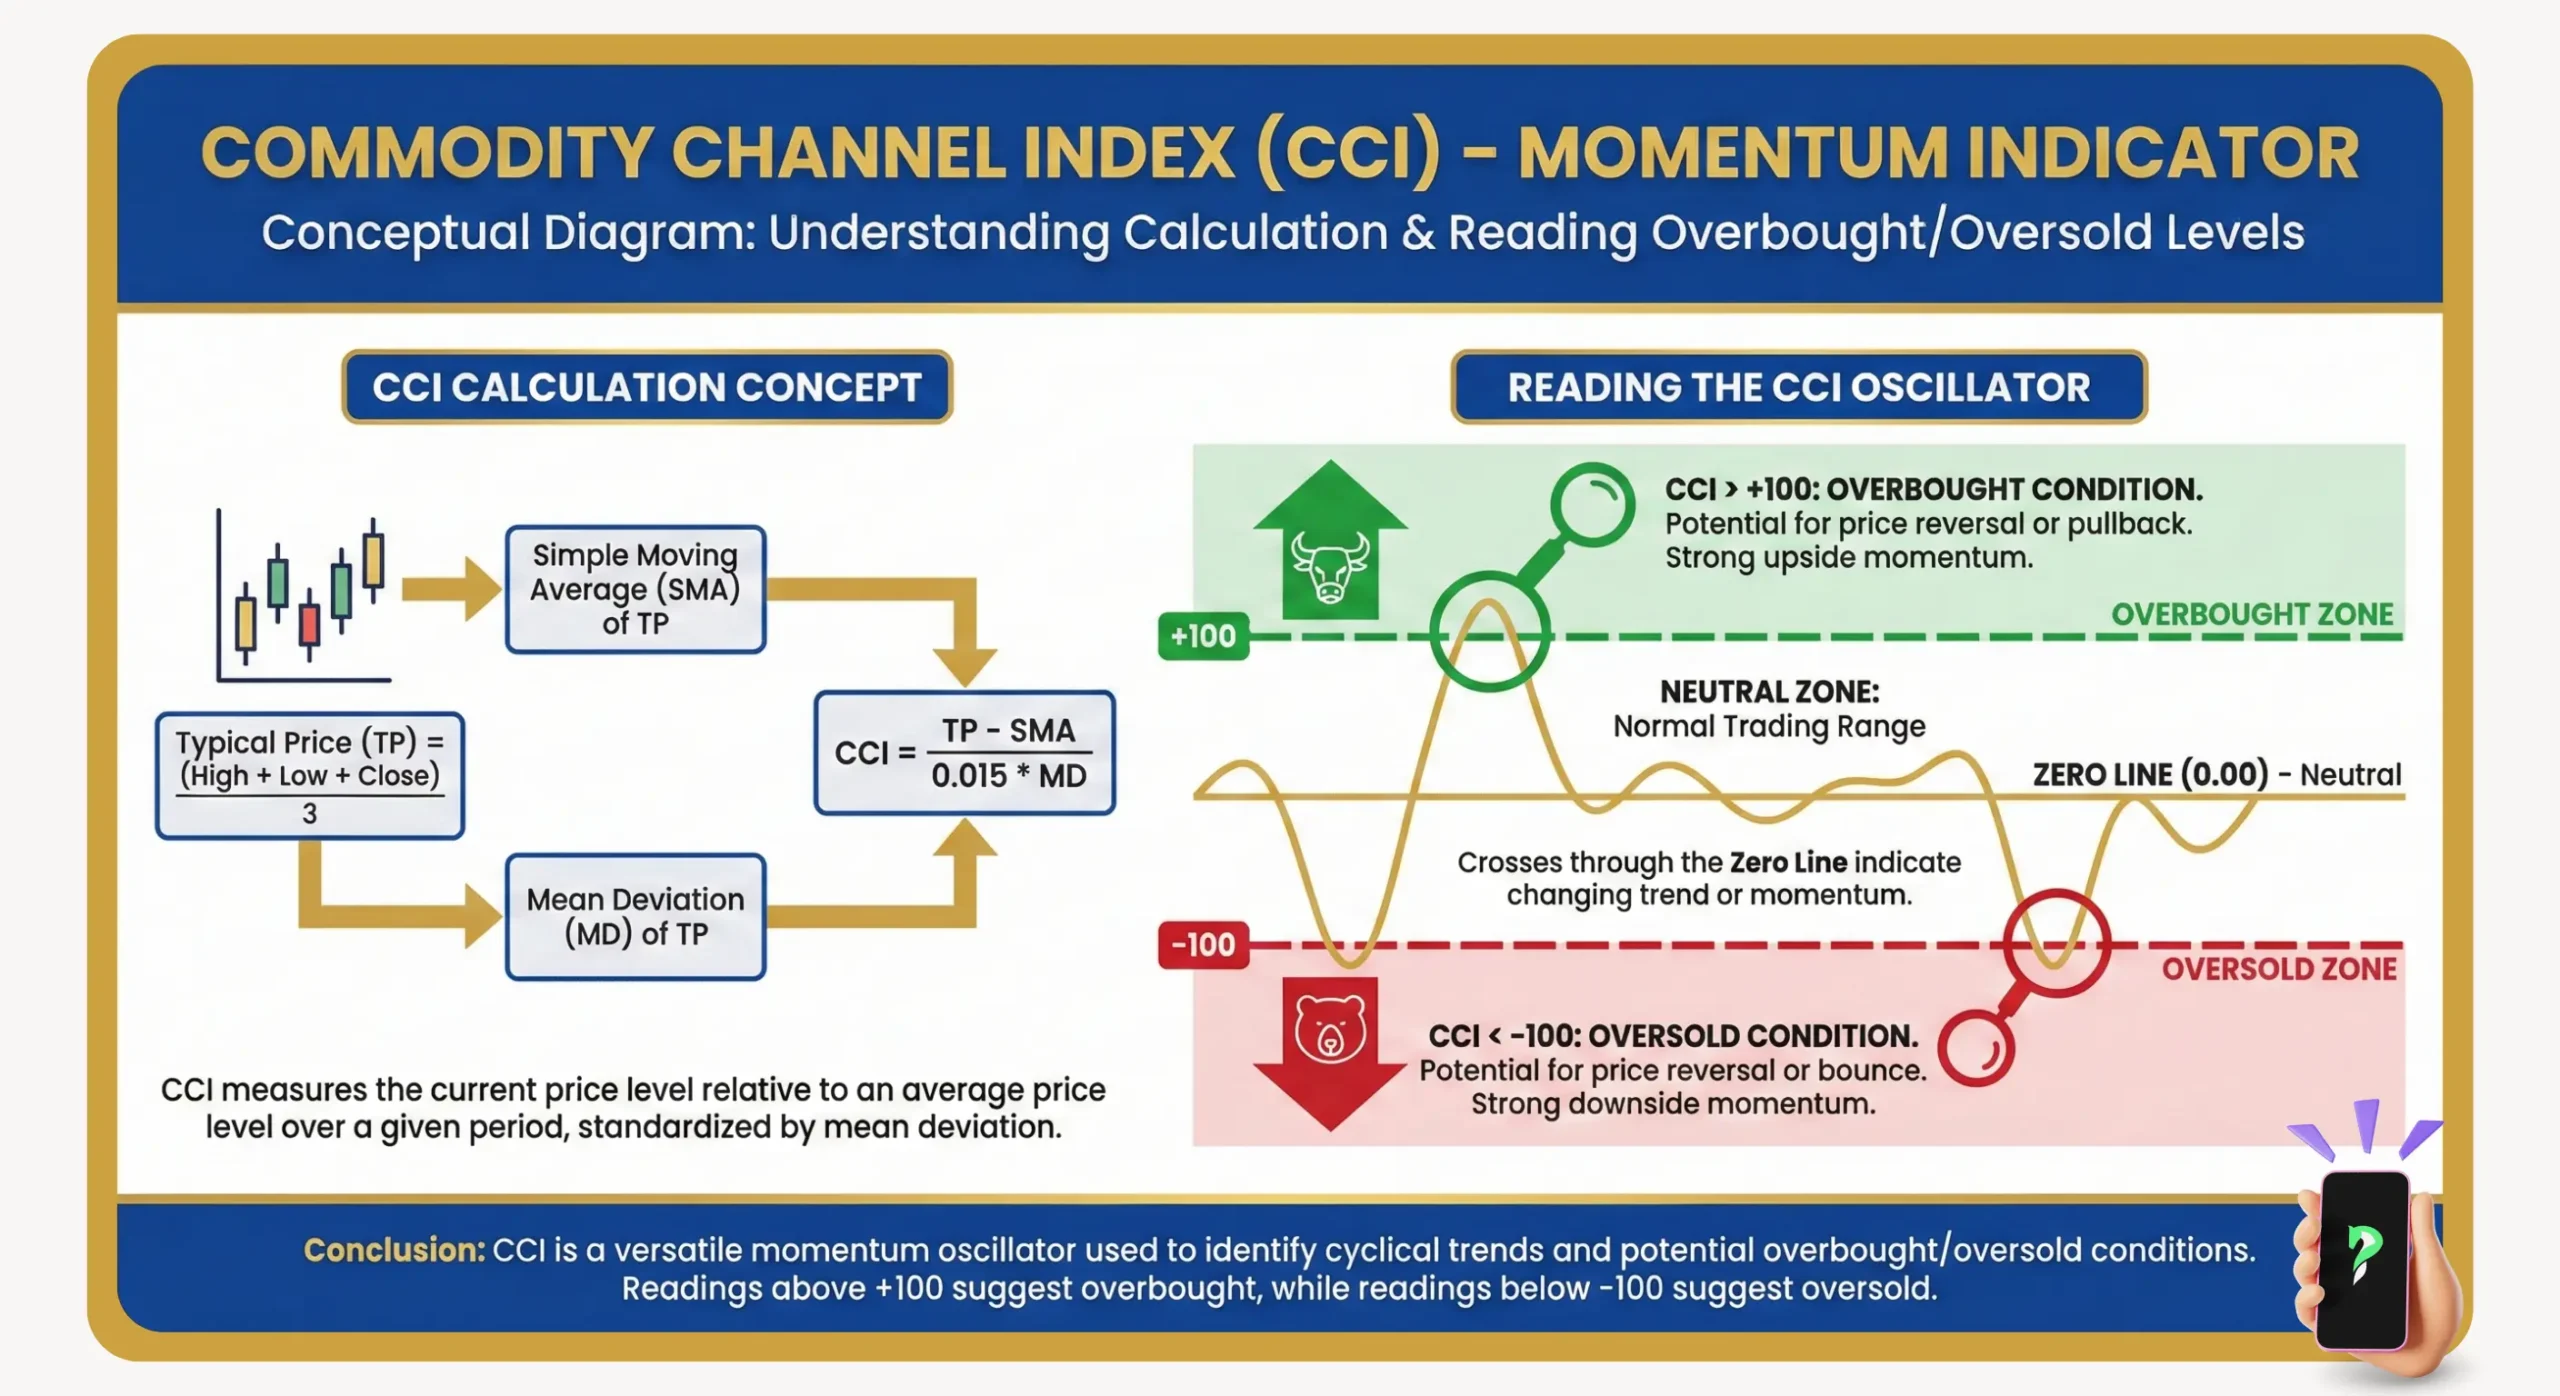
- Focus on the Typical Price:Lambert intentionally built his formula around the Typical Price (High + Low + Close) / 3. As an expert, he understood that relying solely on the closing price could be deceptive due to late-session volatility. By averaging the period’s high, low, and close, the indicator captures a more balanced and authentic measure of true market sentiment.
3. CCI formula: Step-by-step calculation guide
While the complete formula might appear complex, its internal logic is straightforward. The objective is to standardize the gap between the current price and its moving average, enabling consistent comparisons across any instrument or timeframe.
- Step 1: Establish the typical price (TP):First, the Typical Price is calculated for each bar to create a more centered representation of price.
TP = (High + Low + Close) / 3 - Step 2: Establish the baseline with an SMA:Next, an SMA is calculated using the Typical Price data over a specified lookback period (commonly 14 or 20). This SMA serves as our “mean” or baseline value.
- Step 3: Calculate the mean deviation:This step is vital for normalization. It measures the average distance between the Typical Price and its SMA over the lookback period, giving us a gauge of recent volatility.
- Step 4: The final CCI formula:The final value is calculated with Lambert’s original equation:
CCI = (Typical Price – SMA of TP) / (0.015 x Mean Deviation)
The 0.015 constant was a scaling factor selected by Lambert. It statistically ensures that roughly 70-80% of CCI readings remain within the +/- 100 “channel,” making any excursion beyond this zone a statistically significant event demanding a trader’s attention.
Read more:
Interpreting the True Strength Index (TSI) Values
4. How to read and interpret the CCI Indicator
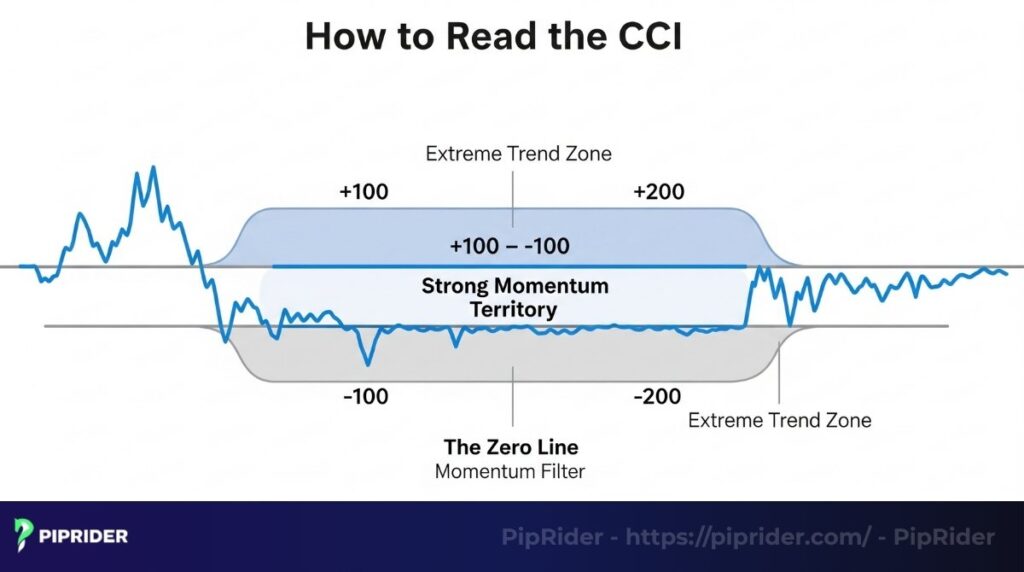
Reading the CCI is like interpreting a narrative about the ongoing tug-of-war between bulls and bears. To do this well, you must understand the three key territories on the indicator: the area around the zero line, the +/- 100 thresholds, and the extreme zones beyond them.
4.1. The zero line
This centerline is a simple momentum filter. In my own trading, I find it invaluable for rapidly assessing the dominant market bias. If you’re considering a long position, you want to see the CCI above zero, confirming that bullish momentum is present. If it’s below, it might be wise to pause and reconsider.
4.2. The +100 and -100 levels
View these not as simple overbought/oversold markers, but as gateways into “strong momentum territory.” A cross above +100 doesn’t scream “sell immediately”; rather, it announces that the uptrend has just demonstrated significant statistical strength.
A frequent novice error is to bet against these moves. Instead, these levels should trigger high alert for either trend continuation or eventual exhaustion.
4.3. Extreme readings (+200, -200 and beyond)
When the CCI ventures into these extreme territories, it signals a powerful, often parabolic trend. I have observed many traders lose capital by attempting to short a market just because the CCI reached +200.
More often, these extreme readings are a clear sign to either find a way to join the trend or to step aside completely, as they indicate a very strong and persistent market consensus.
5. 3 Proven trading methodologies with CCI in Forex
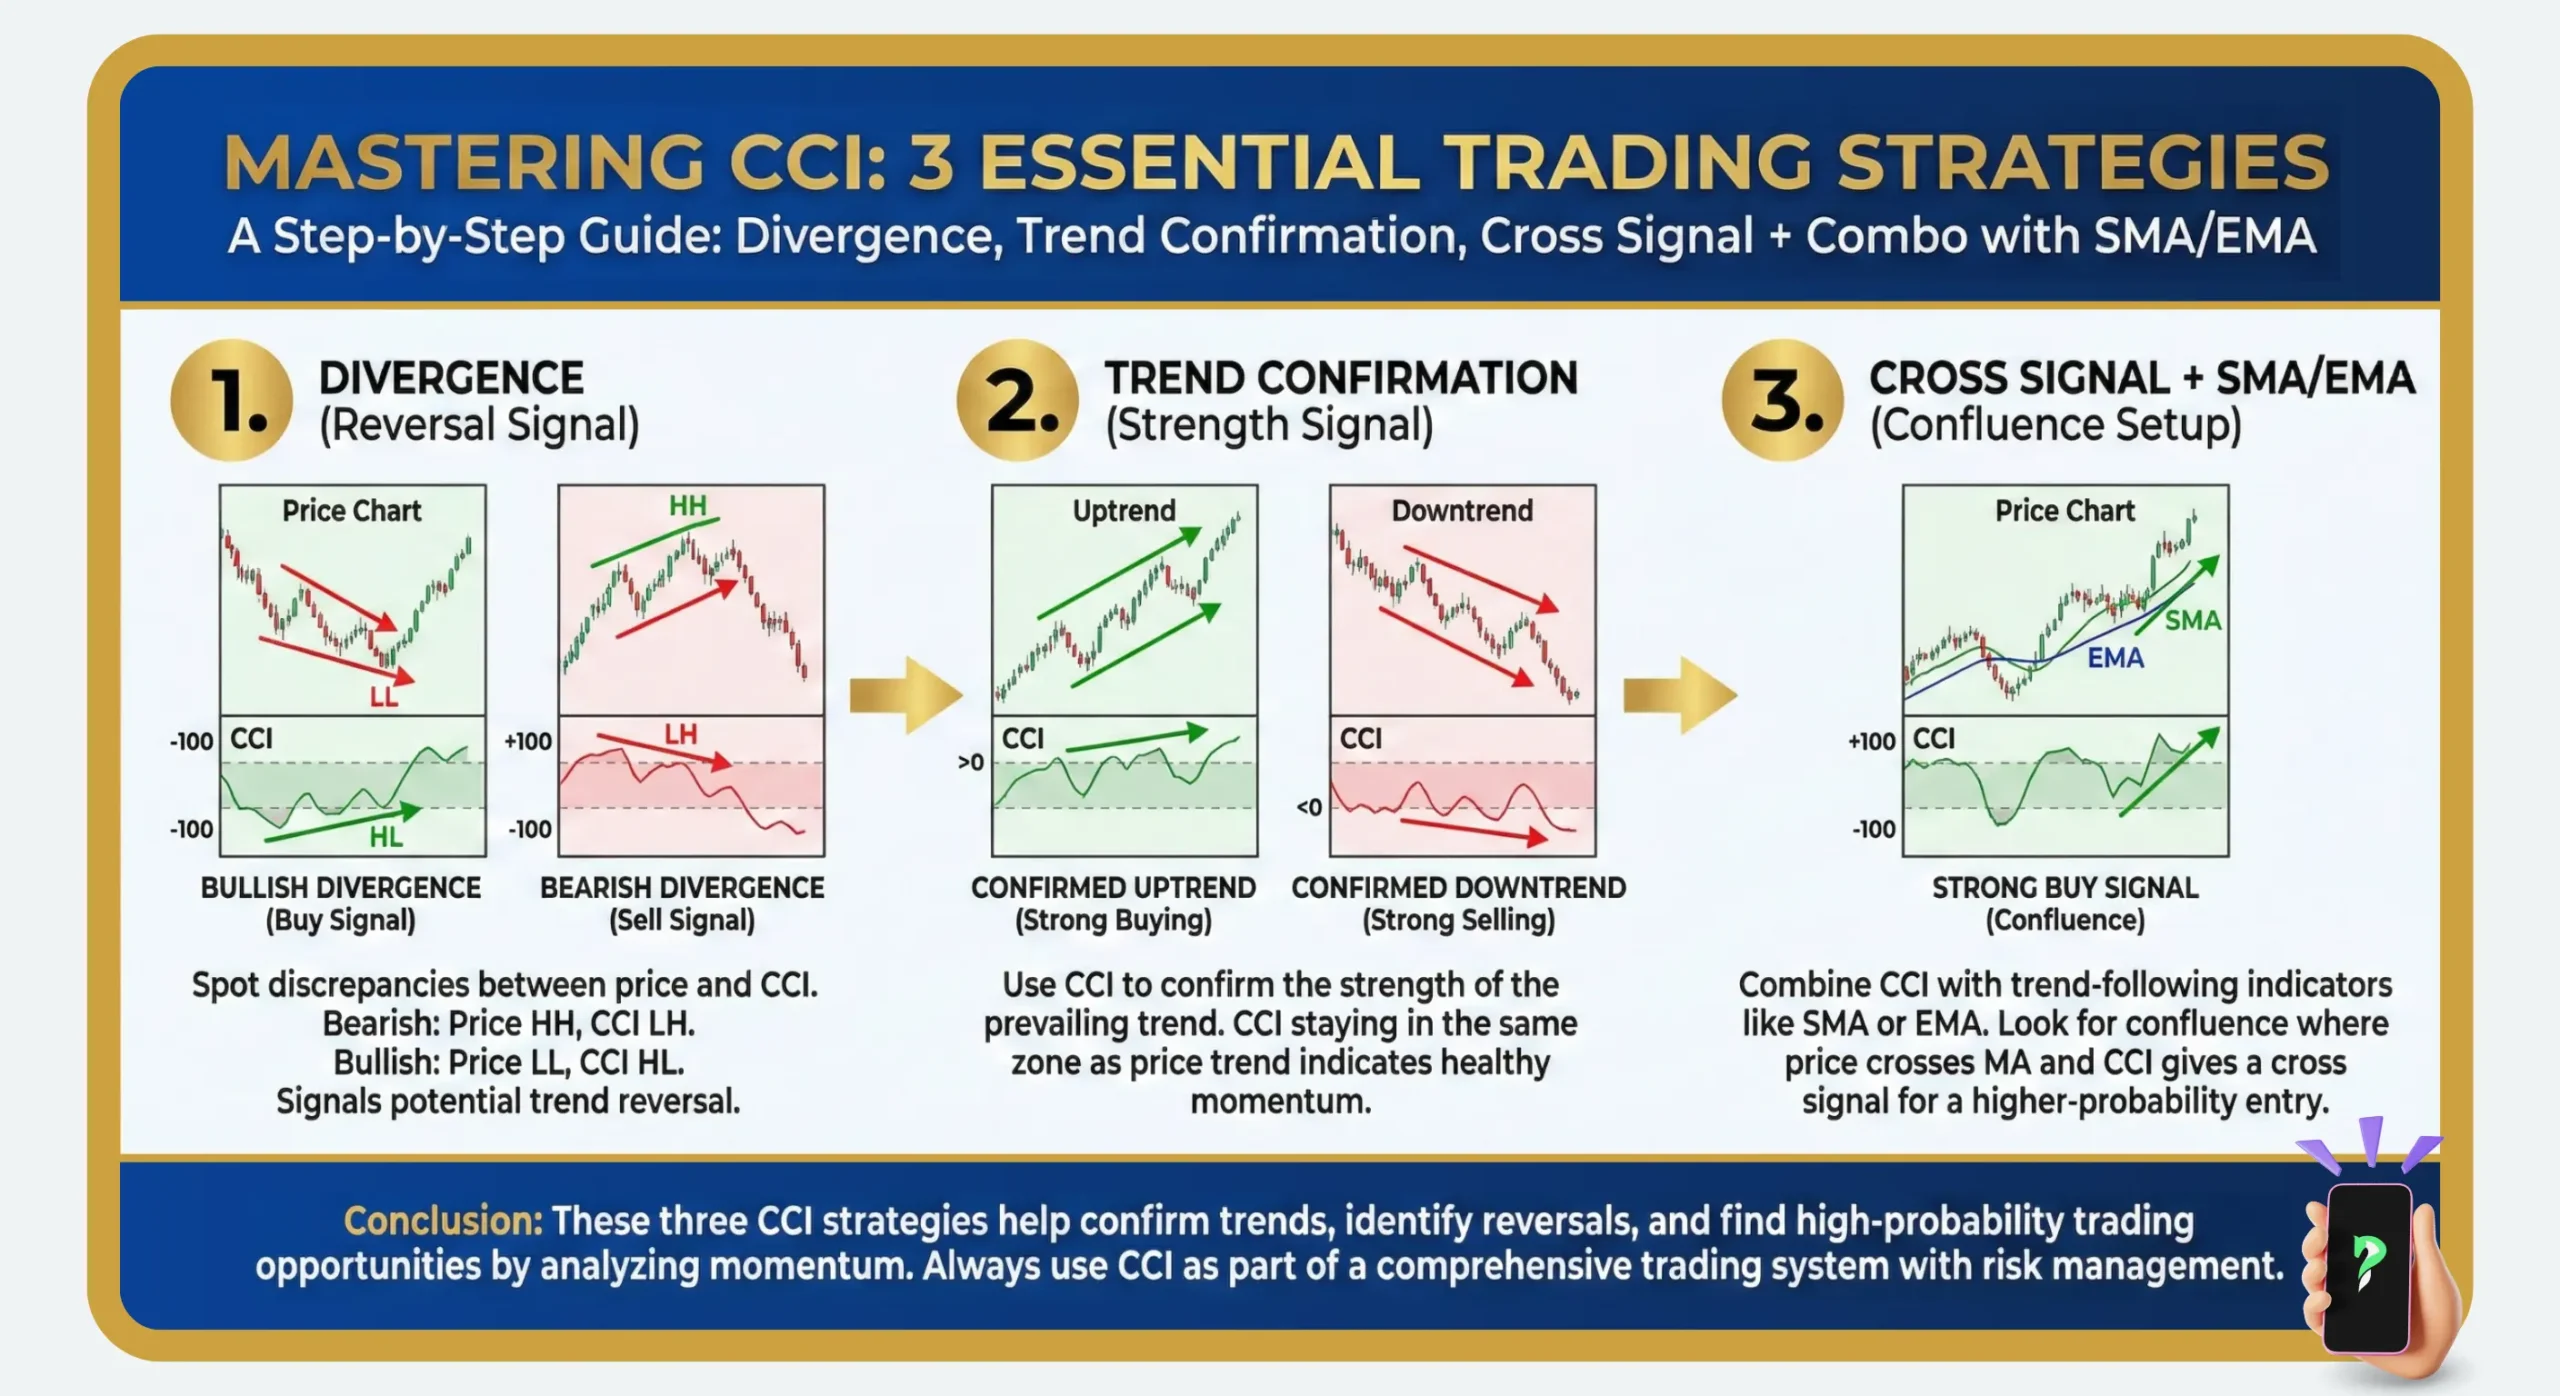
Let’s transition from theory to practice. These three strategies are among the most robust and field-tested methods for applying the CCI in Forex trading, covering reversal patterns and trend-following signals.
5.1. Strategy 1: Trading momentum shifts at the +/- 100 levels
This is the most famous CCI strategy, but it requires patience to execute correctly. The objective isn’t to sell every time the indicator surpasses +100, but to wait for a clear sign that momentum is rotating back. Traders often consult a DeMarker Indicator here to confirm this exhaustion point before entering.
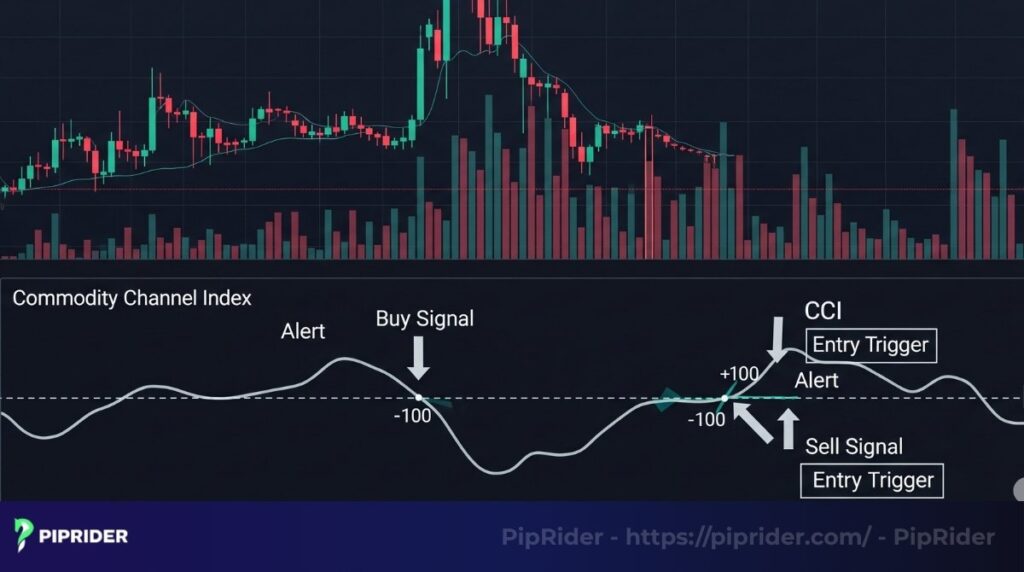
- Buy signal: The setup materializes when the CCI first drops below -100. This is the alert, not the entry. The entry trigger occurs when the CCI then rallies back up across the -100 line. This signals that bearish momentum has likely exhausted itself and buyers are regaining control.
- Sell signal: Similarly, a sell setup emerges when the CCI pushes above +100. You wait for the indicator to subsequently fall back below the +100 level. This suggests the initial bullish surge is losing energy, creating a potential opening for sellers.
5.2. Strategy 2: “Hunting” for reversals with CCI divergence
This specific method is widely regarded as the CCI’s most powerful and forward-looking function. Divergence happens when the indicator’s trajectory contradicts price, exposing a hidden weakness in the prevailing trend.
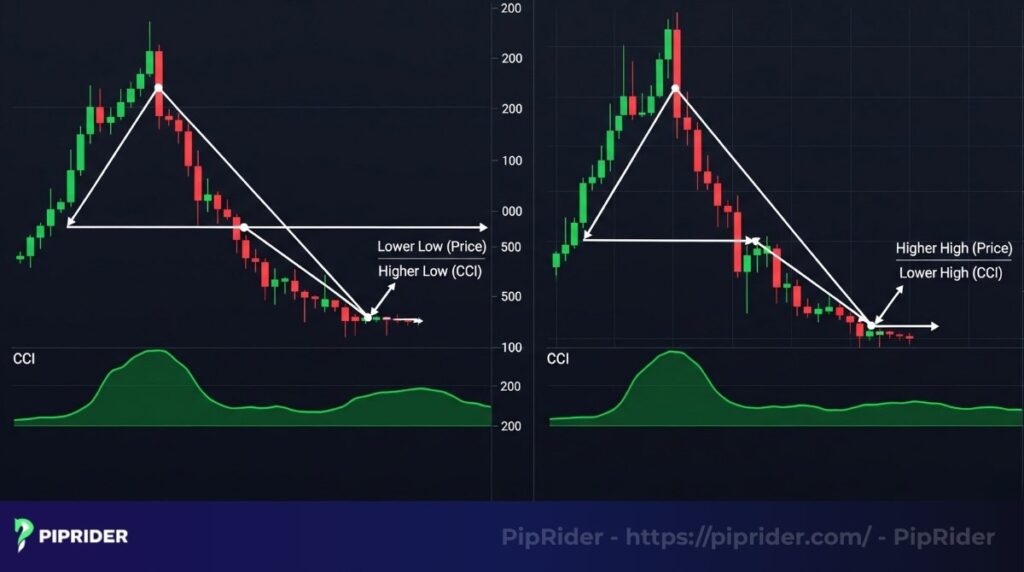
- Bullish divergence: Consider a scenario where a currency pair like GBP/USD carves out a new low, but the CCI fails to follow, instead printing a higher low. This is a classic bullish divergence. It implies that despite the lower price, the underlying selling pressure was significantly weaker on the second attempt, hinting that sellers are becoming exhausted.
- Bearish divergence: The reverse occurs when the price chart forges a new higher high, while the CCI registers a lower high. This is a major warning for bulls. It signals that the rally is built on weakening conviction and is susceptible to a reversal, as buying power is fading even as prices rise.
5.3. Strategy 3: Using the Zero Line Crossover for trend confirmation
This is a more conservative, trend-following approach. Similar to the Percentage Price Oscillator, it employs the zero line as a sharp dividing line between bullish and bearish market phases, offering a simple but powerful confirmation signal.
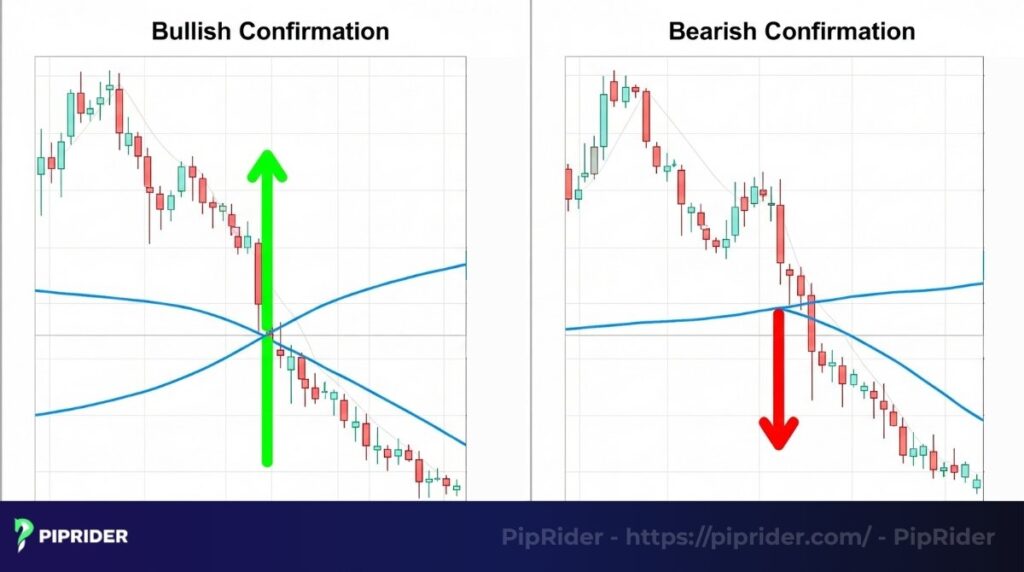
- Bullish confirmation: A cross from below to above the zero line acts as a clear validation that market momentum has officially entered bullish territory. It can be used to endorse a long entry following a bullish divergence or to join a newly forming uptrend.
- Bearish confirmation: A cross from above to below the zero line confirms that sellers have seized momentum. This signal is often used to activate a short entry or to affirm that it is time to exit an existing long position.
6. Optimizing CCI settings for Forex trading
While the default settings are a superb starting point, experienced traders can calibrate the indicator for their chosen timeframe and trading style. This adjustment involves a trade-off between responsiveness and signal clarity.
- Standard settings: The most widely used settings are a 14-period or 20-period CCI. Based on my analysis, a 20-period CCI on a 4-hour or daily chart offers a dependable equilibrium, filtering out market noise while remaining responsive to major momentum shifts.
- When to adjust settings?
- Shorter periods (e.g., 5-10): A shorter lookback will make the CCI much more sensitive to price fluctuations. A scalper on a 5-minute chart might use a 10-period CCI to capture rapid momentum spikes, but must be prepared for a higher number of false signals.
- Longer periods (e.g., 30-50): A longer period significantly smooths the indicator, reducing its sensitivity. A long-term position trader on a weekly chart might employ a 50-period CCI to isolate only the most dominant, primary trend shifts.
- My recommendation: I always advise traders to begin with the default (20) and master its nuances first. Only after you deeply understand its behavior should you explore alternative settings, and always validate them with thorough backtesting on a demo account.
To help you decide which CCI settings are right for your trading style, here’s a detailed comparison of how the indicator is best applied across different trading methodologies.
| Criteria | Scalping | Day Trading | Swing Trading |
| Main objective | To capture very small price movements (a few pips) quickly and frequently. | To capture the main price wave within a single trading session, opening and closing positions within the day. | To hold a position for several days to weeks to ride a major market swing. |
| Time frame | M1, M5, M15 (Most common: M5) | M15, M30, H1 (Most common: H1) | H4, D1, W1 (Most common: D1) |
| CCI period | 5 – 10 (Start with 10) – Very sensitive | 14 – 20 (The default of 20 is a good choice) – Balanced | 30 – 50 (Start with 50) – Smoother, filters out noise |
| Core strategy | Trade quick reversals when the CCI reaches extreme zones (+200 / -200) and starts to hook back. | Apply classic strategies: wait for the CCI to reverse from the +/- 100 zones, look for clear divergence, and use the zero line for confirmation. | Use divergence on the D1/H4 as the main signal. Use the zero line to determine the long-term trend. See the CCI holding above +100 as a sign of a strong trend. |
| Mindset & interpretation | “The market has moved too far in a short period; there’s a high probability of a small correction.” | “Intraday momentum is weakening/changing. Is this a good entry point in the direction of the main trend?” | “The multi-week major trend is showing signs of exhaustion/starting. It’s time to look for entry/exit points for a big swing.” |
| Risks & key notes | Many false signals (noise). Requires fast reflexes and extremely tight risk management (short stop-loss). | Must pay attention to the trend on higher time frames (H4/D1). Be cautious around major news releases. | Signals are very rare and require patience. The stop-loss must be wider, so the position size must be smaller to manage risk. |
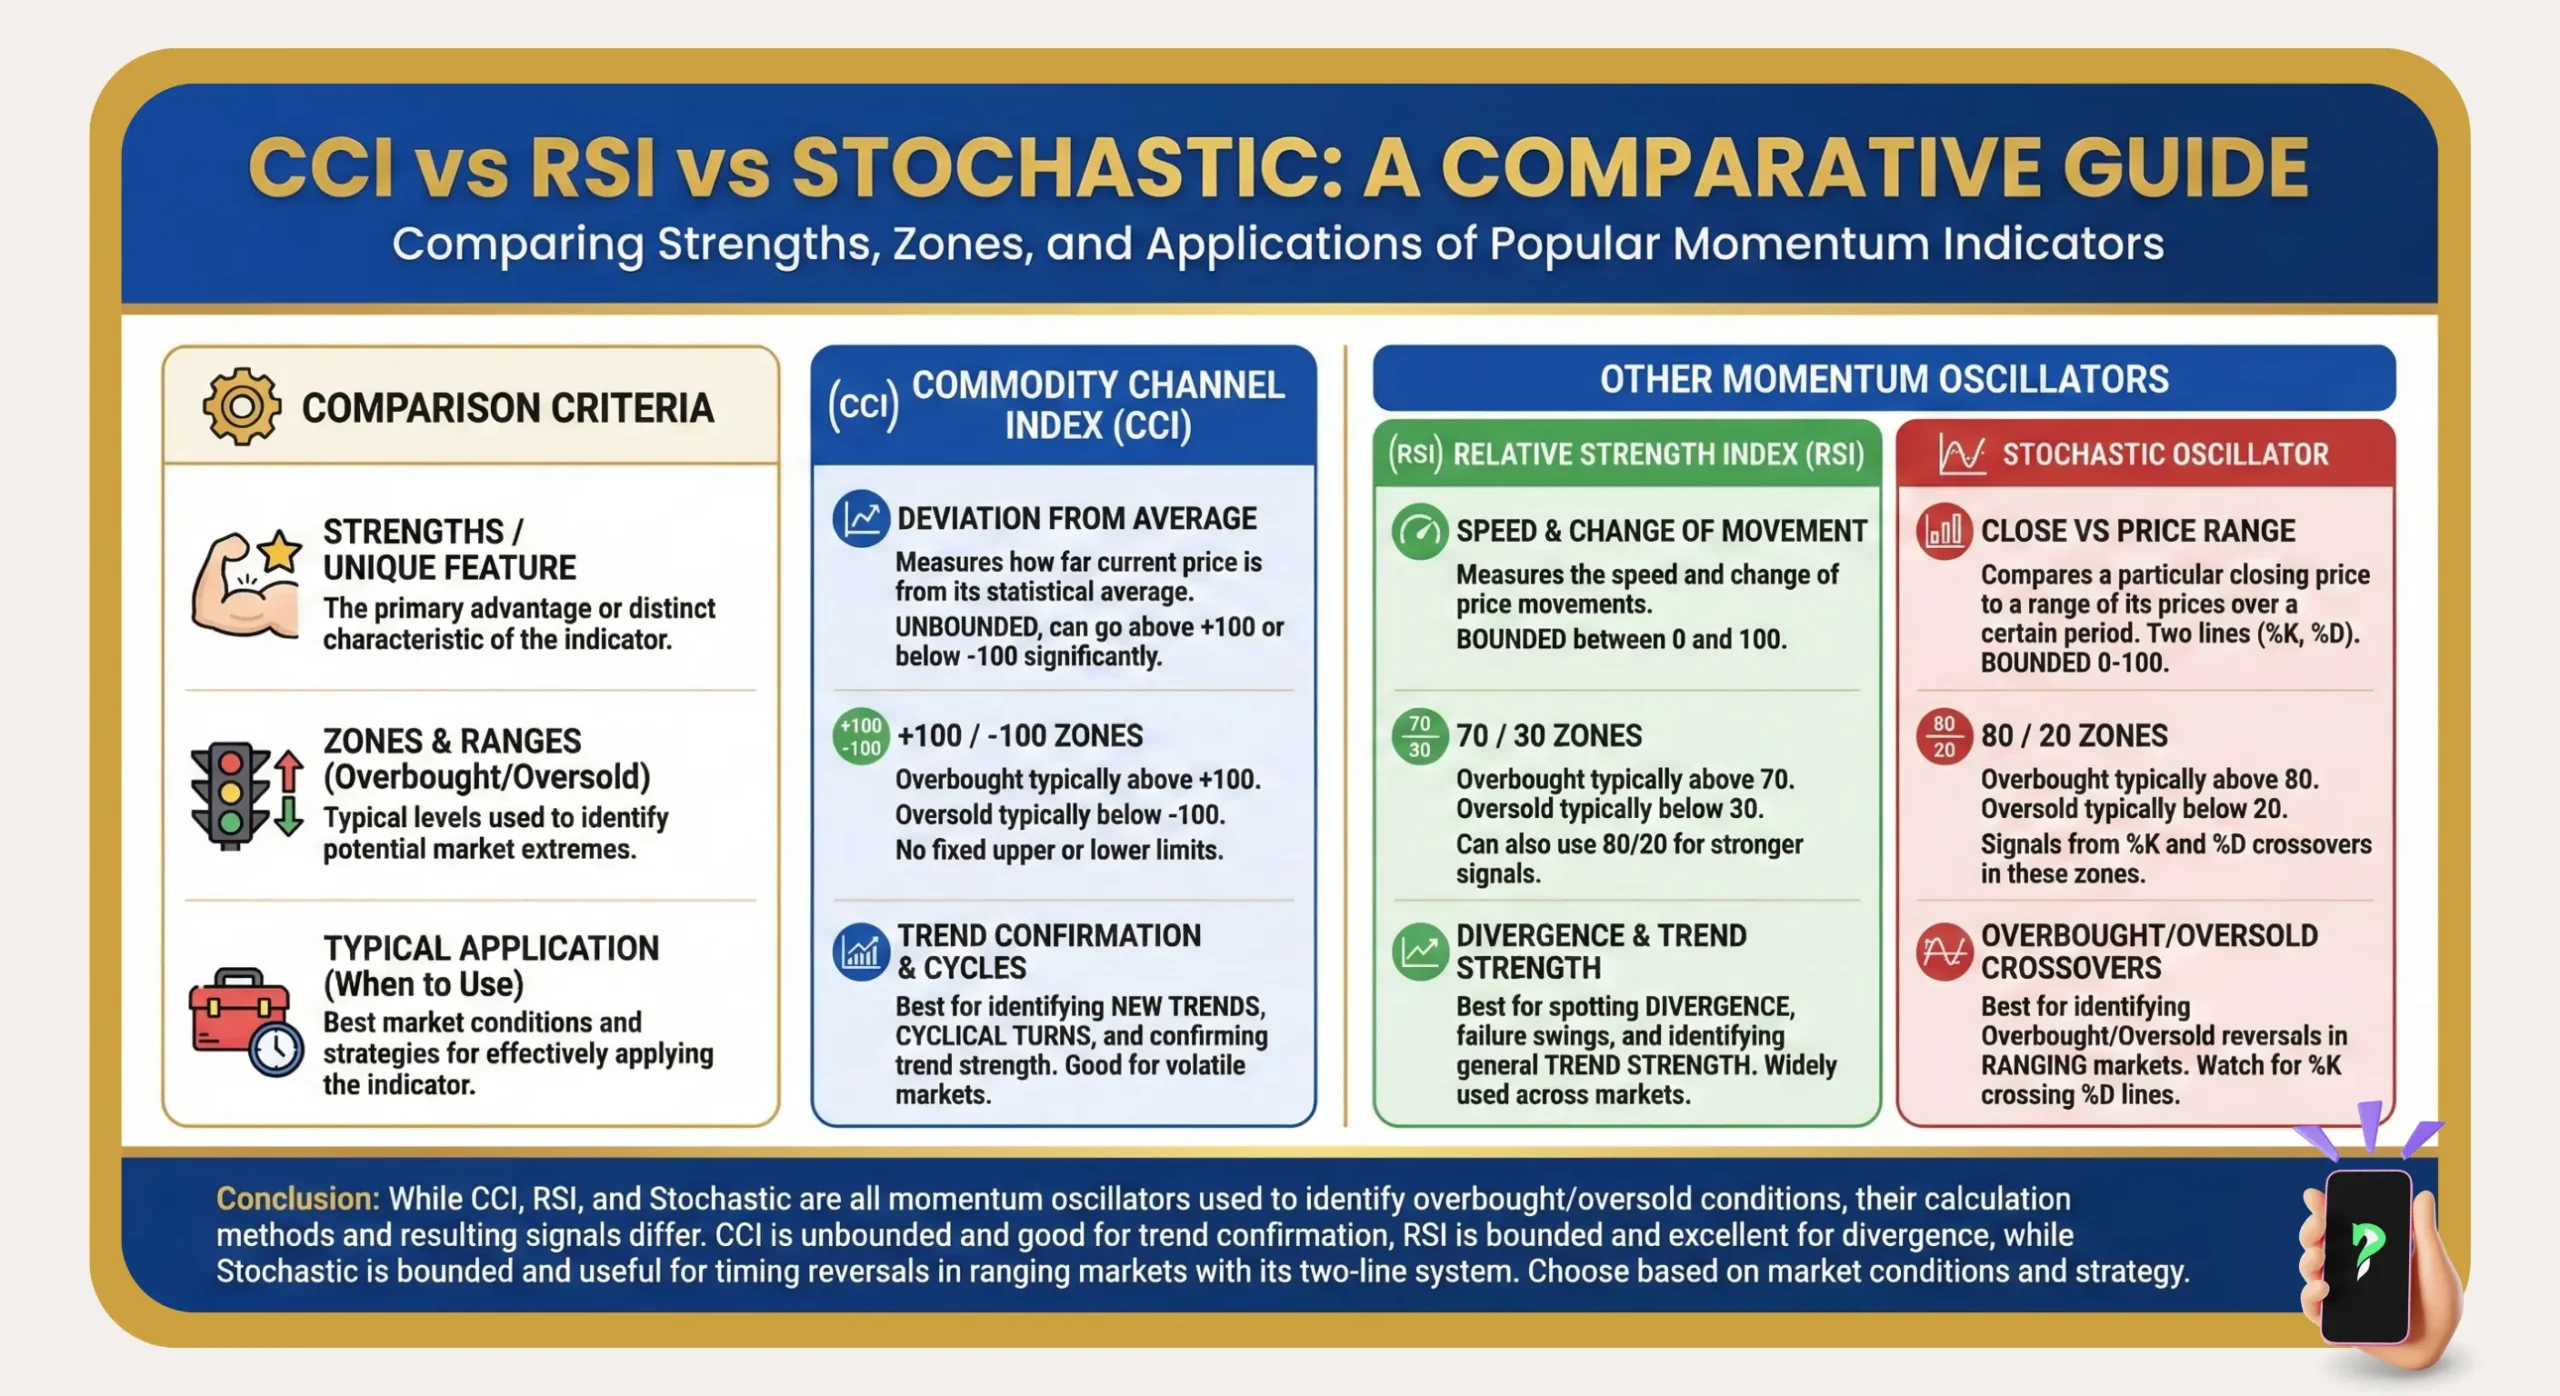
7. CCI vs. RSI: Which indicator is better for Forex?
Both are exceptional momentum oscillators, but they address slightly different market questions due to a core design difference. Your choice between them should depend on the market environment you are analyzing.
7.1. The core difference
The key distinction is their range. The RSI’s value is always contained within the fixed corridor of 0 to 100. The CCI, conversely, is “unbounded.” In a strong, trending Forex market, this matters. The RSI might get “pinned” at 95, but the CCI can continue climbing to +250 or higher, illustrating that the trend is still accelerating.
7.2. Conclusion for Forex traders
For analyzing powerful, directional markets, the CCI’s unbounded design often gives it an analytical edge, providing a more flexible and accurate gauge of extreme momentum.
However, many seasoned traders, myself included, use both in tandem: the RSI to spot classic overbought/oversold levels in range-bound markets, and the CCI to measure the raw power of trending moves.
8. Pitfalls to avoid when using the CCI in Forex
Like any powerful instrument, the CCI can be misapplied. Recognizing these common traps is essential for avoiding costly errors and using the indicator to its full potential.
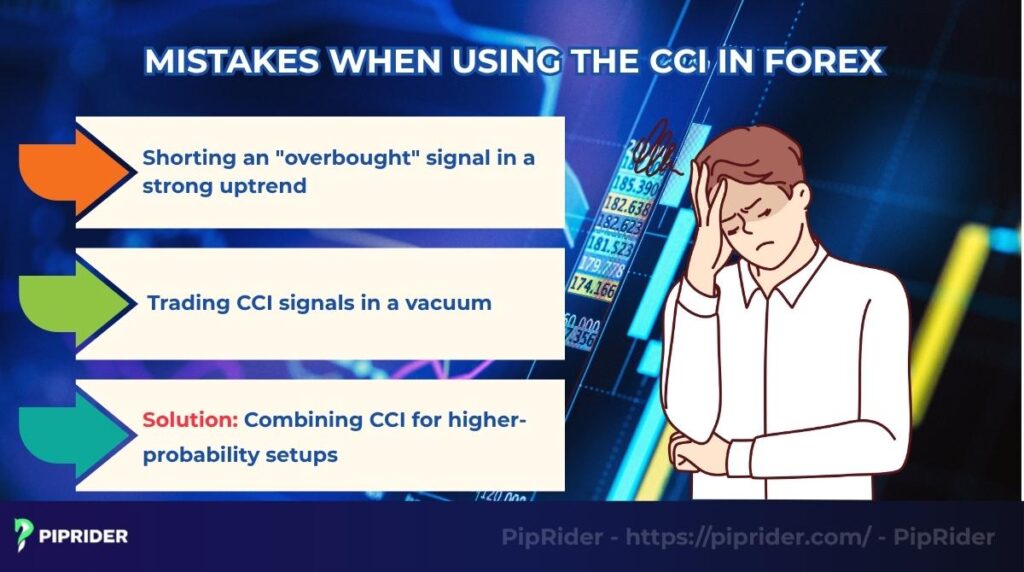
8.1. Shorting an “overbought” signal in a strong uptrend
This is the most frequent mistake. A trader observes the CCI cross above +100 and instantly concludes the market is ripe for a reversal. In truth, a breach of +100 is a sign of strength, signaling the onset of powerful momentum.
Veteran traders will wait for definitive evidence of weakness, such as a bearish divergence or a cross back below +100, before even contemplating a counter-trend position.
8.2. Trading CCI signals in a vacuum
No single indicator constitutes a complete trading system. A CCI signal’s probability of success increases exponentially when it aligns with other factors. For instance, a bullish divergence occurring at a major historical support zone is a far more reliable signal than one appearing in isolation. Always look for this confluence of evidence.
8.3. The Solution: Combining CCI for higher-probability setups
Since trading CCI signals in isolation is a surefire way to encounter false signals, the key to success is to combine it with other technical analysis tools. In my experience, this is how you transform the CCI from a standalone warning light into a high-probability trade confirmation tool. I have found that combining it with these elements is highly effective:
- Combine CCI with Moving Averages (MAs) for trend confirmation:
- Before even looking for a CCI signal, I always check the position of the price relative to a key moving average, such as the 50 or 200-period MA.
- A bullish CCI signal (like a zero-line crossover or a divergence) is far more compelling when the price is already trading above a long-term MA, confirming that you are trading in the direction of the larger trend.
- Combine CCI Divergence with Support & Resistance Zones:
- This is my favorite and most profitable strategy. A divergence signal becomes exponentially more powerful when it happens at a significant price level.
- For example, a bullish divergence is a very strong buy signal if it occurs precisely at a major historical support level. The convergence of a momentum shift (CCI divergence) and a structural price level (support/resistance) is a robust sign that a reversal is imminent.
10. Frequently asked questions (FAQs)
11. Conclusion
The Commodity Channel Index CCI is much more than a basic overbought/oversold tool; it is a sophisticated instrument for gauging the velocity and durability of market momentum.
By mastering its three primary strategies, patiently trading the +/- 100 zones, hunting for high-probability divergences, and leveraging the zero line for confirmation, you can introduce a powerful new dimension to your market analysis.
As with all indicators, its signals must be validated by price action and disciplined by robust risk management. The journey to proficiency is paved with practice, keen observation, and a commitment to continuous learning.
Want to explore other oscillators in depth? Follow Piprider and our Best Technical Indicators category to stay up-to-date with valuable insights. If you have any questions, feel free to leave a comment below!
Infographic Section
-
Commodity Channel Index – Momentum Indicator -
Mastering CCI: 3 Essential Trading Strategies -
CCI vs. RSI vs. Stochastic: A Comparative Guide


