
The Donchian Channel is a straightforward technical indicator that maps the highest and lowest prices over a set period. It transforms chaotic price movements into clear, actionable signals, helping forex traders identify trends and potential breakouts with greater confidence.
This guide will walk you through everything from its core mechanics to practical trading strategies. You’ll learn how to set it up, adjust its settings, and combine it with other tools to enhance your technical analysis.
Key Takeaways
- The Donchian Channel tracks the highest and lowest price to help identify market trends and breakouts.
- Consists of three bands (upper, lower, and middle) to show momentum and volatility.
- This tool is ideal for breakout and reversal trading strategies.
- Traders can adjust the period (e.g., 20 for day trading, 50 for swing trading) to fit their style.
- It works best in trending markets but can give false signals in sideways conditions.
1. What is the Donchian Channel?
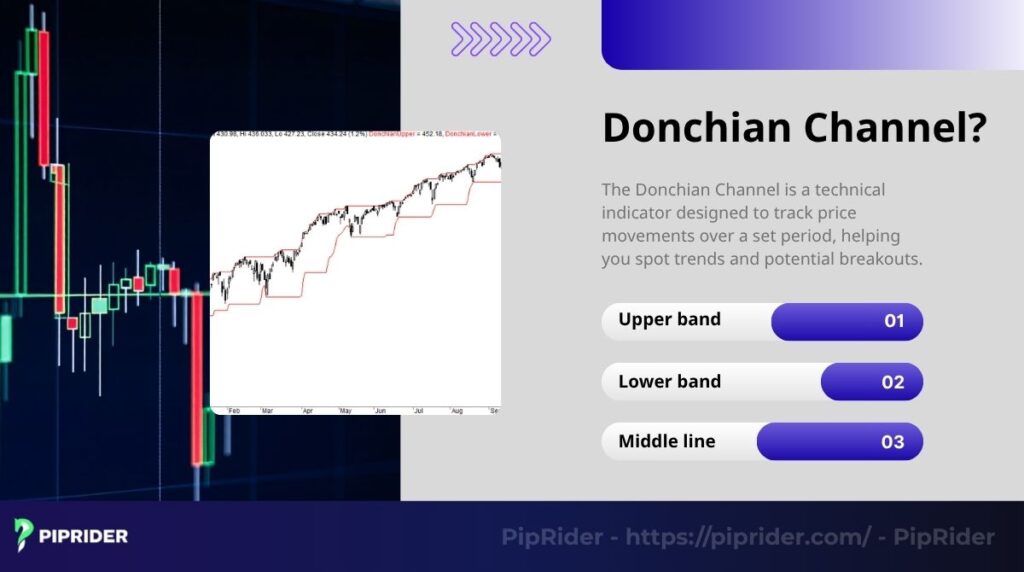
The Donchian Channel is a technical indicator designed to track price movements over a set period, helping traders spot trends and potential breakouts. It was created by Richard Donchian, a pioneer in futures trading during the 1940s (Murphy, 1999).
His work laid the foundation for trend following, and the Donchian Channel itself was the core of the famous turtle trading system, where entry rules were based on the price breaking above or below a specific period’s high or low (e.g., 20 days). The channel is highly customizable and is built into many modern platforms like TradingView.
The indicator consists of three lines:
- Upper band (also known as the upper channel): Represents the peak price reached within the selected time frame.
- Lower band (also known as the lower channel): Represents the lowest price recorded during that same time frame.
- Middle line: The average of the upper and lower bands, calculated as (Upper Band + Lower Band) / 2.
These lines form a channel that shows where prices are moving, which makes it easier to decide when to trade. For instance, when the price gets close to the upper band, the donchian channel may indicate robust upward momentum.
In forex, where prices can swing wildly, the Donchian Channel acts like a roadmap. This indicator is built into many modern platforms like TradingView and can be easily installed as a custom indicator on other popular platforms like MT4, allowing you to get started without needing fancy software.
2. How does the Donchian Channel work?
The Donchian Channel works by plotting three lines based on a chosen time frame, typically 20candlesticks, which is about a trading month (Investopedia, n.d.). These lines act like a guide, showing you the market’s momentum and volatility.
Here’s how it breaks down:
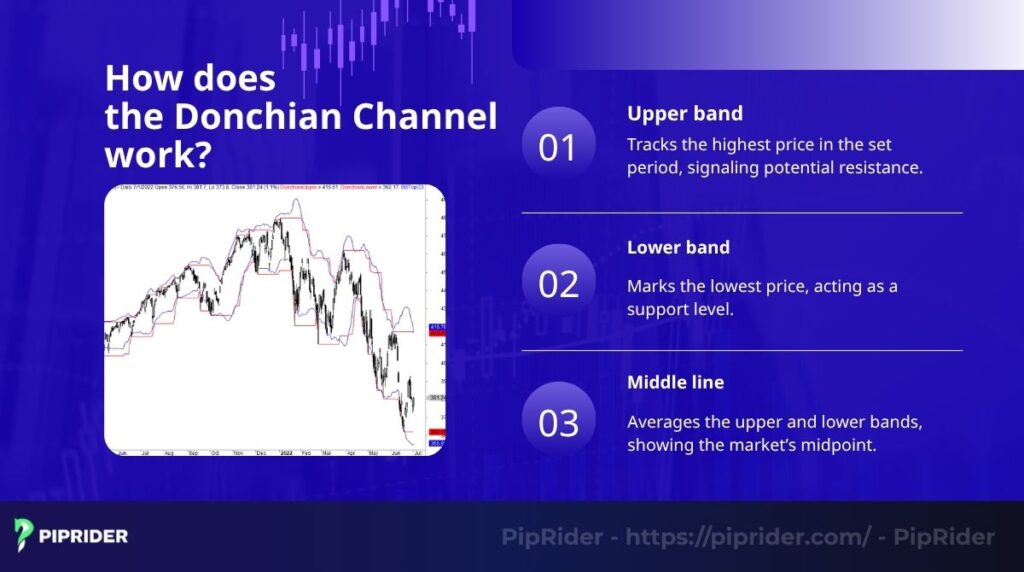
- Upper band: Tracks the highest price in the set period, signaling potential resistance level.
- Lower band: Marks the lowest price, acting as support levels.
- Middle line: Averages the upper and lower bands, showing the market’s midpoint.
Donchian Channel helps you understand price action by showing the range of highs and lows over a specific period. It’s a straightforward way to spot where the market might head next.
When the price approaches the upper band, Donchian Channel often signals upward momentum, encouraging potential buy opportunities. If the price moves toward the lower band, it signals potential bearish momentum, suggesting a selling opportunity.
A price lingering near the center line often means low fluctuations, so you might hold off on trading. This setup works great for pairs like EUR/USD during trending markets. The channel also reveals fluctuations: a wide channel means big price swings, while a narrow one suggests a calm market. This insight helps you decide when to act or wait.
3. How to use Donchian Channels in forex trading
Applying the Donchian Channel in forex trading begins with two essential steps: setting it up on a trading platform and understanding its signals. Its straightforward design makes it an accessible tool for traders at all experience levels, including beginners.
Here’s how to make it work for you:
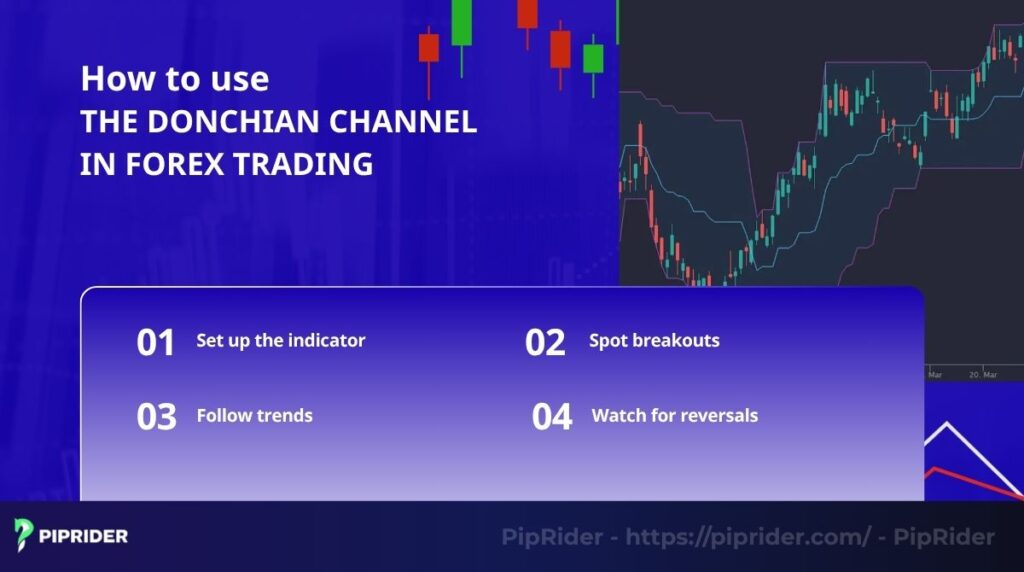
- Setup: Open your platform, such as TradingView, and find the Donchian Channel in the indicators list. For MT4, you may need to download and install this indicator as a custom file. Select it, set the period to 20 (a common starting point), and apply it to your chart.
- Spot breakout: Enter a buy trade when the price moves above the upper band, indicating a possible upward trend. Sell when it drops below the lower channel, hinting at a downtrend.
- Follow trends: When the price consistently stays near the upper band, it indicates a strong upward move. Consider holding your buy. If it sticks to the lower band, a downtrend might be in play, so think about selling.
- Watch for reversals: When the price fails to break a band and returns to the center line, it could signal a reversal.
The Donchian Channel indicator shines in trending markets, like after major economic news. For example, we once caught a breakout on AUD/USD during a Reserve Bank announcement, thanks to a clear upper channel signal. Just be cautious in choppy markets, where false signals can trip you up.
4. Donchian Channel settings: How to pick the right periods
Donchian Channels use a period setting to determine how many candles it analyzes, typically 20, which reflects about a month of trading days. But depending on your goals, you can adjust this period to fit fast or slow markets. Here’s a guide to picking the right period:
| Period | Trading style | Best for | Risk level |
| 5–10 | Scalping | Intraday traders | High |
| 20 | Day trading | Short-term moves | Moderate |
| 50–100 | Swing trading | Long-term trends | Low |
Choosing the right period for this indicator is about matching the settings to your trading horizon and the forex market’s mood.
For fast-moving pairs like GBP/JPY, longer periods (50–100) help filter out noise and catch bigger trends. For calmer pairs like EUR/USD, shorter periods (5–10) give quicker signals, perfect for scalping. Always test your settings on a demo account first. Your risk tolerance and the pair’s fluctuations should guide your choice.
5. Donchian Channel strategy: Practical examples and case study
The clarity of the Donchian Channel’s signals makes it a versatile tool for both aggressive breakout and conservative trading strategies. This section details two core trading strategies and a case study to demonstrate the indicator’s practical application.
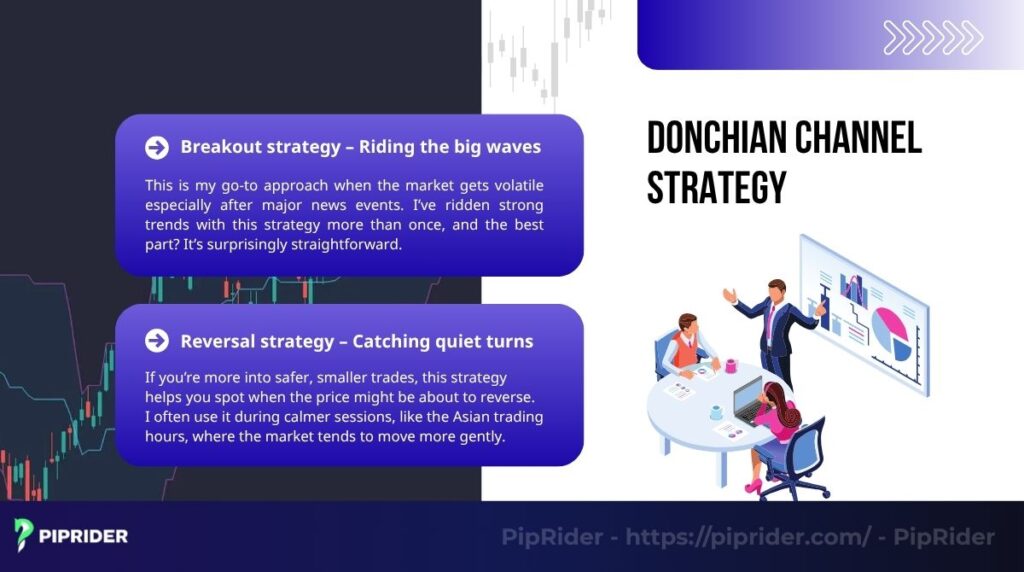
5.1. Breakout strategy – Riding the big waves
The breakout strategy is a highly effective approach in volatile markets, especially following major news events. It is designed to capture strong trends and is known for its straightforward application. This strategy can be applied to any period.
- Entry: A buy is triggered when the price closes above the upper band for two consecutive candles, signaling an uptrend. A sell is triggered when the price closes below the lower band twice, indicating a downtrend.
- Exit: Profits can be taken at the center line, or a trailing stop can be used to lock in gains if the trend continues.
- Risk Management: Stop-loss orders should always be set just below the lower band (for buys) or above the upper band (for sells). This placement is crucial for protecting the trade against unexpected reversals.
5.2. Reversal strategy – Catching quiet turns
The reversal strategy is suited for traders who prefer a more conservative approach, focusing on identifying potential price reversals. It is particularly effective during calmer market sessions, like the Asian trading hours, where price tends to move more gently.
- Entry: A buy signal occurs when the price bounces off the lower band and heads toward the center line, suggesting a potential bottom is forming. A sell signal occurs when the price falls from the upper band back toward the middle.
- Exit: The trade is typically closed when the price reaches the opposite band or begins showing signs of reversing again. Take-profit orders are used for this purpose.
- Risk Control: Use tight stop-losses placed below the lower band for buys and above the upper band for sells. Discipline is key in this strategy.
5.3. Case study: Trading AUD/USD
Let’s break down a textbook trade to see how this strategy works in practice. We were monitoring the AUD/USD pair on the 1-hour chart with a 20-period Donchian Channel. Following the release of a stronger-than-expected Australian jobs report, the market reacted with a surge in volatility.
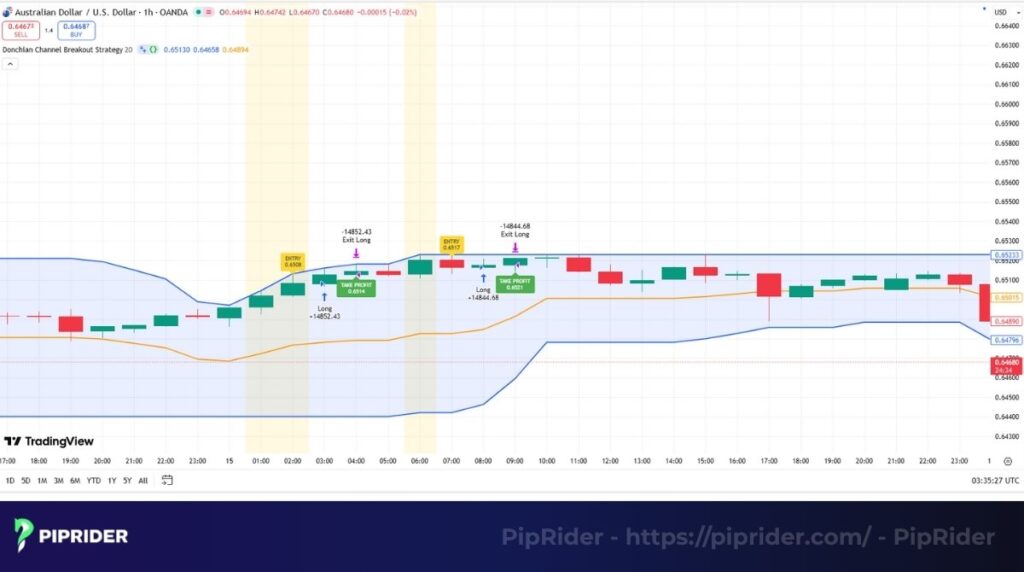
As you can see in the chart, the price printed a large bullish candle that broke and closed decisively above the upper band. This was a clear signal that strong buying momentum had entered the market.
Here is how the trade was managed:
- Entry Signal: A buy order was placed at the open of the candle following the initial breakout candle. This confirmation step helps avoid false signals.
- Stop-Loss: To manage risk, a stop-loss was placed just below the lower band of the channel. This level acted as a logical support zone, and a break below it would invalidate the bullish thesis.
- Take-Profit: The initial profit target was set at the middle line of the channel. For this trade, the price reached the target within a few candles, securing a quick profit.
This trade is a prime example of how the Donchian Channel can provide clear, actionable signals during high-volatility events. It defined the entry point, a logical stop-loss level, and a clear profit target, removing guesswork from the trading decision.
5.4. Backtest results and real-world lessons
To demonstrate the effectiveness of the breakout strategy, a backtest was conducted on a currency pair under similar market conditions. The chart below illustrates a successful trade executed using this approach, highlighting the importance of clear entry and exit points.
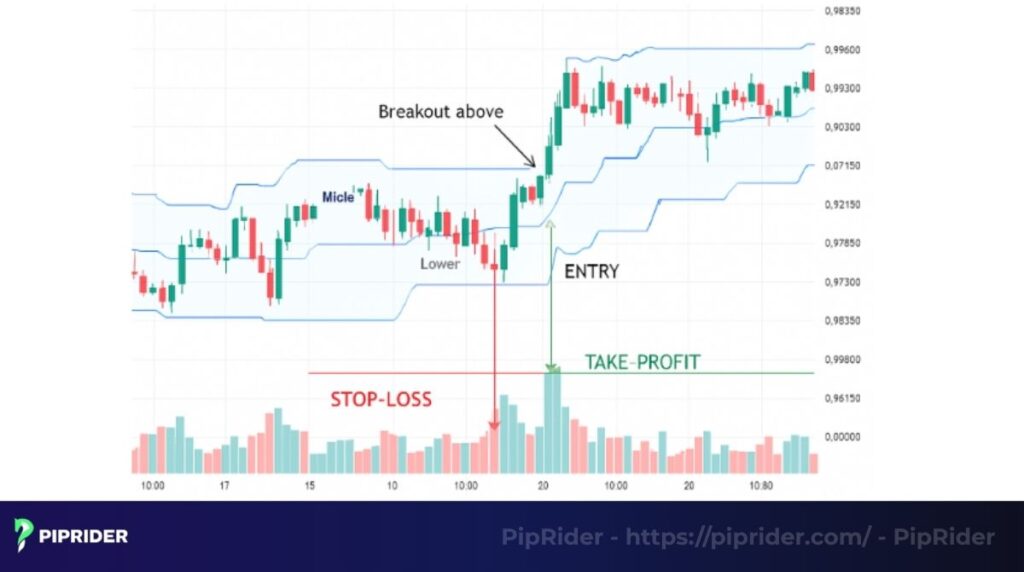
- Entry Signal: During a period of price volatility, a buy signal was generated as the price broke above the Donchian Channel’s upper band. A buy order was entered at approximately 0.92150 after a green candle closed firmly above this level.
- Stop-Loss Placement: To protect the account, the stop-loss order was placed just below the channel’s lower band, at a price of approximately 0.91850. This position was wide enough to avoid minor fluctuations but still provided a safeguard in case of a trend reversal.
- Take-Profit Target: The take-profit target was set based on the strategy’s principles, at a price of approximately 0.92800.
The outcome of this trade was highly successful. The price increased sharply after the breakout, quickly reaching the take-profit target. This backtest not only proves the effectiveness of the breakout strategy but also highlights the importance of systematic risk management.
6. Combining Donchian Channels with other tools
Pairing the Donchian Channel with other tools is a powerful technique that sharpens signals and helps traders better interpret the underlying price action, especially in tricky markets. This indicator shines when used alongside other tools to confirm signals, particularly in forex, where false breakouts are common.
Here are three tools that work well with it:
- Relative Strength Index (RSI): This tool checks if a currency pair is overbought (above 70) or oversold (below 30). For example, if USD/CAD breaks the upper Donchian band while the RSI is above 70, it signals that the breakout may be exhausted, prompting caution.
- Moving Average Convergence Divergence (MACD): The MACD confirms trend strength. A bullish MACD crossover that aligns with a Donchian Channel breakout signals a strong buy opportunity.
- Average True Range (ATR): This measures volatility to help set smarter stop-losses. If the ATR shows high volatility on a pair like GBP/JPY, it suggests a wider stop-loss may be appropriate to avoid being stopped out prematurely.
As an example, a trader once combined the Relative Strength Index with the Donchian Channel while trading USD/JPY. The price broke the upper band, but RSI was at 65, suggesting room for growth. This combo helped the trader catch a solid uptrend. Pairing it with RSI, MACD, or ATR improves signal accuracy in forex trading. These tools help confirm trends and set better stop-losses, reducing false signals. It is a key part of effective technical analysis for many traders.
7. Donchian Channels vs. Bollinger Bands: What’s the difference?
At first glance, Donchian Channels and Bollinger Bands can appear visually similar on a chart, often leading traders to confuse the two. Despite their similar appearance, they are fundamentally different indicators based on distinct calculations and designed for different market conditions. Understanding these key differences is crucial for applying them effectively in technical analysis.
Here’s a clear breakdown to help traders figure out which one fits their trading style better:
| Feature | Donchian Channel | Bollinger Bands |
| Basis | Highest prices and lowest prices over a set period | Moving average ± standard deviation |
| Best for | Breakout trading in strong, trending markets | Range trading in sideways or low-volatility markets |
| Signals | Clear breakout signals when price closes above/below | Volatility shifts and mean reversion cues |
The Donchian Channel is designed for trending, high-volatility markets. Its primary function is to identify clear breakout opportunities when the price moves beyond its recent high or low, making it ideal for momentum-based strategies.
Conversely, Bollinger Bands are most effective in sideways or range-bound markets. By measuring volatility, they identify potentially overextended prices and signal opportunities for mean-reversion trades, where the price is expected to return to its average.
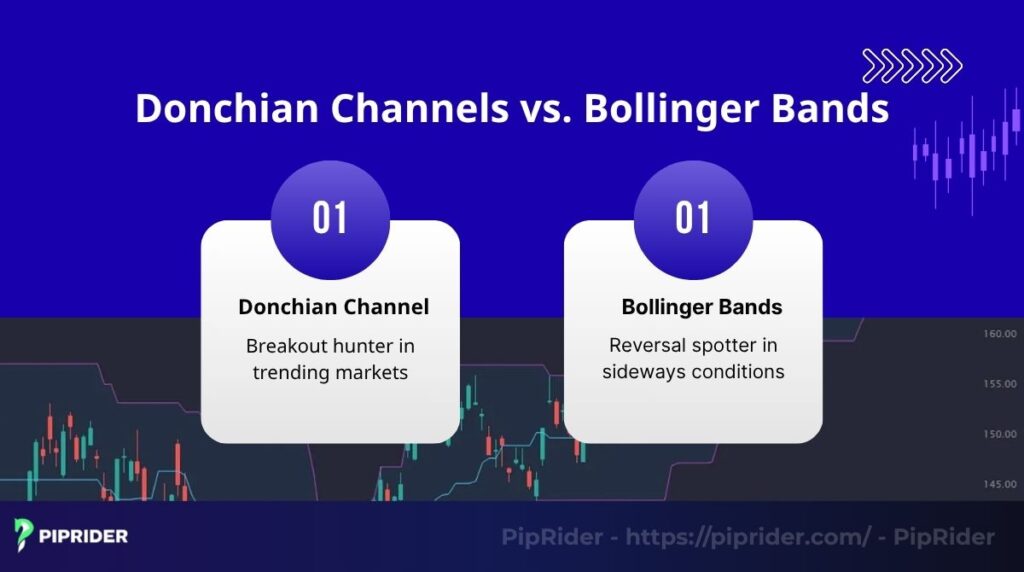
In short, their applications are distinct:
- Donchian Channel: Best for breakout trading in trends.
- Bollinger Bands: Best for reversal trading in ranges.
Therefore, selecting the right tool depends on aligning the indicator’s strength with the current market condition and the trader’s strategy.
8. Pros, cons, and limits of Donchian Channels
Donchian Channels are beloved by many traders, but let’s be real it’s not some magical all-knowing indicator. Here’s the good, the bad, and the limitations you should know before leaning too heavily on it:
| Pros | Cons |
| Extremely beginner-friendly, even for those with no prior experience. | Can lag behind price, especially in fast markets |
| Excellent for spotting clear trends and breakouts | Often gives false signals in choppy, sideways markets |
| Widely available (built-in on TradingView, installable on MT4) | Needs confirmation from other indicators |
The Donchian Channel is a simple, powerful tool perfect for trending markets and breakout strategies. But as a lagging indicator, it struggles in flat markets. Consider it more of a specialist than a jack-of-all-trades. To get the most from it, don’t use it in isolation. Pair it with a second opinion, and you’ll be much better equipped to trade with confidence.
9. FAQs about Donchian Channels
10. Conclusion
The Donchian Channel is a simple yet powerful indicator that helps forex traders spot trends with greater confidence. It also helps identify key support and resistance levels. Whether you’re using a Donchian Channel strategy for breakouts or a trend-following strategy to capture momentum, this tool can elevate your trading approach, especially in volatile markets.
At PipRider, we believe that mastering the right tools is key to building a solid trading strategy. That’s why this blog is part of our “Best Technical Indicators” series, designed to support both experienced traders and those just getting started with technical analysis.


