
Harmonic patterns represent specific geometric price formations on a chart that adhere to precise Fibonacci retracement and extension ratios. These patterns in Forex trading are not random; they are believed to reflect the cyclical and repetitive nature of market psychology, often signaling potential shifts in supply and demand.
Harmonic patterns are advanced Fibonacci-based reversal structures. They are most useful for traders who want precise entry zones instead of broad visual chart patterns. It is important to note that they require high mathematical precision to execute successfully.
Key Takeaways
- Harmonic patterns utilize specific ratios to define potential price reversal zones. They are also used to create a concrete trading strategy.
- Common patterns include Gartley, Bat, Butterfly, Crab, Shark, and Cypher.
- They are applicable across various markets like Forex, stocks, and crypto for pinpointing accurate trade entries.
- Mastering them requires patience and consistent practice for correct identification.
- Best used in conjunction with robust risk control and price movement confirmation.
1. What Are Harmonic Patterns?
Harmonic trading identifies high-probability price reversals or continuation zones by defining specific price points and ratios. Unlike simpler chart patterns, harmonics provide a structured framework to anticipate where price is likely to turn, making them invaluable for strategic planning in dynamic markets.
Harmonic trading was first introduced by H. M. Gartley in his seminal 1935 book Profits in the Stock Market. Later, Scott Carney expanded on Gartley’s work by formalizing additional harmonic structures and ratios. These ideas have since been popularized and further explained in technical analysis literature (Gartley, 1935; Carney, 1999; StockCharts, 2024).
Their importance in technical analysis stems from their ability to identify high-probability price reversals or continuation zones. Unlike simpler chart patterns, harmonic provides a more objective and mathematically derived approach to forecasting price movements. By defining specific price points and ratios, they offer traders a structured framework to anticipate where price is likely to turn, making them invaluable for strategic planning in dynamic markets.
2. Key Fibonacci Ratios Behind Harmonic Trading
The foundation of any harmonic setup is the Fibonacci retracement and Fibonacci extension. These ratios measure the internal corrections and external projections of price swings. Mastery of these tools is non-negotiable for validating any setup.
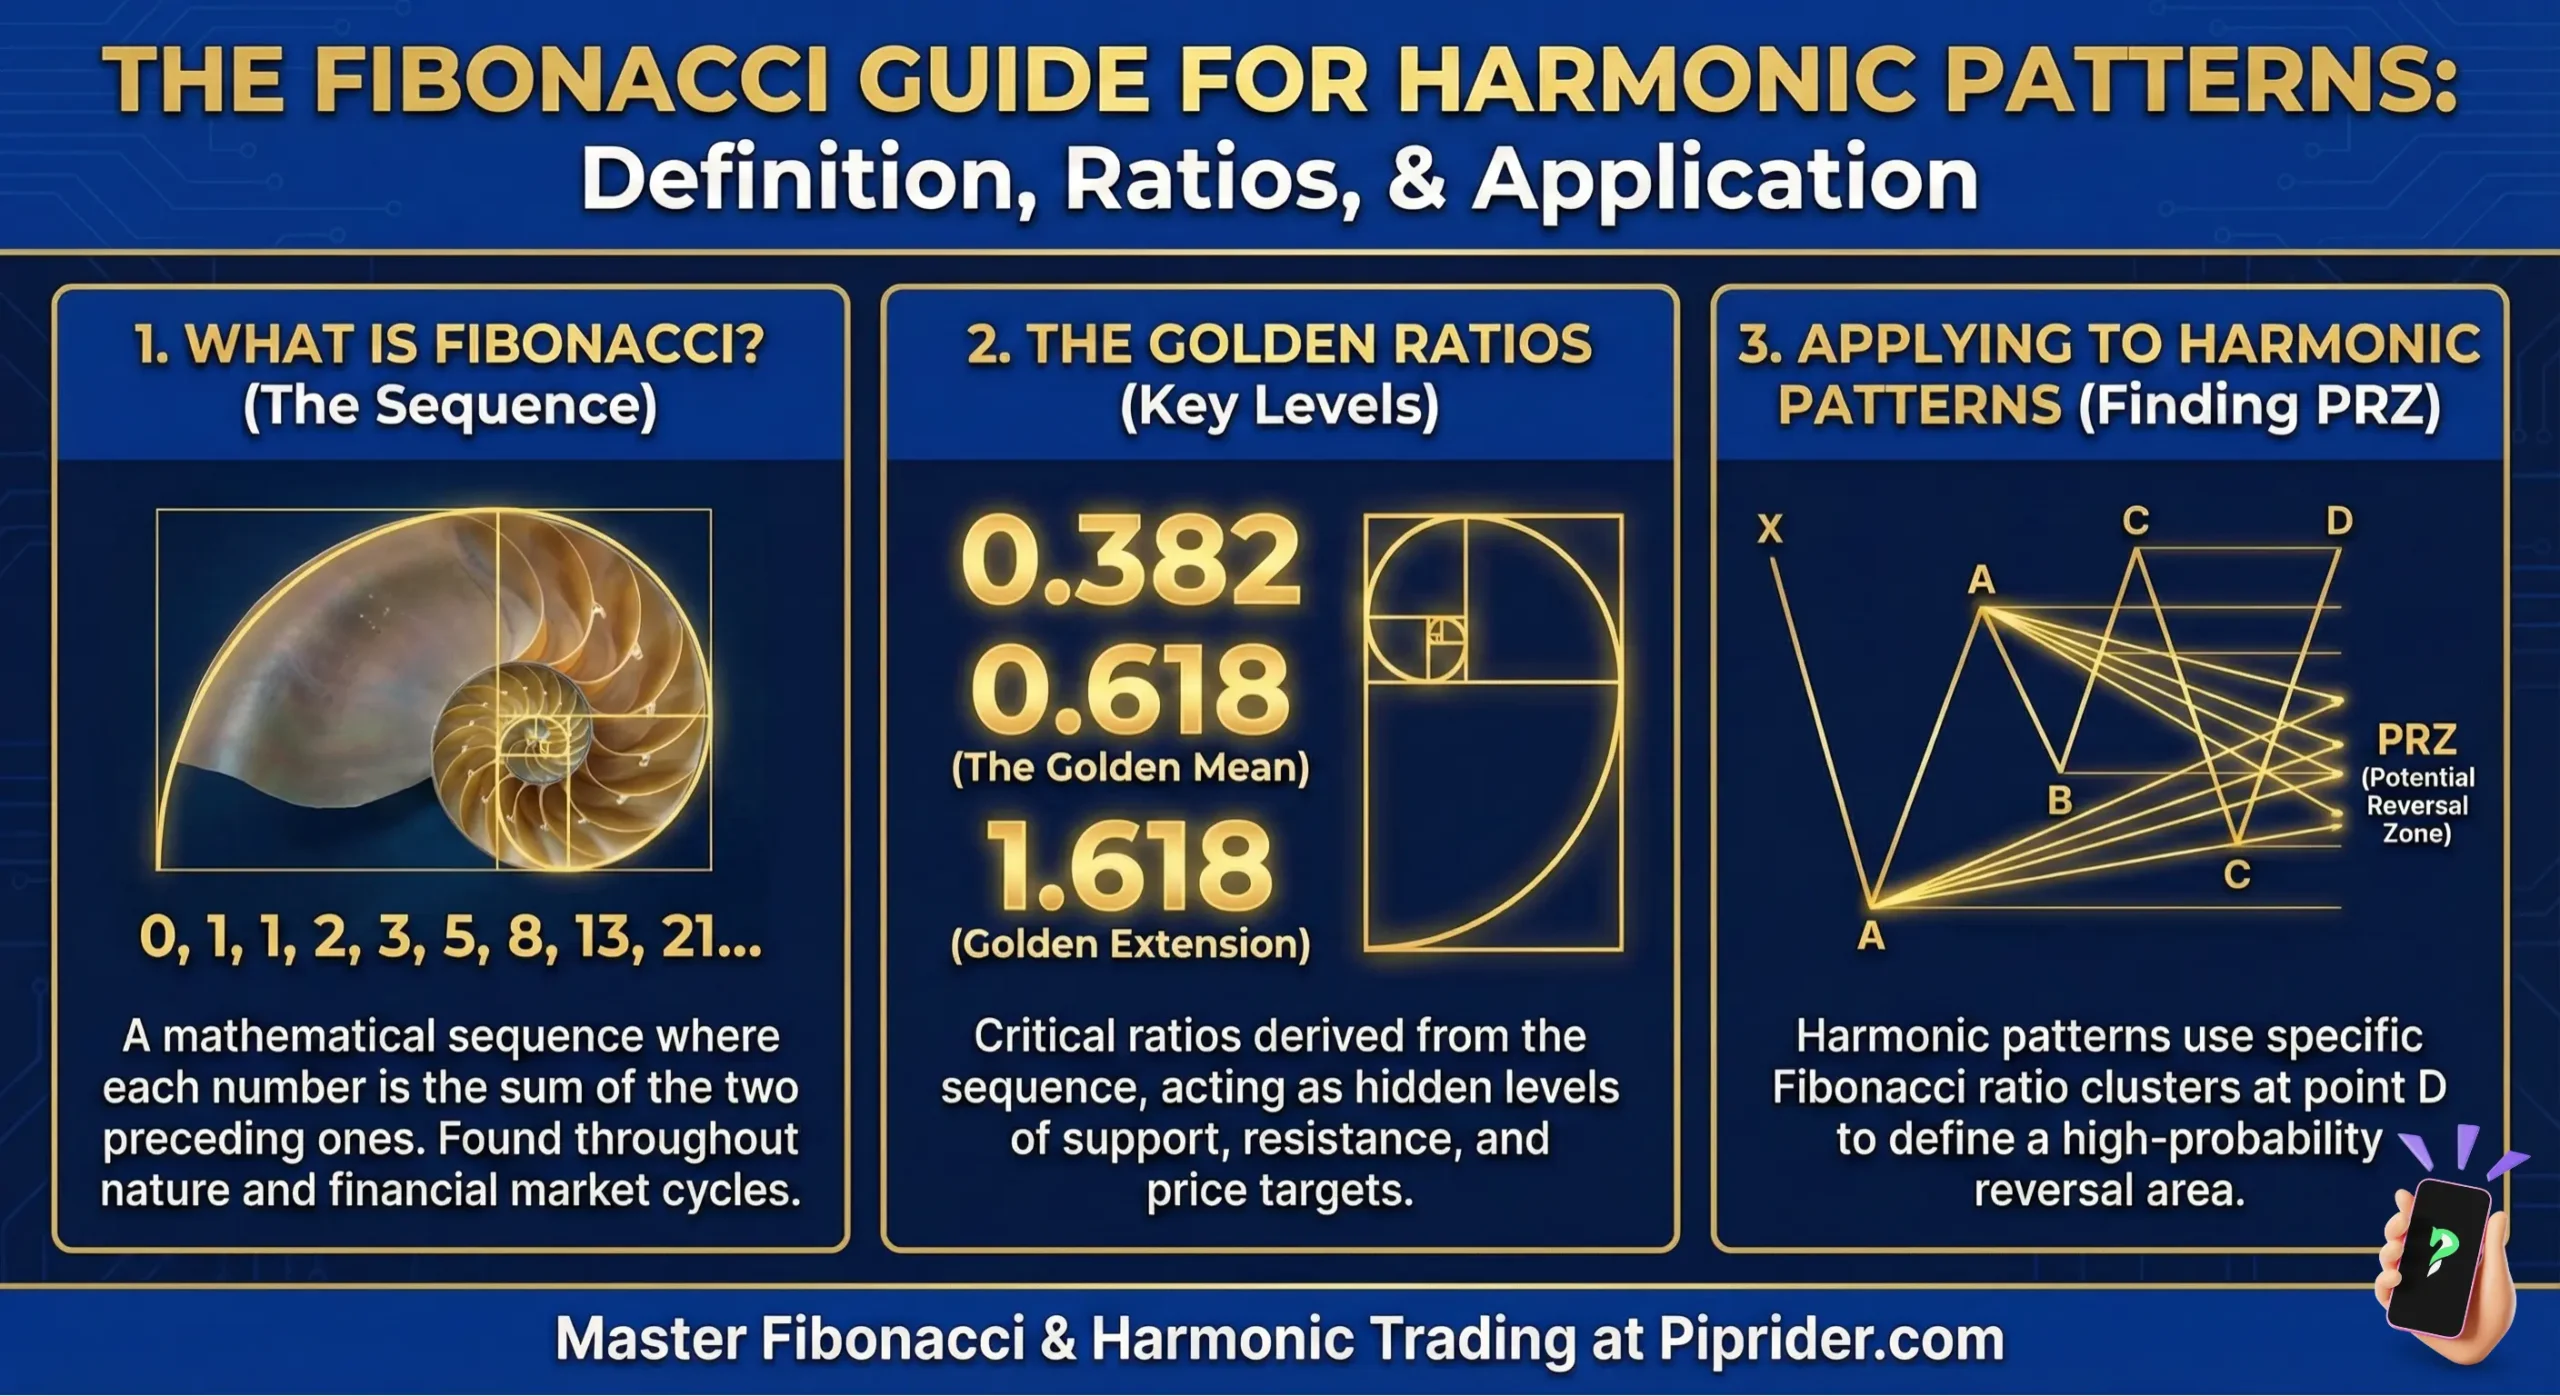
2.1. The Foundation: Fibonacci Ratios
At the heart of every harmonic pattern are specific ratios that define the proportional relationships between price swings. Below is a summary of the core Fibonacci levels used to validate these structures:
| Ratio Type | Common Levels Used in Harmonics |
|---|---|
| Primary Retracements | 0.382, 0.50, 0.618, 0.786, 0.886 |
| Primary Extensions | 1.13, 1.272, 1.414, 1.618 |
| Secondary Projections | 2.0, 2.24, 2.618, 3.14, 3.618 |
Fibonacci patterns in Forex derive their predictive power from these ratios, which are believed to reflect natural market movements and psychological turning points.
Traders use Fibonacci tools to objectively measure the precise lengths of each leg, validating if a potential pattern meets the strict criteria. Without these specific ratios, a perceived pattern is simply noise, not a tradable harmonic structure.
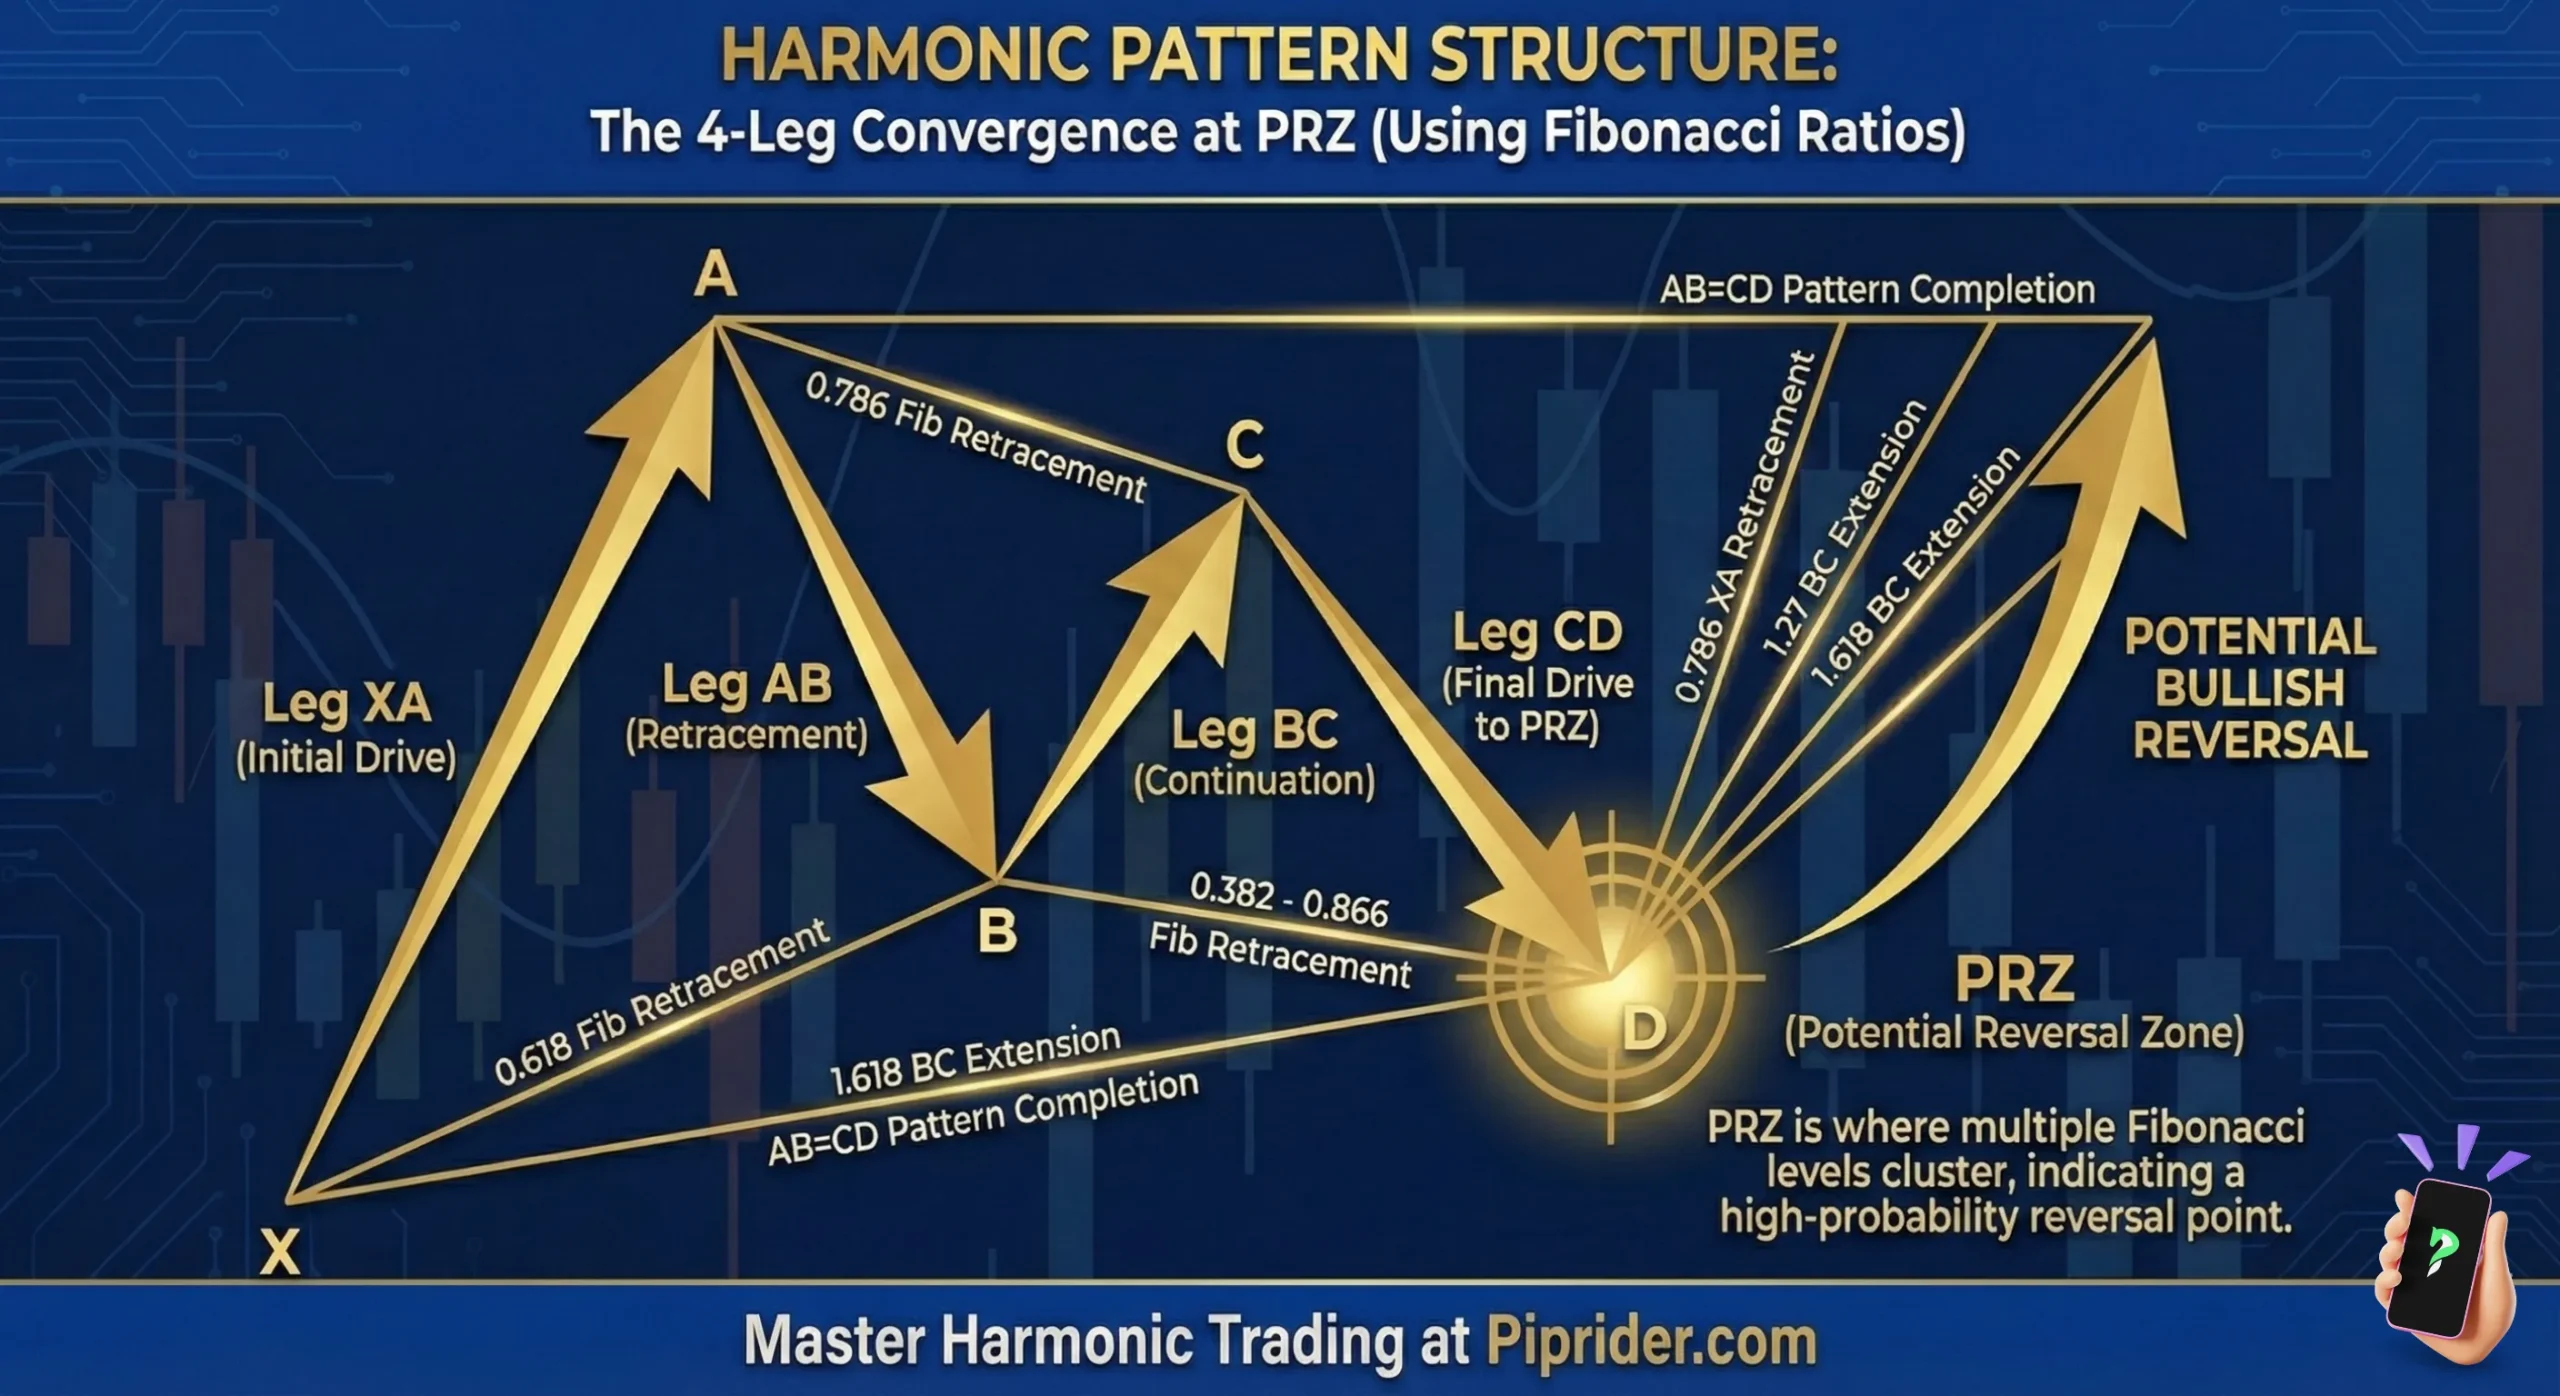
2.2. The Structure: X, A, B, C, D Points
Every harmonic pattern is a five-point structure, identified by distinct price pivots labeled X, A, B, C, and D. This ABCD pattern structure is crucial for both pattern identification and Fibonacci application:
- XA: The initial, foundational impulse leg.
- AB: The first retracement against XA.
- BC: The second impulse leg, often aligning with the XA direction.
- CD: The final, most critical leg, defining the potential reversal.
Correctly identifying these pivots is the first step in successful harmonics, setting the stage for accurate measurements.
2.3. The Target: Potential Reversal Zone (PRZ)
The Potential Reversal Zone (PRZ) is the most vital concept for traders. It’s not a single price level, but a concentrated area where multiple Fibonacci measurements converge. This confluence signals a high probability of a market reversal.
Typically, a PRZ for market patterns Forex is formed by the intersection of:
- A Fibonacci retracement of the XA leg.
- A Fibonacci extension of the XA leg.
- A Fibonacci projection of the BC leg.
The more Fibonacci levels that align within a tight price range, the stronger the PRZ is considered. Our experience suggests that this zone serves as the primary target for anticipating a reversal, where traders should look for additional confirmation (like candlestick patterns or indicator divergences) before entering a trade. Trading the PRZ blindly can be risky; confirmation is key.
3. Harmonic Patterns Cheat Sheet
Before diving into specific types, traders should use the following table to quickly scan and validate potential setups. This summary highlights the key Fibonacci alignment required for each pattern to be considered valid.
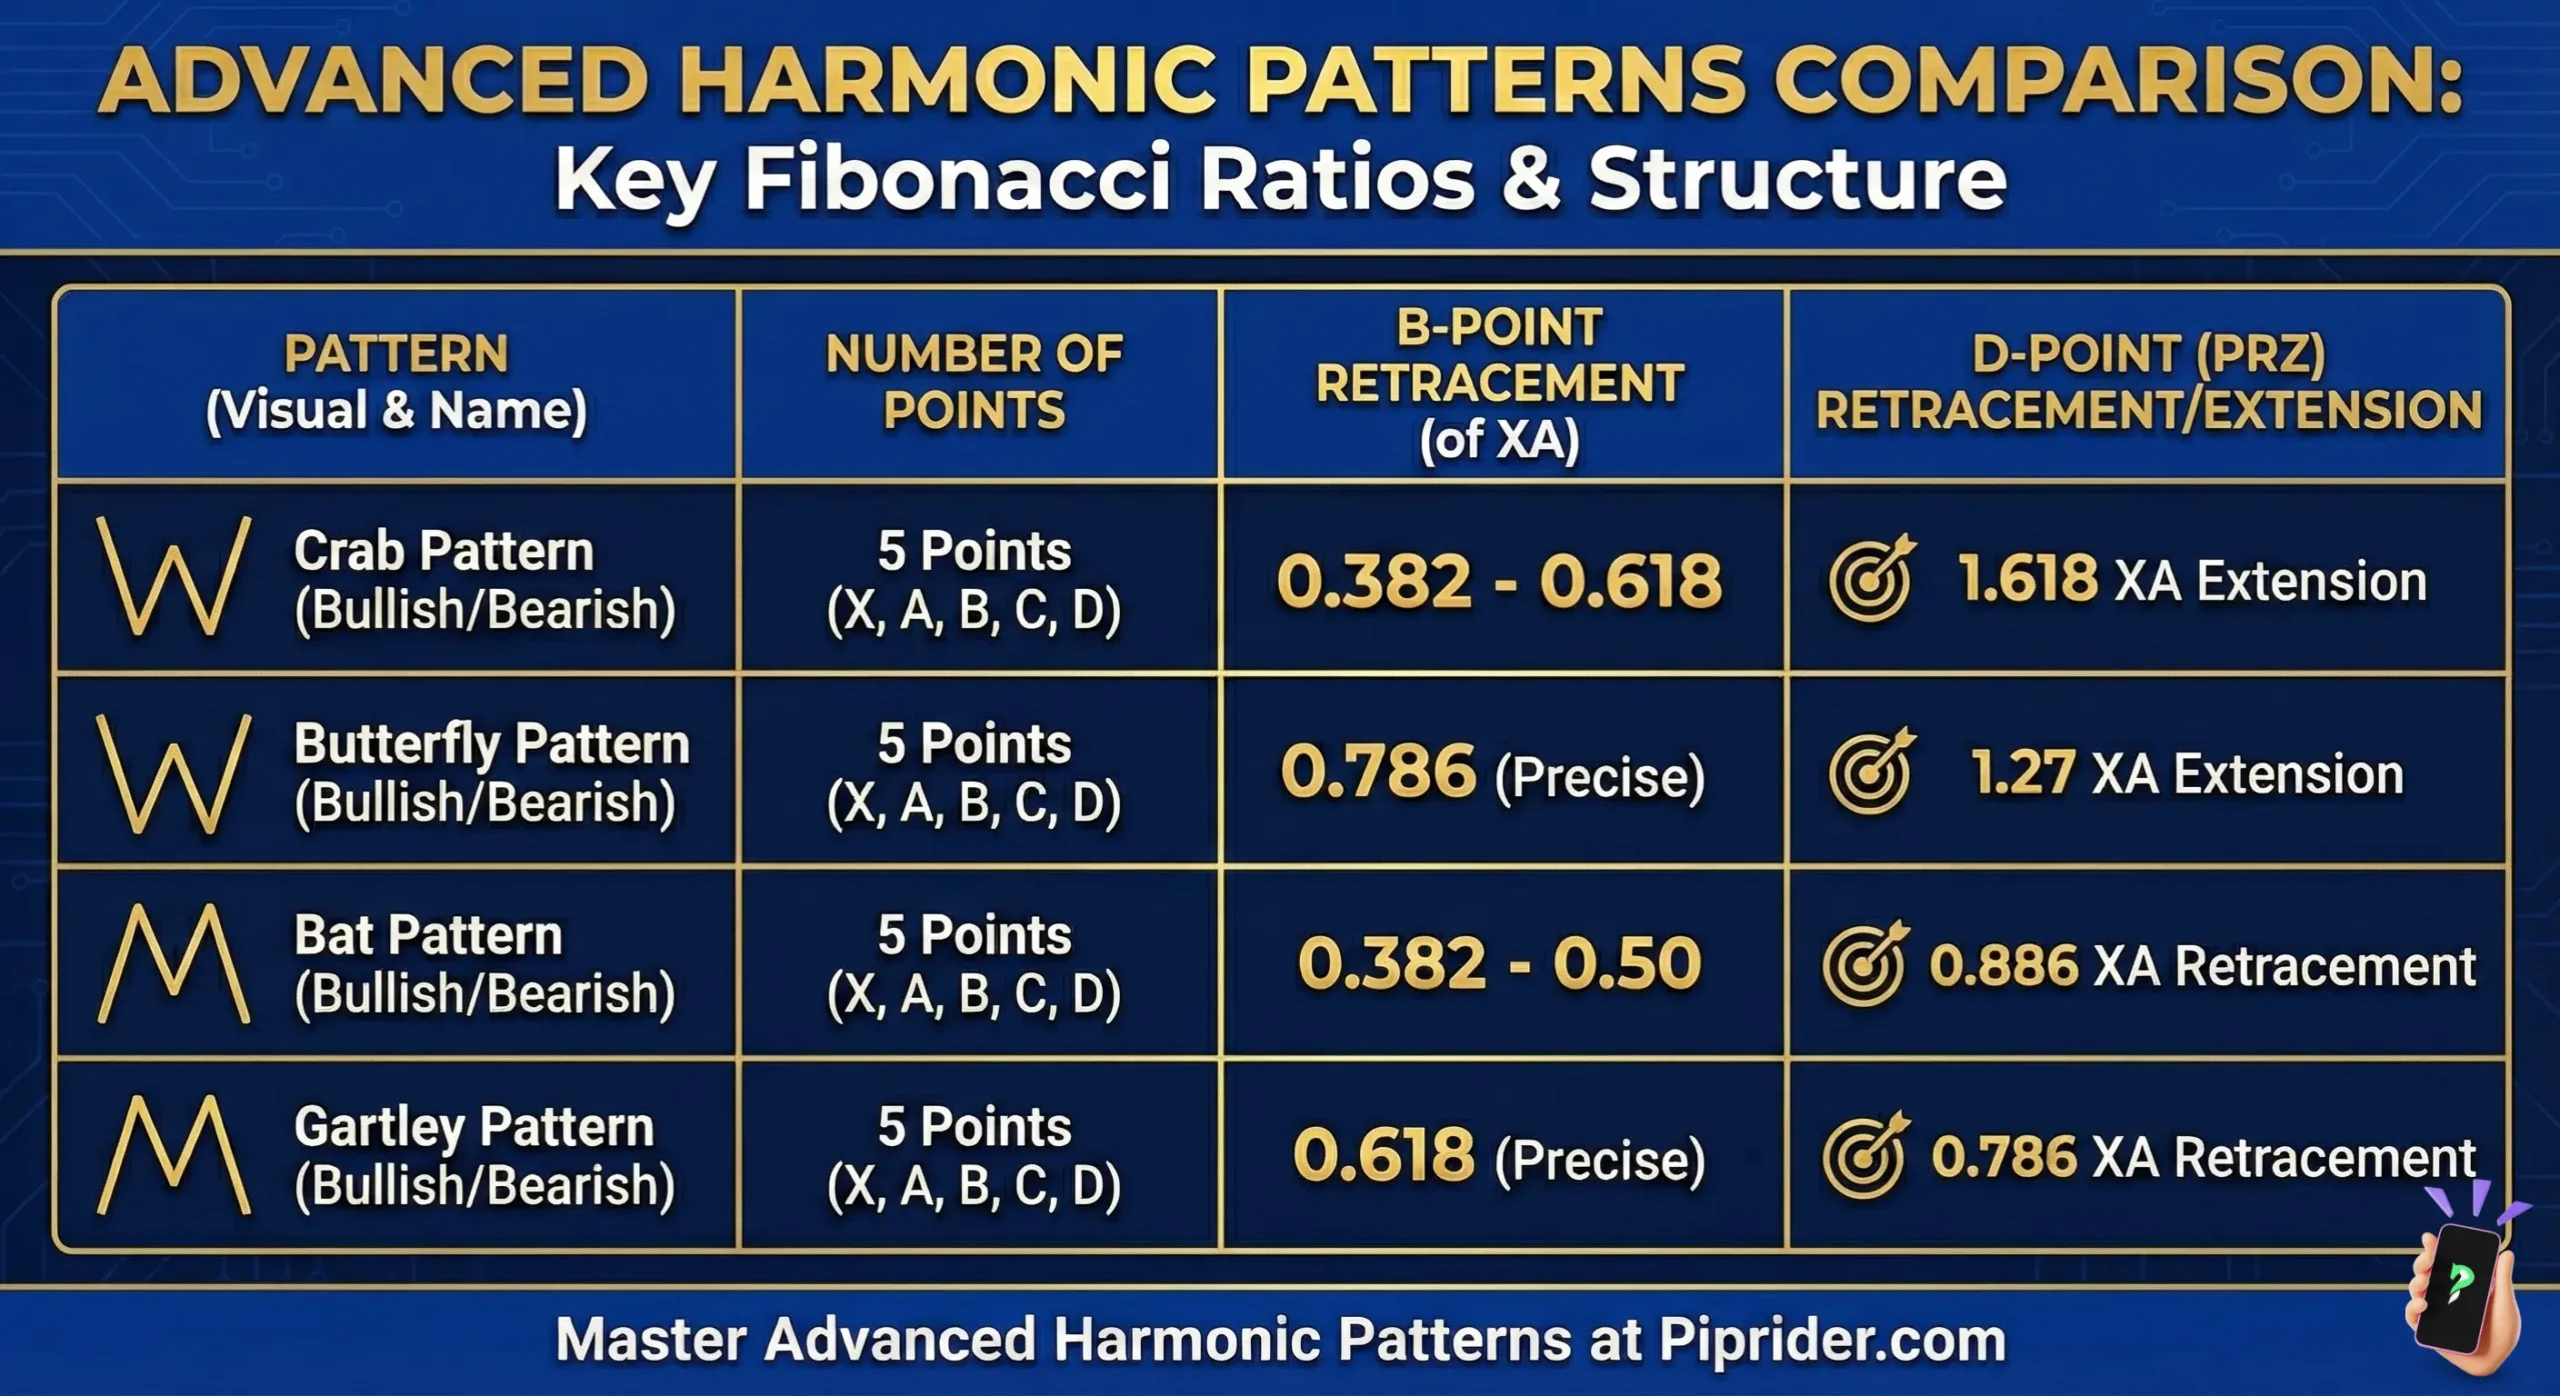
| Pattern | Key B-Point Ratio | Key D-Point (PRZ) | Nature | Difficulty |
|---|---|---|---|---|
| AB=CD | 0.382 – 0.886 | D at 1.27 – 1.618 | Reversal | Easy |
| Gartley | 0.618 of XA | 0.786 of XA | Reversal | Medium |
| Bat | 0.382 – 0.50 of XA | 0.886 of XA | Reversal | Medium |
| Butterfly | 0.786 of XA | 1.272 – 1.618 (Beyond X) | Reversal | Hard |
| Crab | 0.382 – 0.618 of XA | 1.618 of XA | Reversal | Hard |
| Shark | 1.13 – 1.618 of XA | 0.886 – 1.13 (Point C) | Volatile Reversal | Hard |
| Cypher | 0.382 – 0.618 of XA | 0.786 of XC | Advanced Reversal | Hard |
4. 7 Harmonic Patterns Every Trader Should Know
While many variations exist, these seven patterns form the core of harmonic trading. Beginners should master the foundational AB=CD before moving to the advanced XABCD structures.
Although primarily famed for reversals, advanced traders also use variations of these structures as complex continuation candlestick patterns. For example, a bullish Gartley forming within a larger uptrend can signal a high-probability opportunity to rejoin the primary move.
4.1. The AB=CD Pattern: The Foundation Model
The AB=CD pattern is the most basic harmonic structure and serves as the internal component for almost all other patterns. It consists of two equal price legs (AB and CD) connected by a retracement (BC).
- Ratio: Point C must retrace 0.382 to 0.886 of the AB leg.
- Completion: The CD leg should be an extension of 1.272 to 1.618 of the BC leg, ideally where the price distance of AB equals CD.
- Importance: Mastering this helps you identify the “CD leg” in more complex patterns like the Gartley or Bat.
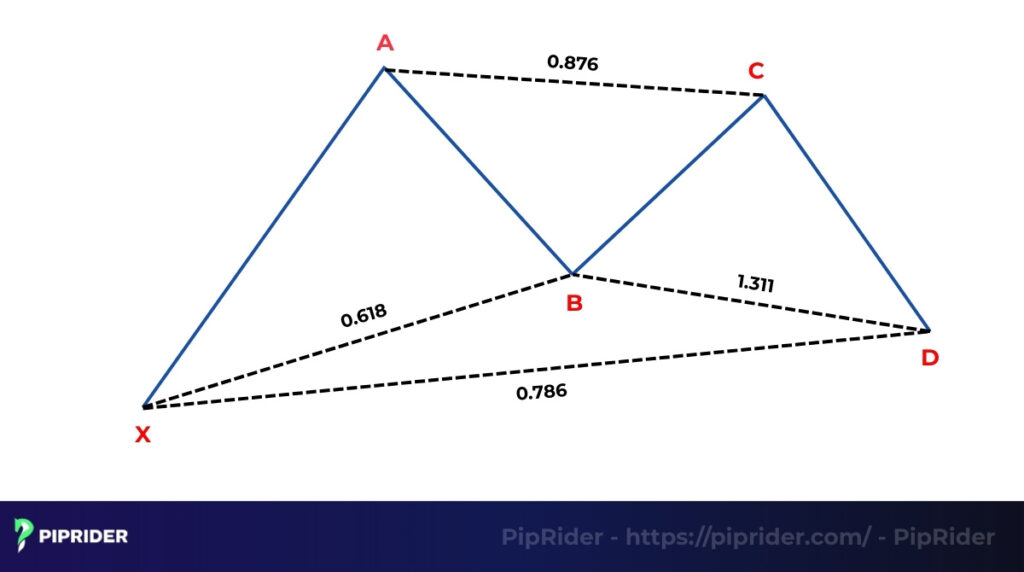
4.2. Gartley Pattern
The Gartley pattern, also known as “Gartley 222” is one of the foundational harmonics, first identified by H.M. Gartley in 1935. It is a common four-leg (XA, AB, BC, CD), five-point (X, A, B, C, D) reversal pattern, resembling an “M” (bullish) or “W” (bearish) shape (Gartley, 1935; StockCharts, n.d.; TradingView, 2023).
Structure and Key Fibonacci Ratios
The defining characteristics of a Gartley pattern are its precise Fibonacci patterns in Forex:
- XA: The initial impulse leg.
- AB: Retraces 0.618 of the XA leg.
- BC: Retraces between 0.382 and 0.886 of the AB leg.
- CD: Extends between 1.272 and 1.618 of the BC leg.
- D point (PRZ): Completes at a 0.786 retracement of the entire XA leg.
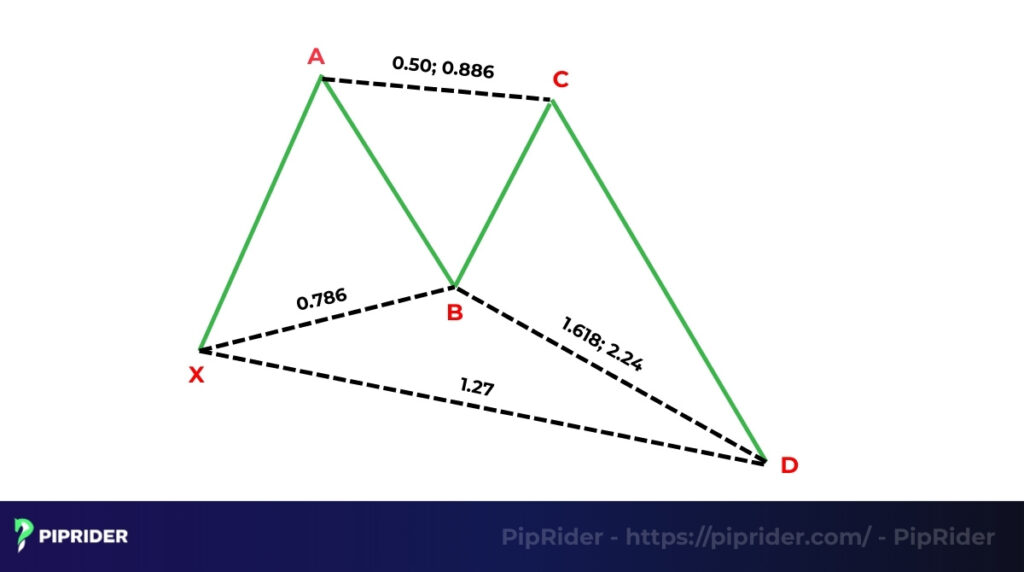
4.3. Bat Pattern
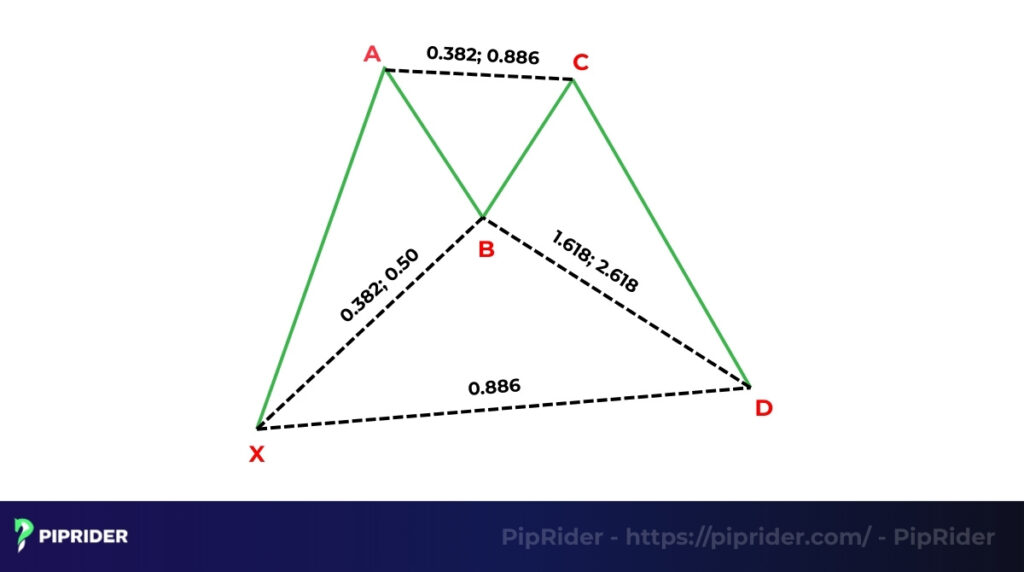
The BAT pattern, identified by Scott Carney in 2001, is a precise harmonic pattern known for its unique structure that forms clear PRZ for traders (Carney, 2001; StockCharts, n.d.).
A primary distinguishing feature of the Bat pattern is that the AB leg retraces 0.50 (50%) of the initial XA leg. This retracement is notably shallower than that of the Gartley pattern, which typically retraces 0.618 at point B.
The D point of the Bat pattern completes at an 0.886 retracement of the entire XA leg, creating a deep and significant Potential Reversal Zone. This PRZ is where traders anticipate a high-probability reversal.
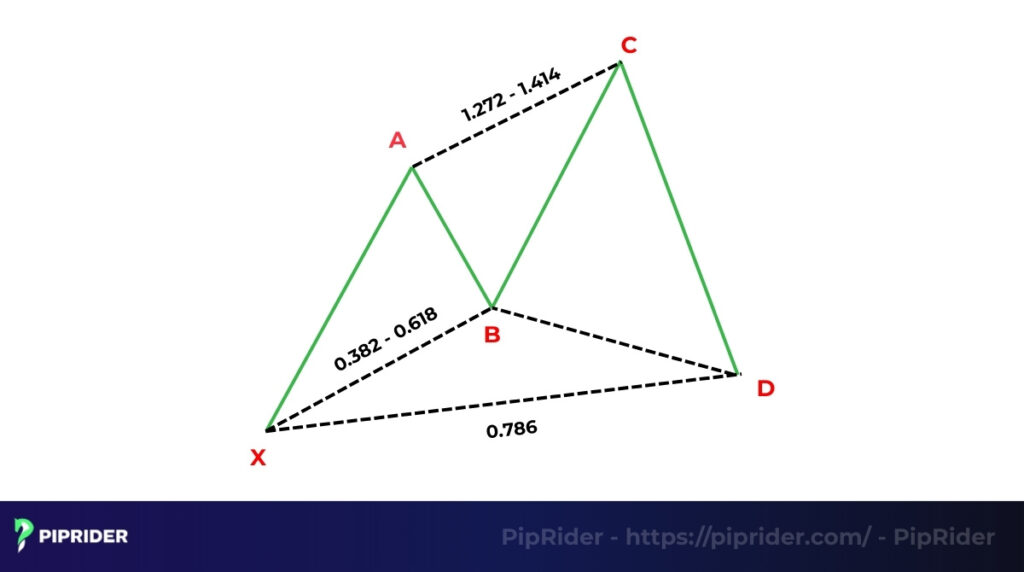
4.4. Butterfly Pattern
The Butterfly pattern, discovered by Bryce Gilmore, is a powerful harmonic pattern known for signaling strong reversals. It is a four-leg (X-A, A-B, B-C, C-D) reversal pattern.
The most defining characteristic of this pattern is that its D point, which forms the PRZ, extends beyond the initial X point.
Due to the structure, it often provides a potent and high-probability signal for an impending market reversal. Traders view it as a robust indicator within the Forex market.
The critical Fibonacci ratio to identify this pattern is: AB: Retraces 0.786 of the XA leg. This crucial retracement helps in accurately plotting point B, which in turn aids traders in defining the PRZ.
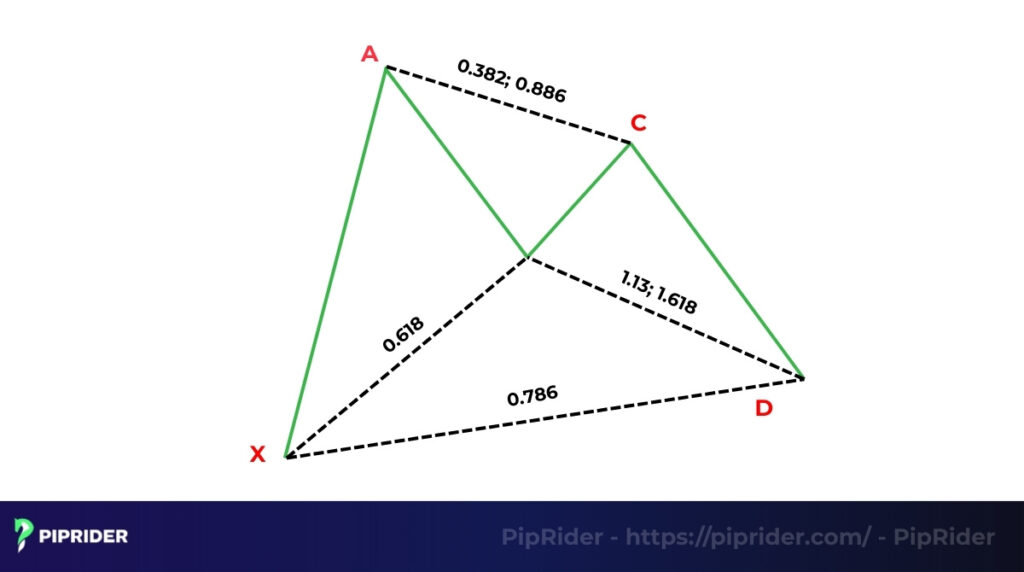
4.5. Crab Pattern
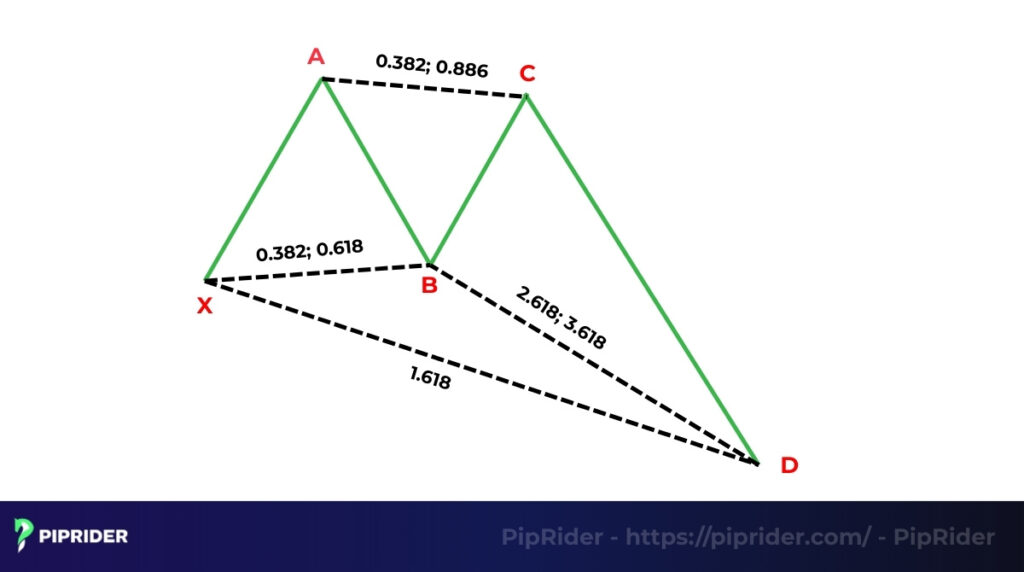
The Crab pattern, another significant discovery by Scott Carney, is widely regarded by traders as one of the most powerful harmonics due to its powerful extended move. This four-leg (X-A, A-B, B-C, C-D) pattern allows traders to identify potential market entries at extreme highs or lows. This includes the famous deep crab pattern.
The most defining feature of the Crab pattern is the extreme 1.618 extension of the initial XA movement. This specific Fibonacci extension is crucial as it determines the PRZ, often signaling a high-conviction reversal from an extended move.
Due to its deep D point completion and significant prolongation, the Crab pattern is frequently considered the “strongest” or most reliable among harmonic patterns for predicting sharp and decisive reversals.
4.6. Shark Pattern
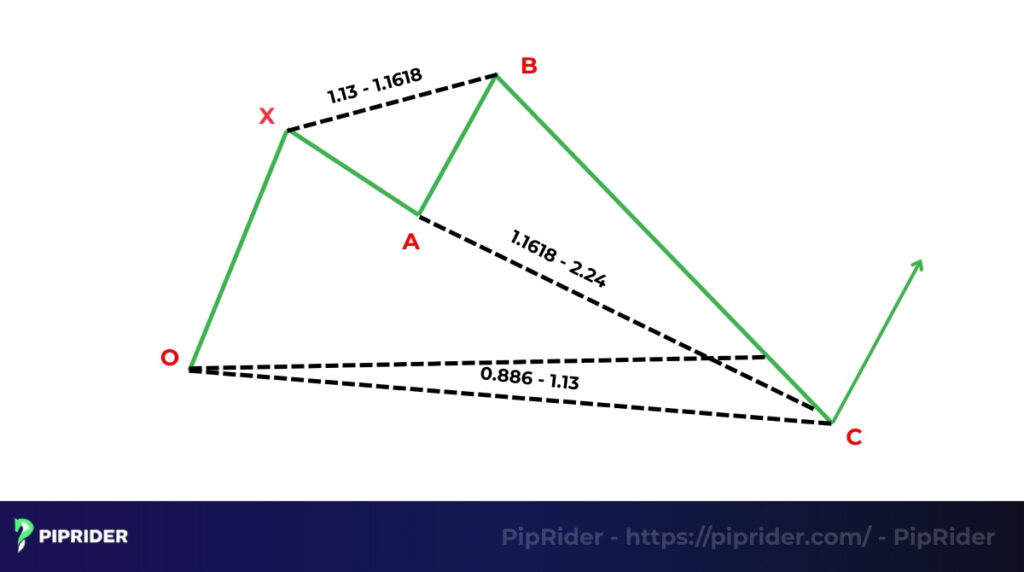
The Shark pattern, also discovered by Scott Carney, is a unique five-point reversal structure (labeled O, X, A, B, C) that is often found in high volatility market conditions. Unlike many other harmonic patterns that use point D as an entry, the Shark pattern uses point C as the reversal point.
This pattern is frequently identified in trending or volatile markets where price is moving quickly. The Shark pattern is typically a signal for a short-term reversal. The trade is taken at point C, with a pre-defined profit target at point D.
4.7. Cypher Pattern
The Cypher pattern is a less common but highly effective harmonic pattern, known for providing quality reversal signals. It is a four-leg (XA, AB, BC, CD), five-point (X, A, B, C, D) reversal structure that has a distinct “C” shape within its formation.
The Cypher pattern is generally rarer to find on charts compared to the Gartley or Bat. However, this rarity often correlates with the high quality of the reversal signals it generates for traders.
When identified correctly, the Cypher pattern is considered to offer high-quality reversal signals. Its precise Fibonacci alignments indicate strong probability zones for market turns.
5. How to Identify a Valid Harmonic Pattern
Validation is the primary filter for quality. To ensure a pattern is valid:
- Spot a potential “M” or “W” shape.
- Label points X, A, B, C, and D accurately.
- Match measurements against the strict ratios in the cheat sheet.
- Confirm that multiple Fibonacci levels converge in the PRZ.
6. Essential Tools for Harmonic Trading
To trade harmonics effectively, you need more than just a standard price chart. The following tools are essential for precision:
- Fibonacci Drawing Tools: Most platforms like TradingView or MT4 provide built-in tools to measure retracements and extensions.
- Harmonic Scanners: Automated software can scan thousands of symbols to find emerging patterns, saving hours of manual work.
- Momentum Oscillators: Using [RSI divergence] is the most effective way to confirm that a pattern is ready to reverse at the PRZ.
7. How to Trade Harmonic Patterns Step by Step
To move beyond theory, successful traders follow a strict execution workflow. Do not enter a trade simply because a shape looks complete.
Step 1: Context and Identification
Analyze the overall trend. Are you looking for a reversal or a continuation? Use a scanner or your eyes to spot emerging “M” (bullish) or “W” (bearish) structures.
Step 2: Precise Measurement
Label the points X-A-B-C-D. Use the Fibonacci Retracement tool on the XA leg to check point B. If the ratio does not match (e.g., 0.618 for Gartley), discard the setup. Precision is the primary filter for quality.
Step 3: Map the Potential Reversal Zone (PRZ)
Identify the exact price area where the D-point completes based on the pattern’s rules. This is your “landing strip.”
Step 4: Wait for Confirmation (The Trigger)
Do not set a limit order at the PRZ. Wait for the price to hit the zone and show signs of rejection. Look for:
- Reversal Candlesticks: Pin bars, morning/evening stars, or engulfing candles.
- Indicator Divergence: RSI or MACD showing bullish/bearish divergence at the PRZ.
Step 5: Trade Execution and Management
- Entry: Enter at the close of the confirmation candle.
- Stop Loss: Place the SL 5-10 pips beyond Point X (for most patterns) or Point D (for deep extensions like the Crab).
- Take Profit: Set TP1 at the 0.382 retracement of the AD move and TP2 at the 0.618 retracement. Move SL to break-even once TP1 is hit.
Real Trade Example: Bullish Gartley on EUR/USD (H4 Timeframe)
- Instrument: EUR/USD
- Timeframe: 4-Hour (H4)
- Pattern: Bullish Gartley
- Execution: Point B retraced exactly 0.618 of XA. As price entered the 0.786 PRZ at 1.0850, a bullish engulfing candle formed alongside an oversold RSI signal.
- Result: Trade entered at 1.0865. Stop loss at 1.0810. Target 1 (TP1) hit at 1.0920 (0.382 AD). Stop loss moved to break-even. Target 2 (TP2) hit at 1.1010 (0.618 AD).
Read more:
How to Trade Using the Evening Star Pattern
8. Best Harmonic Patterns for Beginners
If you are new to harmonics, do not try to learn all seven at once. Focus on this hierarchy to build consistency:
- AB=CD: Start here. It teaches you how to measure legs and find completion points without the complexity of an X-point.
- Gartley: This is the most “standard” five-point pattern. It has very clear rules (0.618 B-point) that are easy to spot on higher timeframes (H4 or Daily).
- Bat: Highly reliable due to its deep 0.886 retracement. It often provides the best risk-to-reward ratios because the stop loss is very close to the entry.
Avoid patterns like Shark or Cypher until you are proficient with Fibonacci tools, as their measurement logic differs from the standard XABCD rules and can lead to confusion.
9. Common Mistakes When Trading Harmonic Patterns
To maintain profitability, avoid these frequent errors:
- Forcing the Chart: Trying to make a random shape fit a pattern’s ratios.
- Incorrect Measurements: Being sloppy with Fibonacci tool placement.
- Entering Early: Trading as soon as price touches the PRZ without waiting for a candle trigger.
- Ignoring Trend Context: Trying to trade [reversal chart patterns] against a massive parabolic trend.
10. Pros and Cons of Harmonic Patterns
Like any advanced trading method, harmonics have a distinct set of advantages and disadvantages. Understanding both sides is crucial for integrating them into your trading plan effectively.
10.1. Pros
First, let’s explore the key advantages that make these patterns a powerful tool in trading.
- High precision and accuracy: When identified correctly, harmonic patterns can offer a high degree of precision, defining a very specific zone (the PRZ) for a potential reversal. This mathematical approach removes much of the guesswork.
- Clear entry and risk levels: Harmonic trading provides clear and objective rules. The D point offers a well-defined entry area, while the X point provides a logical level for placing a stop loss, creating clear risk-reward scenarios.
10.2. Cons
While powerful, traders must be aware that harmonic patterns are time-intensive to identify and require significant patience. They often perform poorly in “choppy” or “noisy” sideways markets where Fibonacci levels are frequently ignored. Furthermore, the subjectivity in selecting the starting “X” point can lead to different traders seeing different patterns on the same chart, which may result in false signals if not validated by secondary indicators.
11. Harmonic Patterns vs. Classic Chart Patterns
Harmonic patterns are mathematically objective based on ratios, while classic patterns like triangles or head and shoulders are more subjective and visual. Harmonics offer precise entry points, whereas classic patterns often rely on break-outs from “necklines” or trendlines.
12. FAQs
13. Summary
Harmonic patterns offer traders a mathematically driven approach, deeply rooted in Fibonacci ratios, to predict potential market reversals. While their intricate nature can make them challenging to identify manually, their precision, when correctly applied, can significantly enhance trading accuracy.
By diligently combining valid harmonic trading setups with robust risk control, confirming price movement, and leveraging supportive tools, traders can integrate these advanced Fibonacci patterns in Forex into their strategy. This systematic approach can lead to improved long-term trading performance and more confident trading decisions.
To further expand your knowledge on visual price analysis and discover more powerful setups, we encourage you to explore our comprehensive Forex Chart Patterns section on Piprider. Mastering various charts, alongside harmonics, will undoubtedly sharpen your analytical edge in the markets.
Infographic Section
-
Harmonic pattern structure -
Advanced harmonic patterns comparison -
The Fibonacci guide for harmonic patterns


