
To calculate stop-loss (SL), traders use three key methods: the Percentage Risk Method, the Technical Method, or the Volatility Method. Learning how to calculate stop loss is the single most important skill for managing risk. This guide by Piprider.com is a complete, step-by-step answer to that question, moving from simple formulas to the advanced tools professionals use.
Key Takeaways
- A stop-loss automatically closes your trade to limit losses and protect your assets.
- Always risk only 1–2% of your account per trade for long-term account survival.
- Use clear methods: fixed percentage, support/resistance levels, or ATR volatility.
- Calculate stop-loss in pips before choosing lot size to keep risk consistent.
- Following a structured SL plan builds discipline and prevents emotional trading.
1. What Is a Stop-Loss in Trading?
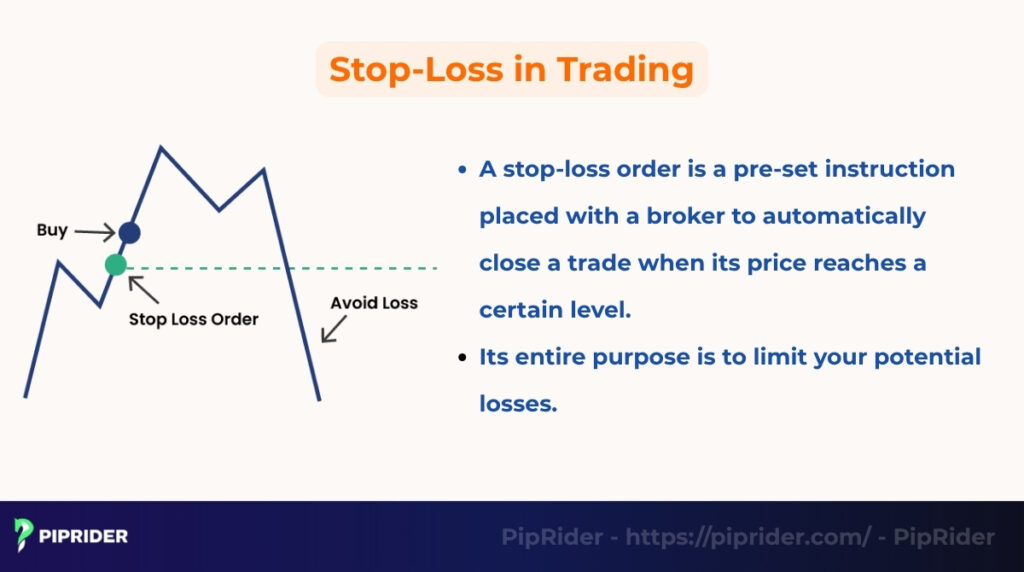
A stop-loss order is a pre-set instruction placed with a broker to automatically close a trade (by selling or buying to cover) when its price reaches a certain level. Its entire purpose is to limit your potential losses.
Also called a “stop order,” it acts as a critical protective tool to safeguard your trading capital and manage risk by controlling your downside exposure. According to financial education site Investopedia (2024), SL orders are essential for preventing significant losses amid market volatility.
Crucially, they ensure that emotions do not cloud your decision-making. This type of order is essential for both new and experienced traders in all markets, including securities like stocks, Forex, and crypto, to preserve their investment.
2. The Functional Role of Stop-Loss Orders
A stop-loss order serves as a primary risk management tool designed to mitigate financial exposure, standardize execution, and maintain the mathematical integrity of a trading strategy.
| Feature | Technical Impact & Benefit |
|---|---|
| Capital Protection | Prevents significant account drawdown and ensures long-term market participation by limiting individual trade losses. |
| Bias Mitigation | Neutralizes cognitive biases such as Loss Aversion by automating the exit process without manual/emotional intervention. |
| Mathematical R:R | Establishes a quantifiable Risk-to-Reward ratio, providing the statistical basis for calculating system expectancy and required win rates. |
2.1. Capital Preservation and Drawdown Control
In professional trading, capital is treated as a limited resource that must be managed to ensure longevity. A stop-loss ensures that losses from individual trades remain within predefined limits, preventing significant account drawdowns.
- Risk Mitigation: It prevents a single adverse market event or a string of losses from compromising the total account balance.
- Mathematical Recovery: By limiting a loss to 1%, a trader only needs a 1.01% gain to recover. Without a stop-loss, a 50% drawdown requires a 100% gain just to reach break-even.
2.2. Mitigation of Cognitive Biases
Human decision-making is often compromised by Loss Aversion—the psychological tendency to prefer avoiding losses over acquiring equivalent gains. This bias often leads traders to hold losing positions longer than planned in the expectation of a reversal.
- Objective Execution: A pre-set stop-loss acts as an automated, rule-based exit that requires no manual intervention during high-volatility periods.
- Systematic Discipline: It ensures the original trade plan is executed faithfully, removing the “discretionary trap” where traders widen stops or remove them entirely under pressure.
2.3. Standardization of Risk-to-Reward (R:R) Ratios
The stop-loss price is the essential denominator in the Risk-to-Reward (R:R) equation. Without a fixed exit point, the mathematical expectancy of a trading system cannot be calculated or optimized.
- Statistical Edge: A consistent R:R ratio (e.g., 1:2) allows a strategy to remain profitable even with a win rate below 50%. Without a defined stop-loss, profit and loss outcomes become random variables rather than controlled data points.
- Quantifiable Risk: Defining the stop-loss allows for the exact calculation of the dollar amount at risk relative to the potential profit.
3. How to Calculate Stop Loss? (The 3 Key Methods)
The key methods to calculate SL fall into three main groups: capital-based ( Risk %), technical-based (Chart Structure), and volatility-based ( ATR – Average True Range).
The best method depends on your trading style and risk tolerance, but all are superior to random placement.
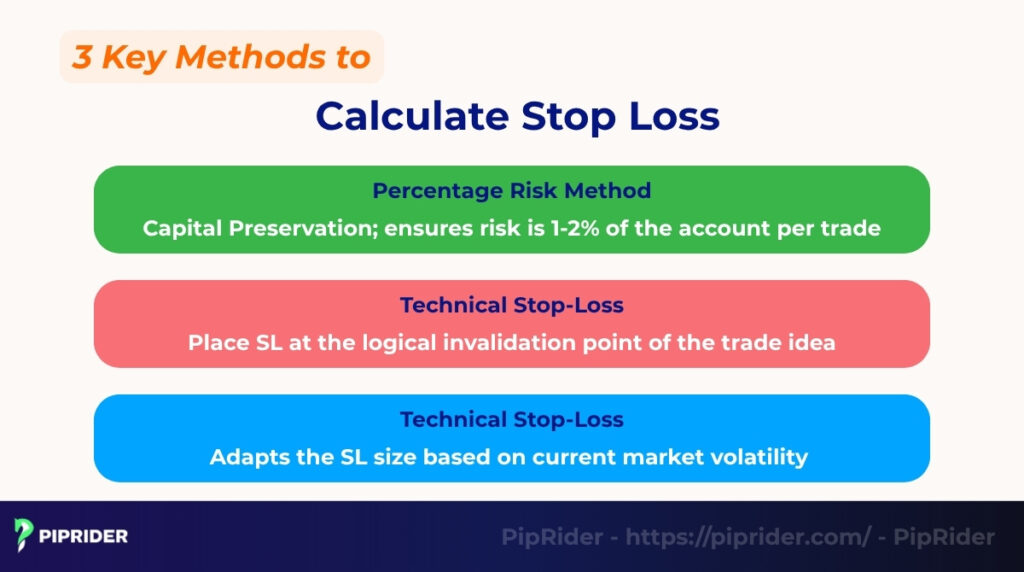
3.1. The Percentage Risk Model (Position Sizing)
The Professional Mindset: A common beginner mistake is choosing a random lot size first and then trying to fit a stop-loss around it. This is backward and dangerous. According to risk management expert Tharp (2006), the market structure should dictate your stop-loss, and your account size should dictate your volume.
The 4-Step Professional Workflow
To calculate your trade size correctly, always follow this order:
- Identify Technical SL (Pips): Find a logical level on the chart (e.g., below a support zone). Measure the distance in pips from your entry to this level.
- Determine Dollar Risk ($): Calculate your maximum loss based on your account balance (e.g., 1% of $10,000 = $100).
- Calculate Lot Size: Use the formula below to find the exact volume that keeps your risk consistent.
- Execute: Input the lot size and SL price into your platform.
The Golden Formula
📉 Position Size Formula
Lot Size = Risk Amount ($) ÷ (SL Pips × Pip Value per Lot)
Real-World Example
Imagine you are trading EUR/USD with a $5,000 account:
- Step 1 (The Chart): You find a buy setup with a technical stop loss 50 pips away.
- Step 2 (The Money): You risk 2% of your account ($5,000 × 0.02 = $100 risk).
- Step 3 (The Math): Assuming a standard lot pip value of $10.
- $100 ÷ (50 pips × $10) = 0.20 Lots.
- Step 4 (The Order): You open the trade with exactly 0.20 lots.
The Result: Whether your stop loss is 10 pips or 100 pips, your total loss will always be exactly $100. Maintaining this consistency is the fundamental pillar of long-term survival in the markets.
3.2. Technical Stop-Loss
Technical method uses the chart’s structure to place a stop-loss at a logical level. You set your stop just beyond a key technical barrier, such as a support or resistance threshold. The logic is that if this level breaks, your trade idea is likely invalidated.
This is a favorite method for price action traders and swing traders.
- For a BUY (Long) trade: Place your SL just below a strong support level, a recent swing low, a rising trendline, or a key moving average.
- For a SELL (Short) trade: Place your SL just above a strong resistance level, a recent swing high, a falling trendline, or a key moving average.
Example:
You want to buy EUR/USD at 1.1000. You notice a strong support level at 1.0970. A technical stop-loss order would be placed just below that level, at 1.0965 (allowing 5 pips of “breathing room” for noise).
3.3. Volatility-Based Stop-Loss
Volatility-based stop-loss is the most professional method, as it adapts your stop-loss order based on the market’s current volatility or market conditions. In a “choppy” (highly volatile) market, you use a wider stop. In a “quiet” market, you use a tighter stop.
The most common tool for this is the Average True Range (ATR) indicator. The ATR measures the average trading range over a specific period (e.g., 14 days).
How to Calculate:
- Find the current ATR value on your chart (e.g., 14-period ATR).
- Choose a Multiplier. A common multiplier is 2x or 3x.
- Place your stop-loss at that distance from your entry.
Long Trade: SL = Entry − (ATR × Multiplier)
Short Trade: SL = Entry + (ATR × Multiplier)
Example:
- Trade: Buy GBP/USD
- Entry Price: 1.2500
- 14-Period ATR Value: 0.0030 (or 30 pips)
- Multiplier: 2x
- Stop Distance: 30 pips × 2 = 60 pips
- Stop-Loss Price: 1.2500 – 0.0060 = 1.2440
3.4. The Slippage Reality: Stop-Market vs. Stop-Limit
A common misconception is that a stop-loss guarantees an exit at your exact price. In reality, a stop-loss is merely a trigger. Once the market touches your level, the order is activated, but the final execution price depends heavily on market liquidity and order types (Investopedia, 2024).
Understanding Order Types
Most retail platforms use Stop-Market orders by default. However, understanding the difference between Market and Limit execution is vital for surviving high-volatility events like CPI or NFP releases.
⚙️ Critical: Stop-Market vs. Stop-Limit
Triggers a Market Order immediately when price hits the level.
✅ Pro: Guaranteed exit (Safety first).
⚠️ Con: Subject to Slippage (Exit price may deviate).
Triggers a Limit Order only at a specific price.
✅ Pro: Zero slippage (Precise price).
⚠️ Con: No-Fill Risk. If price gaps, trade stays open (Catastrophic).
💡 The “Phantom” Hit: Why did SL trigger early?
Charts show the Bid price. But Buy Stop orders trigger at the Ask price. During news, the spread widens, allowing the Ask to hit your SL while the Bid (chart) remains far away.
💡 The Professional’s Choice: Most experienced traders prefer Stop-Market for emergency protection. It is often safer to accept a slightly worse price (Slippage) than to have a Stop-Limit order fail to execute while the market crashes 500 pips against you.
Beware of Gaps and Slippage
Market conditions can change in milliseconds, leading to two main risks:
- Price Gaps: During weekends or major news, the price can “jump” over your level. If you have an SL at 1.1000 and the market reopens at 1.0950, your order will be filled at 1.0950—significantly away from your plan.
- Negative Slippage: In fast-moving markets, there may not be enough buyers/sellers at your exact price. Your broker will fill you at the next available price, which is often less favorable than your original stop.
4. How Does Stop-Loss Relate to the Risk-to-Reward Ratio?
The stop-loss order is the mathematical foundation of your ‘Risk’ (R) in the Risk-to-Reward (R:R) ratio. This ratio defines the relationship between your potential loss and your potential profit before you ever enter a trade.
The Math of Viability
A 1:2 R:R ratio means that for every $1 you risk, you aim to make $2. This structure is designed to help a trader remain viable even if they lose more trades than they win.
- Risk (SL): $100 (e.g., 20 pips)
- Reward (TP): $200 (e.g., 40 pips)
- R:R Ratio: 1:2
Theoretical vs. Real-World Win Rates
Mathematically, with a 1:2 R:R ratio, the break-even win rate is approximately 33.3%. Theoretically, winning just 34% of your trades would keep the account in a net positive.
However, in live trading, these numbers are higher due to friction costs:
- Spreads: The cost paid to the broker on every entry.
- Commissions: Fixed fees per lot traded.
- Slippage: Execution at a price less favorable than your stop-loss during volatility.
Because of these factors, a trader requires a slightly higher win rate than the theoretical minimum to cover costs and remain profitable. A break-even point can be achieved at a low win rate only if the R:R is sufficient and trading costs are strictly controlled.
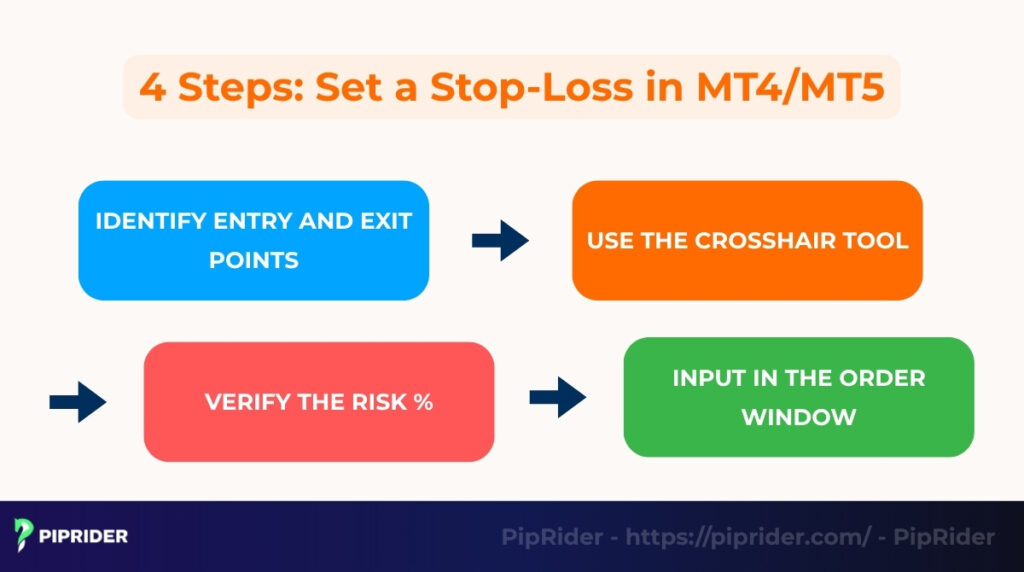
5. How Do You Set a Stop-Loss in MT4/MT5?
To set SL in MT4/MT5, you first identify your stop price on the chart, then open a ‘New Order’ (F9), and finally type that exact price into the ‘Stop-Loss’ field before placing the trade order.
This step-by-step guide shows you the practical workflow.
5.1. Step 1 – Identify Entry and Exit Points
Before opening a trade, you must have a complete plan. This means identifying your exact entry price, profit target, and SL price. This plan should be based on the chosen method (e.g., technical support/resistance or ATR), not on a whim or emotion.
5.2. Step 2 – Use the Crosshair Tool
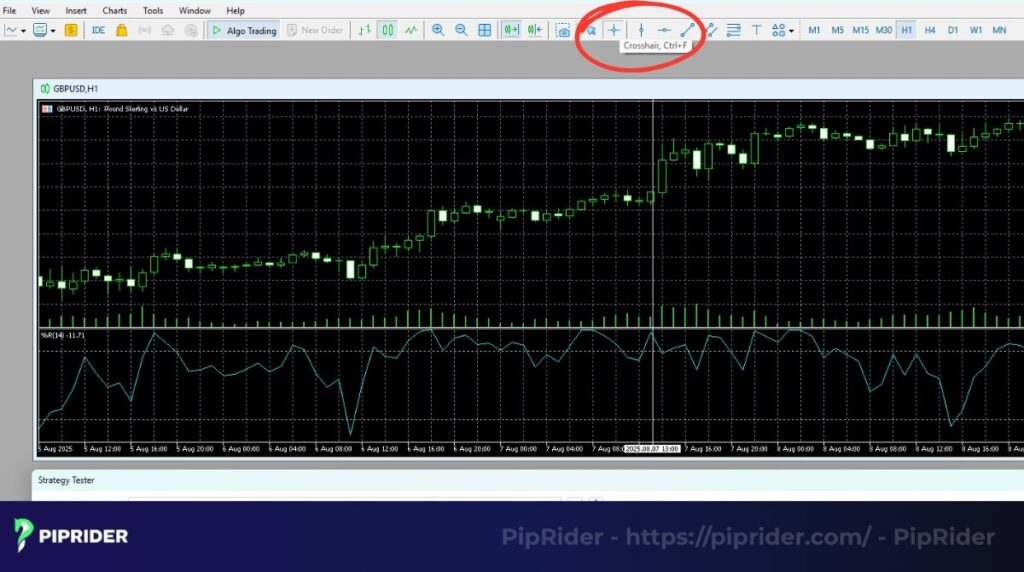
On MT4 or MT5 chart, click the Crosshair tool (looks like a plus sign). Click and drag from the intended entry price to the intended SL price. The platform will show you the exact distance in pips and price. Note this pip distance for the next step.
5.3. Step 3 – Input in the Order Window
When you open a “New Order” (F9 key) in your broker’s platform, a window will pop up. Do not just click “Buy” or “Sell” yet.
- First, select your Volume (Lot Size).
- Second, find the “Stop-Loss” field and type in the exact price (not pips) you identified.
- This applies to ‘Market Execution’ order types. For ‘Pending Order’ types, you set the SL at the same time you set your future entry price.
5.4. Step 4 – Verify the Risk % (Crucial)
This is the final check before you place the trade. Your Lot Size (Step 3) and Stop-Loss pips (Step 2) combine to create your total dollar risk.
Use an external Position Size Calculator (from Myfxbook or Babypips). Input your account currency, 1-2% risk, the pip distance, and the currency pair. The calculator will tell you the exact lot size you must use. If it’s different from what you entered, adjust it.
5.5. How to Set or Modify a Stop-Loss on an Open Trade
What if your trade is already open and you forgot to set a stop? Or what if you want to move your stop to break-even?
- Go to the ‘Trade’ tab in your MT4/MT5 Terminal.
- Right-click on the open position you want to modify.
- Select ‘Modify or Delete Order’.
- A new window will appear. You can now enter or update the price in the ‘Stop-Loss’ field.
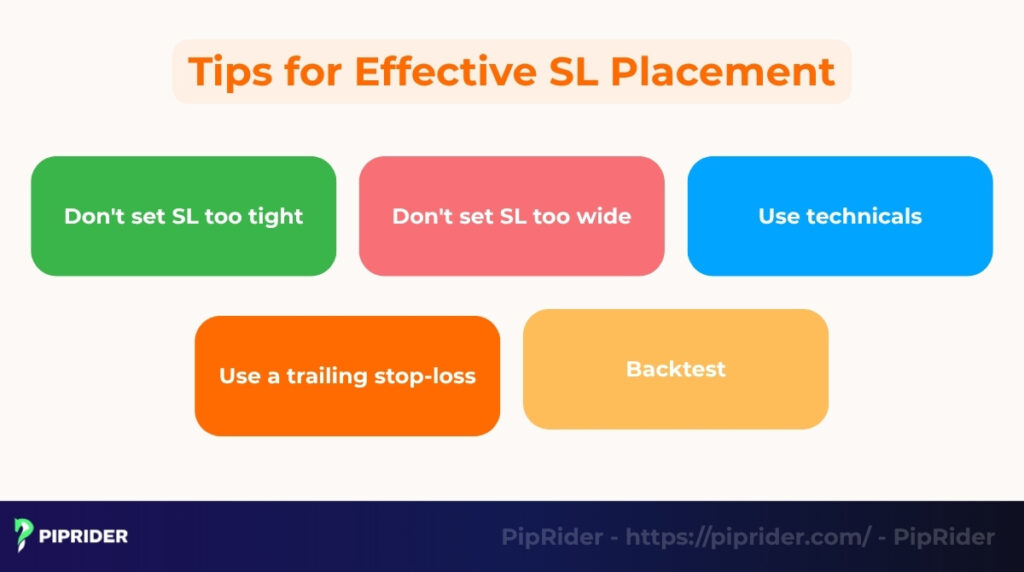
6. What Are the Best Tips for Effective SL Placement?
Effective stop-loss placement is about finding the balance between protecting your capital and giving the market enough room to breathe. Professional traders don’t just “guess”; they use a systematic approach to define their safety margin.
6.1. The “Buffer” Rule (Accounting for Spread & Noise)
Never place your stop-loss exactly on a support or resistance level. Because the price you see on the chart is often the Bid price, and your buy/sell orders are filled at the Ask price, the Spread can trigger your stop even if the candle never touches your level.
To avoid this “stop-hunting” effect, you must add a technical buffer to your final price:
How to calculate the professional Buffer: A robust rule is to use the greater of your broker’s spread multiplier or a fraction of market volatility (ATR):
- Spread × 2: This protects you during minor spread widening at session opens or during low liquidity.
- ATR × 0.1: This accounts for “market noise” or wicks that often peak just beyond obvious levels before reversing.
6.2. Avoid “Psychological” Round Numbers
Retail traders and “big money” algorithms love round numbers (e.g., 1.1000, 2000.00). These are high-liquidity zones where price often spikes briefly to “collect” stops before moving in the intended direction.
- Pro Tip: If your technical SL is at 1.1000, move it to a “random” number like 1.0987. Staying outside these psychological zones increases your trade’s survival rate.
6.3. Sync with Slippage and News Realities
During high-impact news (like CPI or NFP), the spread can widen significantly, and slippage becomes common.
- The News Rule: If you are trading through news, your buffer should be even larger to compensate for the “Liquidity Gap” mentioned in Section 3.5.
- The Discipline Check: If the required buffer makes your Stop-Loss so wide that your Risk-to-Reward ratio drops below 1:1, skip the trade. A bad entry is always better than a forced trade with a “hope-based” stop.
7. What Are the Most Common SL Mistakes to Avoid?
The most common mistake is moving your stop-loss further away from your entry (i.e., widening your loss) because you “hope” the price will reverse. This is an emotional decision that destroys accounts.
Other common mistakes include:
- Not using a stop-loss: The second cardinal sin. This is “hope” trading. It’s the fastest way to blow up your account.
- Random placement: Placing a stop “15 pips” away on every trade without considering volatility or chart structure. This is lazy and ineffective.
- Forgetting spread & news: During high-volatility news, the spread (difference between buy/sell price) can widen and trigger your SL, even if the chart price didn’t reach it.
8. Advanced Stop-Loss Techniques for Professional Trading
Beyond static orders, professional traders use dynamic stop-loss strategies to adapt to shifting market conditions. These techniques prioritize capital efficiency and profit protection.
8.1. Trailing Stop-Loss (Trend Following)
A Trailing Stop-Loss is a dynamic order that automatically adjusts as the price moves in a profitable direction. For long positions, the stop rises with new highs, maintaining a fixed distance from the current price.
- Mechanism: It “locks in” profits without requiring manual adjustment.
- Strategic Value: Best for Trend Following strategies where the goal is to “let winners run” while protecting against sudden reversals.
8.2. Partial Close and Break-Even (The “Risk-Free” Trade)
This strategy involves closing a portion of the position (e.g., 50%) at a specific milestone, such as a 1:1 Risk-to-Reward ratio, while moving the remaining stop-loss to the Entry Price.
- Mechanism: It eliminates the possibility of a net loss on the trade.
- Strategic Value: Provides a significant psychological edge and ensures a profitable outcome even if the market reverses after the first target is hit.
8.3. Dynamic ATR Stop (Volatility-Adjusted)
The Average True Range (ATR) stop uses market volatility to determine the stop-loss distance. Instead of a fixed pip count, the stop is set at a multiplier of current volatility (e.g., 2.0x ATR).
- Mechanism: It widens during high volatility to avoid “market noise” and tightens during low volatility.
- Entities: Often executed through indicators like the Chandelier Exit or Supertrend.
8.4. Time-Based Stop-Loss (The “Dead Money” Exit)
A Time-Based Stop-Loss triggers an exit based on a pre-defined time limit rather than a price level. If a trade remains stagnant for too long, it is closed manually.
- Mechanism: Exits trades where the initial catalyst (e.g., a news spike or breakout momentum) has faded.
- Strategic Value: Maximizes Capital Efficiency by freeing up margin from “dead money” positions for higher-probability opportunities.
9. Frequently asked questions about Calculate Stop Loss
10. Conclusion
Knowing how to calculate stop loss is not just a technical skill; it is the core foundation of your survival and success as a trader. It is your shield, protecting your capital from the market’s inherent volatility and your own emotional decisions.
Whether you trade Forex, crypto, indices, or other securities, your journey to professional trading starts here. Always define your SL based on logic, data (like ATR), and discipline, not on hope or fear.Master these methods, respect your rules, and you will be on the path to long-term success trading securities with Piprider.com.


