The On Neck Pattern is a bearish continuation signal often confused with reversal patterns like the Thrusting or Piercing line candlestick pattern. Understanding the on neck pattern helps traders avoid false buy signals and time their sell orders correctly during a downtrend. This guide explains how to identify the structure, interpret the psychology, and trade it effectively.
Key Takeaways
- The On-Neck Pattern appears in a downtrend and signals bearish continuation, not a reversal.
- It consists of a long bearish candle followed by a small bullish candle that closes near the previous candle’s low.
- Market psychology suggests this pattern represents a failed rally where buyers cannot push the price back up.
- Traders often confuse it with the In-Neck, Thrusting, and Piercing Patterns, which have different closing prices.
- For the best results, combine this pattern with volume, EMA trend lines, and market structure.
1. What Is the On-Neck Pattern?
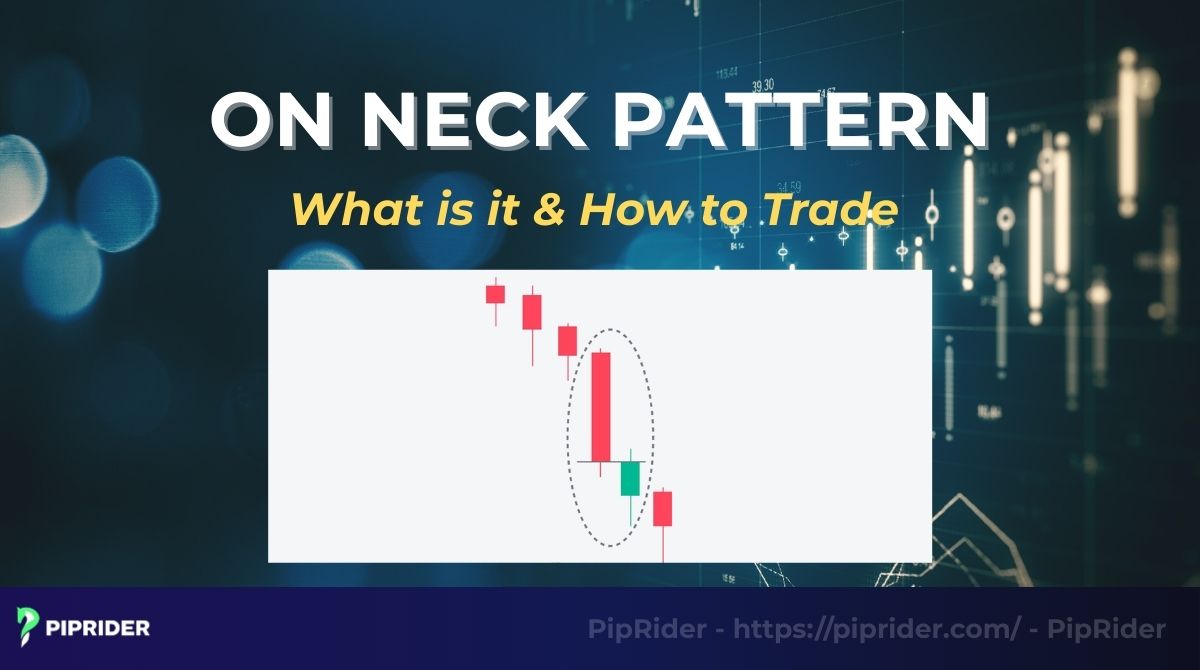
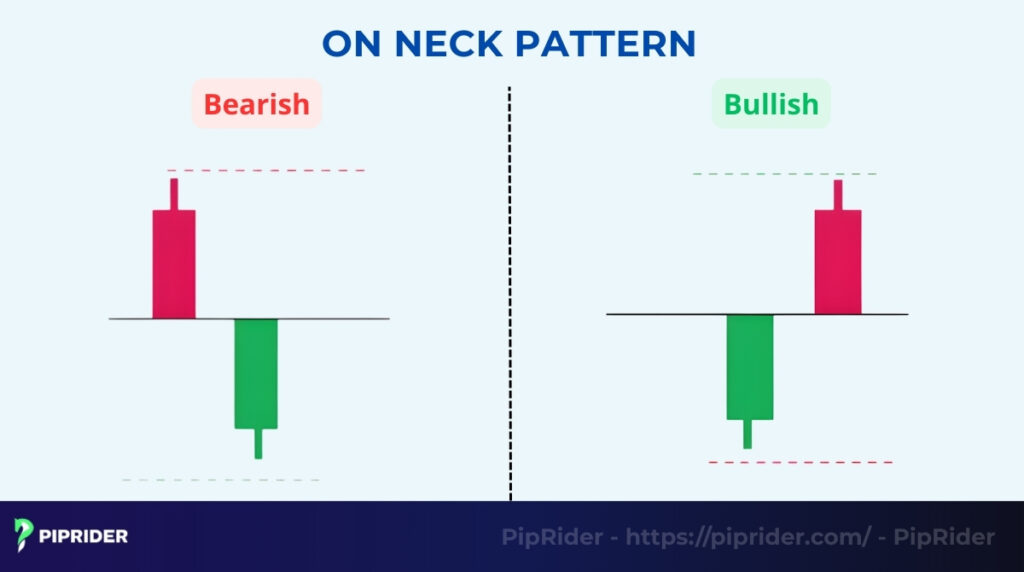
The On-Neck Pattern is a bearish continuation candlestick pattern that appears during a downtrend. It consists of a long bearish candle followed by a smaller bullish candle that gaps down but fails to recover, closing near the previous candle’s low.
In technical analysis, this pattern signals that sellers remain in control and the current price decline is likely to continue.
According to research by Thomas Bulkowski, the On-Neck pattern has a success rate of about 56% (Remesh, 2025). Therefore, traders should never trade it blindly; it requires confirmation from other technical indicators or a third candle to break the low.
1.1. Characteristics (Identification Checklist)
To confirm this candlestick pattern, look for these four specific criteria:
- Trend: The market must be in an existing downtrend.
- First candle: A long, bearish (red) candle showing strong selling pressure.
- Second candle: A smaller, bullish (green) candle that gaps down at the open.
- The close (The “neck”): The second candle rallies slightly but closes at or very near the low of the first candle. It fails to push back into the previous candle’s body.
1.2. Why Is It a Trend Continuation, Not a Reversal?
Traders often mistake the second green candle for a buy signal. However, this is a trap. The pattern is bearish because the bulls (buyers) failed to push the price up.
Although they managed to form a green candle, they hit a “ceiling” at the previous low and could not drive the price back inside the previous candle’s range. This failure proves that the bearish trend is still dominant.
2. Candlestick Structure of the On-Neck Pattern
To trade this pattern safely, you must recognize its exact anatomy on the price chart. If the second candle closes too high, the meaning changes entirely.
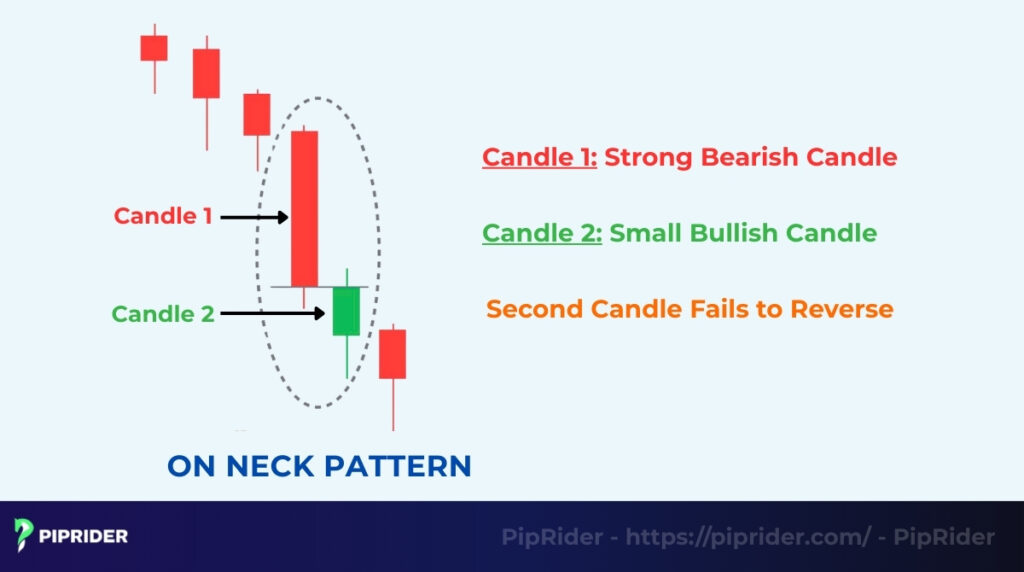
2.1. Candle 1: Strong Bearish Candle
The pattern begins with a long bearish candle (red or black) appearing within an existing downtrend. This long body represents aggressive selling pressure, confirming that bears are currently dominating the market sentiment.
2.2. Candle 2: Small Bullish Candle
The second candle opens with a gap down, creating a new low. However, a small bullish candle (green or white) forms as buyers try to step in. Crucially, this candle closes exactly at or very near the low of the first candle, not inside its body.
2.3. Key Rule: Second Candle Fails to Reverse
The most critical aspect is the failure of the second candle to push back into the previous day’s range. By closing near the previous low, it proves that the buying attempt was weak and insignificant. This inability to reverse signals that the market is simply pausing before the next leg down.
3. What Is the Market Psychology Behind the On-Neck Pattern?
Understanding why a pattern forms helps you trade it with confidence. The On-Neck candlestick pattern represents a specific psychological sequence: extreme fear, a weak attempt at a recovery, and the realization that the bearish trend is still in charge.
3.1. Weak Buying Pressure After Strong Selling
The first long bearish candle reflects panic or aggressive selling. This represents a bearish impulsive wave. The gap down on the second day confirms that this fear is still dominant at the market open. However, after this drop, some short-sellers begin to take profits, and some aggressive “bargain hunters” step in, creating mild buying pressure.
3.2. Short-Lived Bullish Attempt
Buyers attempt to take advantage of the low prices, pushing the market up slightly. This short-lived rally acts as a weak retracement wave. However, as the price approaches the previous day’s low, it hits a “ceiling” of resistance. The bulls lack the conviction to push the price back inside the previous candle’s range, showing that demand is very shallow.
3.3. Bearish Momentum Preparing for Continuation
Ultimately, the failure to rise above the previous low signals to the market that the “bounce” has failed. Sellers realize that the price movement is just a pause, not a turn. This psychological defeat encourages bears to reload their short positions, preparing the market for the next leg down.
4. How Does the On-Neck Pattern Compare to Similar Patterns?
This is the most critical section for avoiding losses. The On-Neck candlestick pattern looks nearly identical to four other patterns, but the specific closing price of the second candle changes the meaning entirely.
Here is a quick guide to distinguishing them:
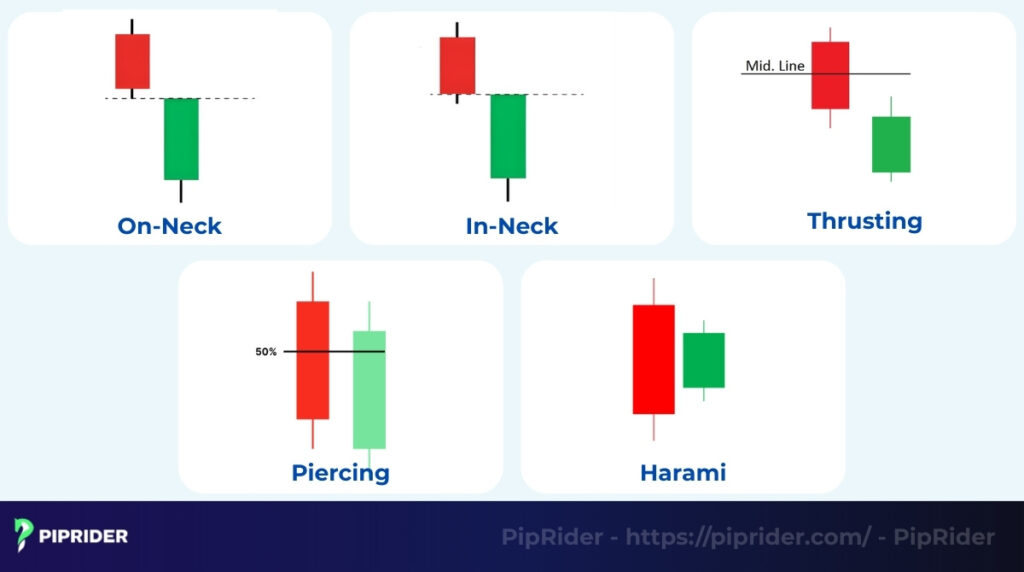
| Pattern | Candle 2 Closing Price | Signal Meaning |
| On-Neck | Matches the Low of Candle 1 | Bearish Continuation (Strongest) |
| In-Neck | Closes slightly inside the body | Bearish Continuation (Weaker) |
| Thrusting | Closes inside but below 50% | Bearish (Watch carefully) |
| Piercing | Closes above 50% of Candle 1 | Bullish Reversal (Buy) |
| Harami | Body is completely inside Candle 1 | Bullish Reversal (Wait) |
4.1. On-Neck vs. In-Neck Pattern
These two are very similar candlestick patterns, and both signal a trend continuation of the downtrend.
The in-neck candle closes slightly higher, just inside the body of the first candle. While still bearish, the in-neck suggests slightly stronger buying pressure than the on-neck, making the bearish trend signal slightly weaker.
4.2. On-Neck vs. Thrusting Pattern
The thrusting pattern is often a “trap” for buyers who think a reversal is coming.
A thrusting pattern closes deeper into the first candle’s body but fails to cross the 50% midpoint. It is still a bearish signal, but because buyers managed to push price higher than in an on-neck, the immediate sell signal is less reliable.
4.3. On-Neck vs. Piercing Pattern
This is the most dangerous confusion. A piercing candlestick pattern closes above the 50% midpoint of the first candle. Unlike the on-neck, the piercing line is a strong bullish reversal signal. If you mistake a piercing line for an on-neck, you might sell exactly when the market is about to turn up.
4.4. On-Neck vs. Bullish Harami
While both involve a small green candle following a large red one, their positions are different.
In a bullish harami, the small green candle is contained completely inside the body of the previous red candle. In an on-neck, the green candle is below the body. Harami signals a potential reversal or pause, not an immediate continuation.
5. How to Identify a Valid On-Neck Candlestick Pattern?
To filter out false signals, traders need a strict process. Identifying a valid On Neck pattern requires checking the prior trend, the specific shape of the candles, and the volume behavior. Follow this 5-step checklist to ensure the signal is reliable.
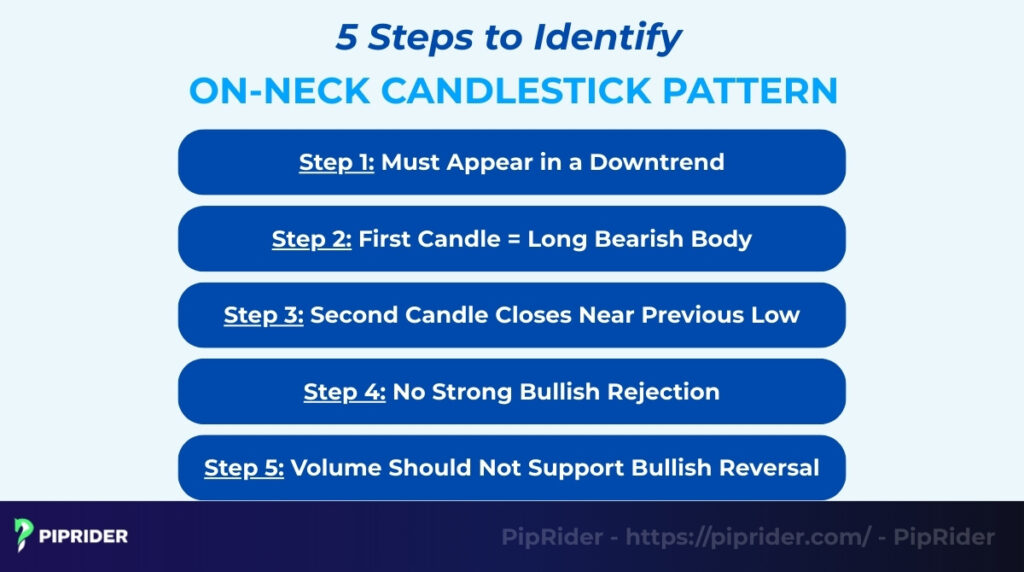
5.1. Step 1: Must Appear in a Downtrend
Context is king. Traders should only look for this pattern when the market is already making lower lows and lower highs in a strong bearish trend. If traders see this formation in a sideways or uptrending market, ignore it; it is likely just random noise.
5.2. Step 2: First Candle = Long Bearish Body
The first candle must show clear seller dominance. A long, bearish (red) body indicates that bears are firmly in control of the momentum. If the first candle is small or weak, the pattern loses its significance.
5.3. Step 3: Second Candle Closes Near Previous Low
Check the closing price carefully. The second (green) candle should close exactly at or slightly below the low of the first candle. If the close pushes up into the body of the first candle, it becomes an in-neck or thrusting pattern, which are less reliable signals.
5.4. Step 4: No Strong Bullish Rejection
Ideally, the second candle should not have a massive lower wick (shadow). A long lower wick suggests that buyers successfully pushed the price up from the lows (like a hammer pattern), which contradicts the bearish continuation thesis. Traders want a weak candle with little buying conviction.
5.5. Step 5: Volume Should Not Support Bullish Reversal
Volume on the second (green) candle should be low. High trading volume on a green candle suggests strong buying interest (“Smart Money” stepping in), which might lead to a reversal. Traders want to see weak volume on the bounce, indicating that the bulls are not serious.
6. How to Trade the On-Neck Pattern
Once you identify the pattern, you need a plan to execute the trade. Traders typically use three specific strategies depending on their risk appetite to capture the trend continuation.
Here is a quick guide to help you choose:
| Strategy | Risk Level | Entry Type | Best For |
| 1. Break of Low | Medium | Momentum | Day Traders |
| 2. The Retest | Low | Precision | Swing Traders |
| 3. EMA Trend | Low | Confirmation | Conservative Traders |
6.1. Strategy 1: Sell on Break of Candle 2 Low
Trading the breakdown is the standard approach for momentum traders who want confirmation that the downtrend has resumed. You can include this setup in your trading strategy for quick moves.
Place a sell stop order just below the low of the second (green) candle. By waiting for the price to break this low, you confirm that buyers have officially given up. If the price breaks this low, it triggers stop-loss orders of early buyers, fueling the drop.
6.2. Strategy 2: Sell on Retest of Candle 2 Close
Conservative traders often wait for a small retracement wave to get a better entry price.
Instead of selling immediately, wait for the next candle to open and rally slightly. Enter a sell order if the price touches the closing price of the second candle and gets rejected. This technique tightens your risk and offers better entry points, but you might miss the trade if the price drops immediately without a bounce.
6.3. Strategy 3: Combine With EMA20/EMA50 Trend
Smart money rarely trades against the average. Using Moving Averages adds a necessary layer of safety.
Only take the On-Neck sell signal if the price is trading below the 20 or 50-period EMA (Exponential Moving Average). The EMA acts as dynamic resistance.
- If the pattern forms far below the EMA, the bearish trend is strong.
- If it forms above the EMA, the trend might be changing, and the signal should be ignored.
6.4. Stop Loss Placement
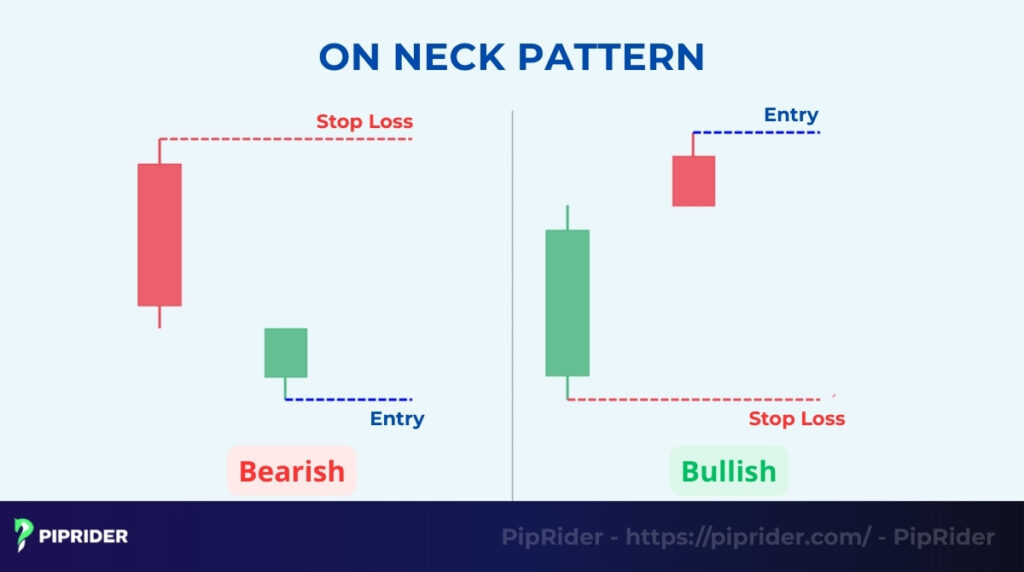
Effective risk management is vital to survive false signals.
- Tight stop: Place your Stop Loss just above the high of the second candle. If buyers push the price above this level, the specific pattern has failed.
- Safer stop: For a wider buffer, place it above the high of the first (long bearish) candle. This protects you against normal market fluctuations and volatility.
6.5. Take Profit Targets
Establishing clear exit goals is essential to lock in profits before the market finds a new floor. Traders typically determine these targets using structure or volatility.
- Market structure: Look left on the chart and target the next major historical support zone.
- Measured move: Calculate the height (in pips or points) of the first bearish candle. Project that distance downward from your entry point to find a mathematical target.
- ATR: Use a multiple of the Average True Range (ATR) (e.g., 2x or 3x ATR) to set a dynamic target based on current market volatility.
7. Which Indicators Confirm the On Neck Pattern? (Confluence)
Professional traders rarely use trading patterns alone. Using “confluence” means finding multiple technical indicators that tell the same story, which significantly increases your win rate.
Here is a quick confirmation cheat sheet:
| Indicator | What to Look For | Why It Matters |
| Volume | Decreasing on Candle 2 | Shows weak buying interest. |
| RSI | Below 50 | Confirms bearish momentum dominates. |
| MACD | Bearish (Lines fanning down) | Confirms the trend is accelerating. |
| Trendline | Rejection at Resistance | Adds structural confluence. |
7.1. Volume Decreasing on Candle 2
Volume analysis is your first validity check. You want to see significantly lower volume on the second (green) candle compared to the first (red) candle. This divergence confirms that the “buying” attempt is weak, unenthusiastic, and lacks the institutional support needed to reverse the trend.
7.2. RSI Below 50 (Trend Weakness)
Check the RSI indicator (Relative Strength Index) to ensure the broader bearish trend supports your trade. If the RSI is below 50 (bearish territory) but not yet oversold (below 30), it indicates that bears are firmly in control and there is still plenty of room for the price to drop further before hitting a floor.
7.3. MACD Bearish Momentum
The MACD verifies that momentum is aligned with price. Look for the MACD histogram to remain negative or for the signal lines to be spreading apart downward. If the MACD lines are crossing up while the On-Neck forms, be careful, the trend might be reversing, making the signal invalid.
7.4. Trendline or Channel Confirmation
Geometry provides excellent confluence. If the On-Neck pattern forms right at the resistance line of a descending channel or a long-term trendline, the signal is much stronger. In this case, the pattern acts as the specific “trigger” to sell off that major resistance level. These resistance levels act as a ceiling for price.
8. What Do Real On-Neck Examples Look Like on Charts?
Seeing the pattern in real markets helps solidify the concept. Here are three concise examples showing how the On-Neck pattern appears across Forex, Stocks, and Crypto.
8.1. On-Neck Pattern in Forex (EUR/USD)
On a 4-hour chart, the EUR/USD drops sharply. The next candle gaps down and attempts to rally but hits a “ceiling” exactly at the previous candle’s low.
Recognizing this failed rally, a trader places a sell stop order just below the new low. As the next candle breaks downward, the order triggers, capturing the trend continuation.
8.2. On-Neck Pattern in Stocks (AAPL)
During a correction, Apple stock gaps down at the open. Buyers try to push the price up, but they fail to push it back into yesterday’s trading range. The candle closes near its low.
This signals that investors are using the tiny rally to “sell into strength.” A trader enters a short position as soon as the price breaks below the current day’s low.
8.3. On-Neck Pattern in Crypto (BTC)
After a massive crash, Bitcoin forms a tiny green candle. It tries to bounce but faces immediate selling pressure, closing well below the body of the previous red candle.
This total inability to bounce is a classic trend continuation sign. Traders view this as a pause in the “crypto winter” and add to short positions, targeting the next support level.
9. What Are Common Mistakes When Trading the On-Neck Pattern?
Even experienced traders make errors with this pattern. Avoiding these traps will save your capital and prevent you from entering bad trades.
- Confusing with piercing pattern: This is the most expensive mistake. Traders often see a green candle after a drop and assume it’s a reversal (Piercing Pattern). Always check the closing price relative to the 50% level of the first candle to avoid buying a bearish continuation.
- Buying the “green” candle: Impatient traders see a green candle and assume the trend is changing. Remember, a small green candle in a downtrend is usually just a pause, not a turn. Buying here puts you directly against the main bearish trend.
- Trading in a sideways market: If the market is ranging (going sideways), the On-Neck pattern is unreliable. It needs a clear, existing downtrend to work effectively.
- Ignoring the overall trend: Never short a stock just because of one pattern if the weekly or monthly trend is bullish. Always trade in alignment with the higher timeframe to ensure you are not fighting the larger market flow.
10. Which Tools Can Automatically Detect the On-Neck Pattern?
Finding these small patterns manually across hundreds of charts is difficult and prone to error. Modern trading platforms offer automated tools to detect them for you instantly.
- TradingView (Built-in Scanner): You can use the built-in indicator called “All Candlestick Patterns”. Simply add it to your chart and check the settings to enable detection for the On-Neck pattern specifically.
- MT4/MT5 (Custom Indicators): MetaTrader does not detect this by default, but you can download custom tools from the MQL5 Market. Look for indicators named “Candlestick Pattern Scanner” or “CPI”, which can scan multiple pairs and alert you when an On-Neck pattern forms.
- TrendSpider (Automated Recognition): This platform specializes in automation. Its “Market Scanner” feature allows you to search thousands of stocks in seconds to find any ticker currently displaying an On-Neck formation, saving you hours of manual analysis.
11. Frequently asked questions about On-Neck Pattern
12. Conclusion
The On Neck Pattern is a specific but powerful bearish continuation signal. While it looks like a small recovery, it actually reveals that buyers are too weak to reverse the trend.
For the highest win rate, never trade it in isolation. Combine it with trend lines, support levels, volume analysis, and momentum indicators. Most importantly, ensure you distinguish this candlestick pattern from the bullish Piercing Pattern to avoid costly mistakes.
Ready to master candlestick patterns? Explore the comprehensive trading strategies and guides at Piprider today.