

The triple bottom pattern is a powerful reversal formation that traders use to spot high-probability buying opportunities. This classic chart pattern is particularly useful for confirming that a prolonged downtrend may be over, signaling a potential shift to a new uptrend.
In this guide, Piprider will break down exactly what a triple bottom chart pattern is, provide a step-by-step process for identifying it, and outline clear trading strategies for entry, stop-loss placement, and calculating its price target. We will also explore its bearish counterpart and the common mistakes traders make, giving you a complete playbook for this powerful setup.
Key Takeaways
- The triple bottom pattern is a bullish reversal chart pattern that signals the potential end of a decline.
- It is characterized by three roughly equal lows, forming a strong support level.
- The pattern is confirmed when the price breaks out above the resistance line (neckline), ideally on increased volume.
- A price target can be estimated by measuring the height of the pattern and adding it to the breakout level.
- Its bearish counterpart is the Triple Top pattern.
1. What Is a Triple Bottom Pattern?
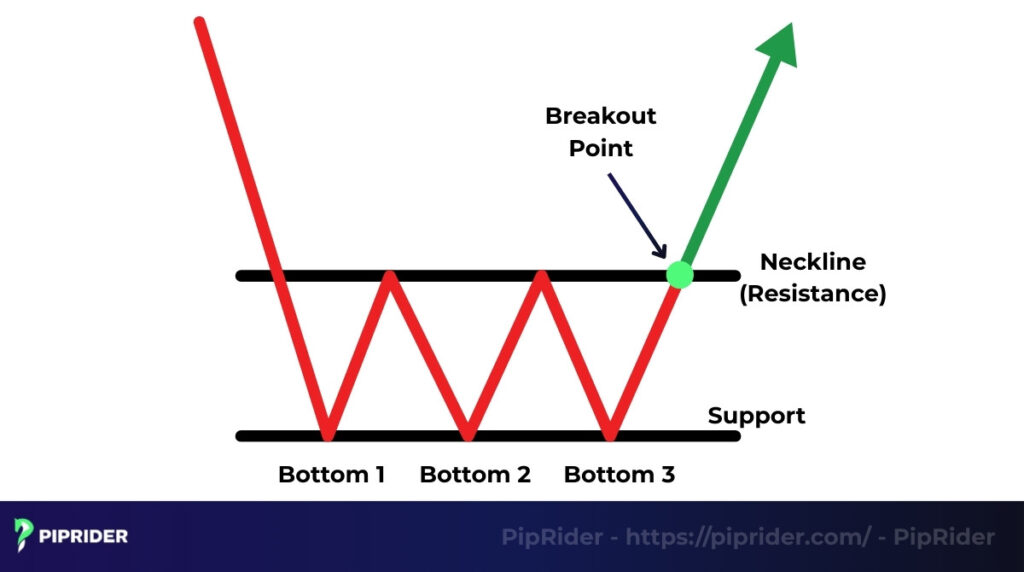
The triple bottom pattern is a bullish reversal chart pattern that appears at the end of a downtrend, signaling a potential shift in momentum from sellers to buyers. It is visually defined by three consecutive and roughly equal lows that form a powerful support level.
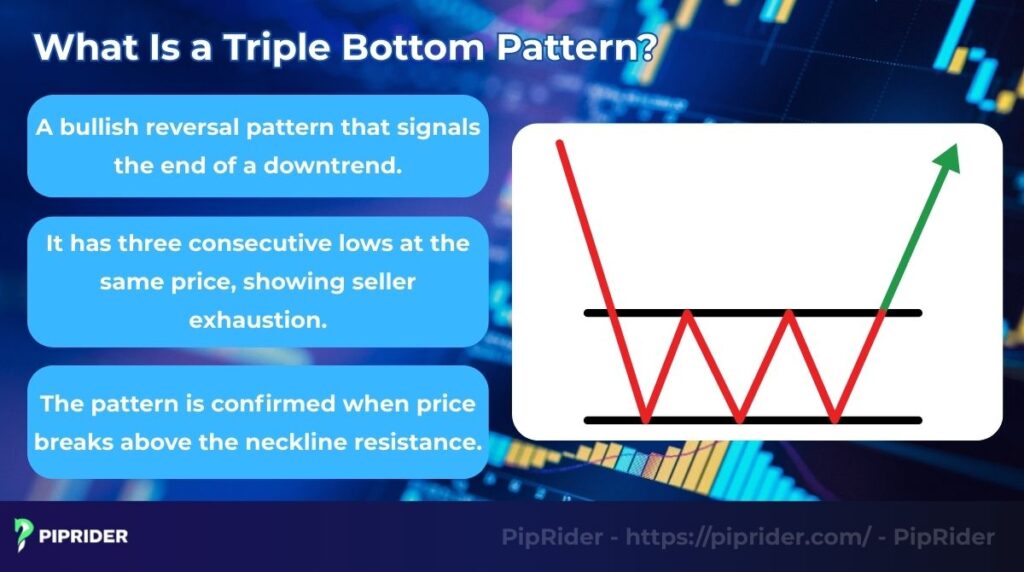
In triple bottom technical analysis, the pattern’s significance comes from this triple rejection of lower prices, which indicates that selling pressure is exhausted. The pattern is only confirmed when the price movement breaks and closes above the resistance line (the “neckline”) connecting the two peaks between the lows. This breakout signals that the downtrend has likely ended.
To help you visually distinguish the Triple Bottom chart pattern from other common reversal patterns, the table below breaks down their key differences.
| Feature | Triple Bottom | Triple Top | Double Bottom | Inverse Head & Shoulders |
|---|---|---|---|---|
| Signal | Bullish Reversal | Bearish Reversal | Bullish Reversal | Bullish Reversal |
| Structure | Three roughly equal lows | Three roughly equal highs | Two roughly equal lows | Three lows, middle low is the lowest |
| Psychology | Sellers fail 3 times | Buyers fail 3 times | Sellers fail 2 times | Sellers fail after a final push |
| Confirmation | Breakout above resistance (neckline) | Breakout below support (neckline) | Breakout above resistance (neckline) | Breakout above resistance (neckline) |
2. The Lifecycle & Psychology of a Triple Bottom
The triple bottom pattern unfolds in a logical sequence that tells a clear visual story of seller exhaustion and a shift in market control.
- Phase 1: The Initial Control. The pattern begins during an established downtrend. Sellers push the price down to a certain floor, but buyers step in, causing a bounce. At this point, sellers are still confidently in control.
- Phase 2: The Battle (Testing Support). Sellers attempt to push the price lower two more times. However, buyers aggressively defend this exact same price zone. Doubt begins to enter the sellers’ minds as their momentum hits a brick wall.
- Phase 3: Capitulation & Breakout. After the third failed attempt to break support, sellers finally capitulate (give up). Buyers take firm control and push the price aggressively upward. The definitive psychological shift is confirmed when the price decisively breaks above the resistance “neckline” connecting the peaks, triggering a wave of new buying interest.
3. The “Validity Checklist”: Identifying a High-Probability Triple Bottom
A true triple bottom is more than just three random dips on a chart. To filter out market noise and identify a high-probability tradeable pattern, professional traders use a strict validation checklist. Ensure your setup meets all five of these criteria before risking capital:
- Prior Downtrend: The pattern must form after a clear, established downtrend. A triple bottom is strictly a reversal pattern; if three lows form in the middle of a random, sideways consolidation range, the signal is structurally invalid.
- Three Reasonably Equal & Well-Spaced Lows: The three bottoms do not need to align at the exact same pip or cent, but they must be roughly equal. Crucially, they must be well-spaced, meaning they are distinct pivot points separated by clear upward rallies, not just a messy, tight cluster of candles.
- A Defined Neckline (Resistance Zone): The neckline is drawn by connecting the highs of the two intermediate peaks between the three bottoms. This line does not have to be perfectly horizontal; professional traders often treat it as a resistance zone rather than a thin, rigid line.
- The Breakout Confirmation: The pattern is only confirmed and tradeable once the price decisively closes above the neckline. Attempting to enter a long position before this breakout happens is a dangerous game of anticipation.
- Volume Behavior (Where Applicable): In markets with centralized volume (like stocks or crypto), overall volume should ideally decline or flatten out as the pattern forms, indicating seller exhaustion. A massive surge in volume on the breakout above the neckline is the ultimate confirmation of institutional buying.
4. Benefits and Limitations of Using the Triple Bottom Pattern
While the triple bottom pattern is a powerful tool, it’s crucial for traders to understand both its advantages and its inherent drawbacks. A balanced perspective allows for more informed trading decisions.
4.1. Benefits
The triple bottom chart pattern offers several compelling advantages for traders:
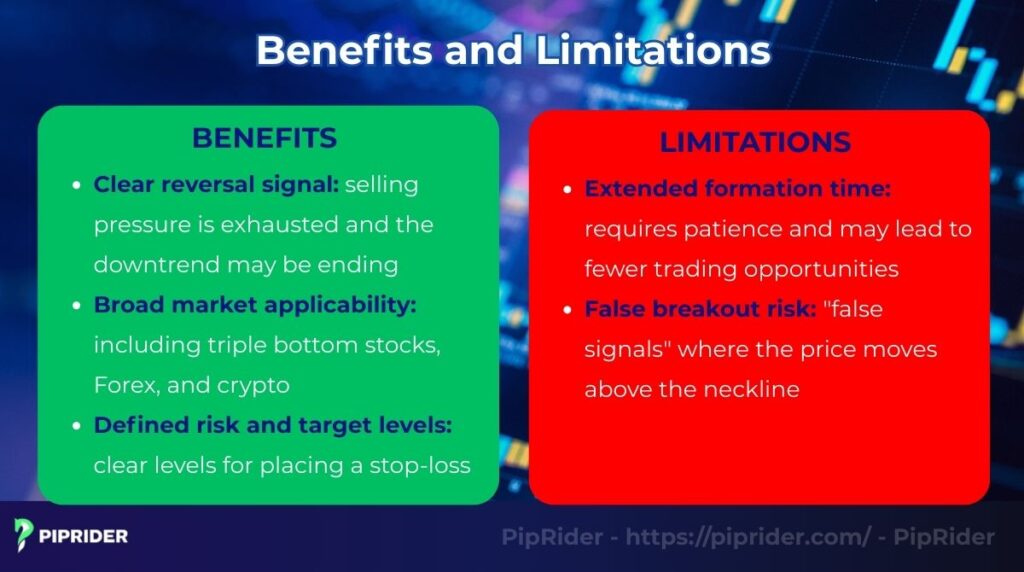
- Clear reversal signal: Its structure of three equal lows provides an unambiguous signal that selling pressure is exhausted and the downtrend may be ending. This is a clear market reversal indicator.
- Broad market applicability: The underlying psychology is universal, making the pattern effective in various markets, including triple bottom stocks, Forex trading, and crypto.
- Defined risk and target levels: The pattern provides clear levels for placing a stop-loss (below the lows) and calculating a price target (based on the pattern’s height). This enhances risk management.
4.2. Limitations
Despite its benefits, the triple bottom pattern is not without its challenges:
- Extended formation time: The pattern can take a significant amount of time to fully develop, which requires patience and may lead to fewer trading opportunities.
- False breakout risk: Like any breakout pattern, it is susceptible to “false signals” where the price moves above the neckline only to quickly reverse lower, indicating potential price volatility.
5. How to Trade the Triple Bottom Pattern
Trading the triple bottom chart pattern involves a clear, systematic approach. Here’s a breakdown of the key steps for executing a trade based on this setup.
5.1. Entry Strategies (Aggressive vs. Conservative)
The standard trigger for a triple bottom trade is a price break above the resistance neckline. However, depending on your risk tolerance, you can choose between two distinct entry styles:
Entry Option A: The Breakout (Aggressive)
- How it works: You place a market buy order the exact moment a candlestick decisively closes above the neckline on a high timeframe (e.g., 4-hour or Daily).
- The Filter: To increase conviction and avoid traps, confirm this momentum using technical indicators. Look for the RSI crossing above the 50 level, or a bullish crossover on the MACD, occurring simultaneously with the breakout.
- Pros & Cons: This ensures you don’t miss the trade if the price explodes upward. However, it exposes you to a higher risk of a false breakout.
Entry Option B: The Breakout & Retest (Conservative)
- How it works: You wait for the initial breakout to happen, but you do not enter immediately. Instead, you wait for the price to pull back and retest the broken neckline from above. You only enter when this former resistance turns into new support and prints a bullish rejection candle (like a pin bar or an engulfing pattern).
- The Filter: This approach acts as its own structural filter. It directly mitigates the “false breakout risk” mentioned earlier in this guide.
- Pros & Cons: This provides a much safer entry and allows for a tighter stop-loss, vastly improving your Risk/Reward ratio. The downside is the FOMO factor: if the market is extremely bullish, the price may never pull back, causing you to miss the trade entirely.
5.2. Strategic Stop-Loss Placement
Placing a stop-loss correctly is the foundation of risk management. Your stop-loss location must logically align with your chosen entry strategy to define a clear point of invalidation:
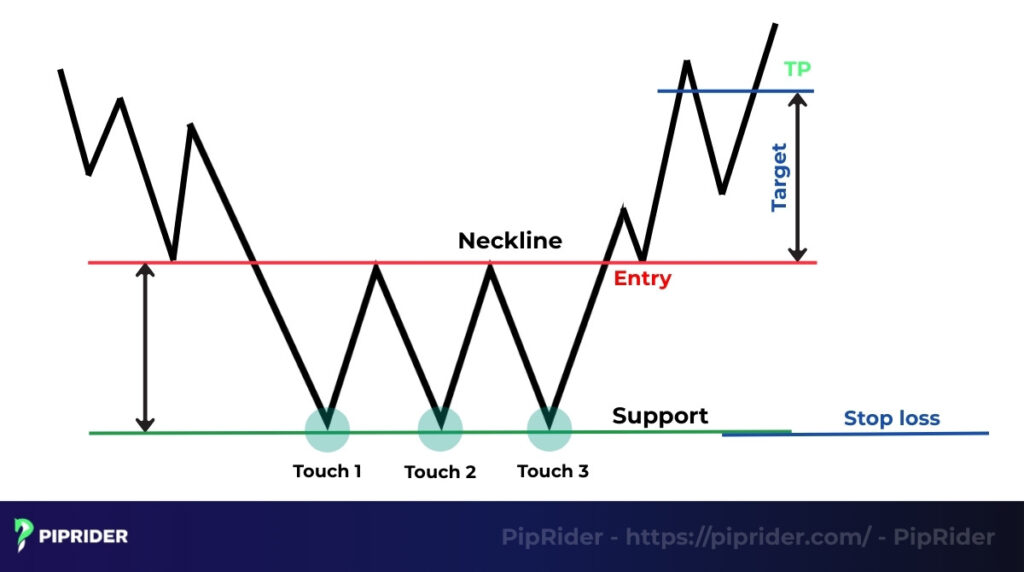
- The Safe Stop (Standard Breakout Entry): The most secure placement is just below the lowest of the three bottoms. This acts as the ultimate structural invalidation point, if the price breaks below this zone, the bullish reversal has completely failed. Always add a small buffer using the ATR indicator to avoid being stopped out by artificial liquidity hunts.
- The Tight Stop (Retest Entry Only): If you utilized the conservative “Breakout & Retest” entry, you do not need to place your stop-loss all the way down at the pattern’s absolute bottom. Instead, place it just below the specific “retest low” or slightly below the neckline (which now acts as new support). This significantly reduces your risk exposure and dramatically improves your Risk/Reward (R:R) ratio.
5.3. Take-Profit Targets & Exit Strategy
Calculating a target provides a clear exit plan, but professional traders rarely exit their entire position at one single price point. Instead, they use a dynamic scale-out approach:
- The Measured Move (Full Target): To find the standard pattern target, measure the vertical distance from the lowest of the three bottoms to the neckline (resistance line). Project this exact distance upwards from the breakout point. This is your theoretical 100% target.
- Take-Profit 1 (Partial Scale-Out): Secure partial profits (e.g., 50% of your position) when the price reaches the nearest major resistance level on the chart, or when it hits 70–80% of the full measured move. This guarantees a winning trade even if the market suddenly reverses.
- Take-Profit 2 (Trail to Maximize): Let the remaining portion of your trade run toward the full 100% measured move. If the market shows strong bullish momentum, abandon the fixed target and trail your stop-loss behind newly formed swing lows (higher lows) to capture a potentially massive new uptrend.
6. Triple Bottom vs. Triple Top Pattern
The triple bottom pattern has a mirror opposite that traders must also know: the triple top. While they are both reversal patterns, they signal completely different outcomes.
- Triple Bottom: This is a bullish reversal pattern. It forms at the end of a downtrend and signals that the price is likely to move higher.
- Triple Top: This is a bearish reversal pattern. It forms at the end of an uptrend and signals that the price is likely to move lower, leading to a bearish trend.
When to use each strategy:
Your strategy depends entirely on the preceding trend.
- A Triple Bottom strategy is used to look for buying opportunities after a prolonged bearish move has shown signs of seller exhaustion.
- A Triple Top strategy is used to look for selling opportunities after a prolonged uptrend has shown signs of buyer exhaustion. The rules are simply reversed: the entry for a triple top breakout is a sell order placed after the price breaks below the support line.
7. Real-World Example of a Triple Bottom Pattern
Theory is important, but seeing the pattern on a real chart is the best way to understand its power. Let’s analyze a specific example in the Forex market applying our exact playbook rules.
Case Study: A Bullish Reversal on USD/JPY
- The Setup: Following a clear decline, the USD/JPY currency pair found a strong support zone around the 138.00 level. On the 4-hour chart, the price tested this area three times over several weeks, forming three distinct bottoms at a similar price. The neckline (resistance) was formed by the two intermediate peaks at approximately 141.00.
Pro Tip for Forex Traders (The Volume Caveat): Unlike stocks or crypto, spot Forex is decentralized and does not have true traded volume. Therefore, volume confirmation is strictly optional. You can use a volume proxy (tick volume) or cross-reference Japanese Yen futures, but a strong, decisive bullish price action close above the neckline is often sufficient confirmation.
| Execution Parameter | Price Level | Rationale |
|---|---|---|
| Entry (Buy) | 141.00 | Decisive breakout above neckline. (Optional: confirmed via tick volume proxy). |
| Stop Loss (SL) | 137.50 | Just below the lowest bottom (invalidation point) + a 50-pip ATR buffer. |
| Take Profit 1 (TP1) | 143.00 | Partial scale-out at ~70% of the measured move to secure profits. |
| Take Profit 2 (TP2) | 144.00 | Full pattern height (300 pips) projected upwards from the neckline. |
| Outcome | Successful Gain | Broke neckline, hit TP1 to secure risk, and eventually reached full TP2. |
8. Common Mistakes & Failure Cases
Even a high-probability pattern like the triple bottom can lead to losses if traded without discipline. To protect your capital, avoid these 6 classic pitfalls:
- Trading Without a Prior Downtrend: A triple bottom is strictly a reversal pattern. Three consecutive lows forming in a choppy, sideways market are just a random trading range, not a valid setup.
- Accepting Uneven Bottoms: The lows must be roughly equal. A significantly lower middle low forms an Inverse Head & Shoulders, while messy, uneven chop is often just a rectangle consolidation.
- Anticipating the Breakout: Entering a long position before the candle decisively closes above the neckline. Jumping the gun early often leaves you trapped directly below strong resistance.
- Ignoring a Failed Retest: If the price breaks the neckline but immediately collapses back below it, the breakout has failed. Blindly holding a position when the new support breaks turns a quick invalidation into a massive loss.
- Placing Stop-Losses Too Tight: Setting a hard stop at the exact pip of the lowest bottom invites “whipsaw” losses from market noise and broker spreads. Always add an ATR buffer.
- Miscalculating the Target: Projecting the measured move incorrectly. You must measure the distance from the lowest bottom to the neckline, and project that distance upward from the breakout point, not from the absolute bottom.
9. FAQs about the Triple Bottom Pattern
10. Conclusion
In conclusion, the triple bottom pattern is a powerful bullish reversal signal that provides traders with a clear framework for identifying entries, setting a stop-loss, and calculating profit targets.
While the triple bottom is a significant pattern on its own, its reliability increases substantially when combined with other confirming indicators like volume. For traders who master its identification, it is an invaluable tool for spotting the end of a downtrend.
To continue building your technical analysis skills and discover more high-probability trading patterns, we encourage you to explore our comprehensive guides in the Analysis category on Piprider.


