

The Triple Top is a classic major bearish reversal pattern in technical analysis (StockCharts, n.d.). While highly recognizable, its real-world reliability depends heavily on strict confirmation—specifically a decisive neckline close, broader market context, and volume validation.
This comprehensive guide will provide a detailed examination of the Triple Top pattern, covering its structure and the disciplined trading strategies required to avoid costly false breakouts across various financial markets.
Key Takeaways
- The triple top pattern consists of three peaks at a similar price point, signaling a weakening uptrend.
- Confirmation occurs when the price breaks below the neckline (support) with a strong increase in volume.
- It is considered a definitive reversal pattern for a downward move.
- The pattern can be combined with indicators like RSI, Moving Averages, and Fibonacci retracement to increase the probability of a successful trade.
- Avoid entering a trade prematurely before the pattern is fully confirmed by a breakout.
1. What Is the Triple Top?
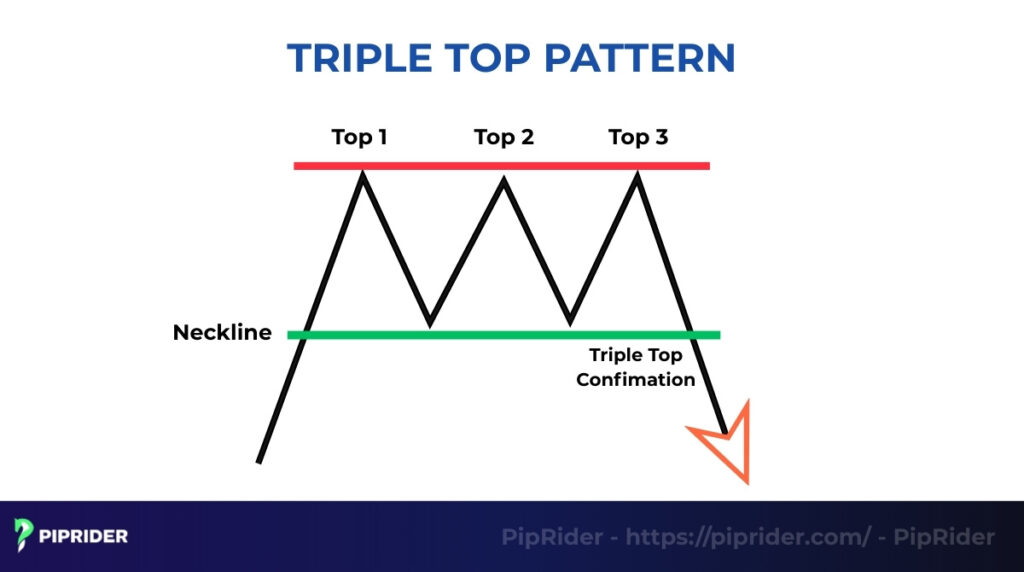
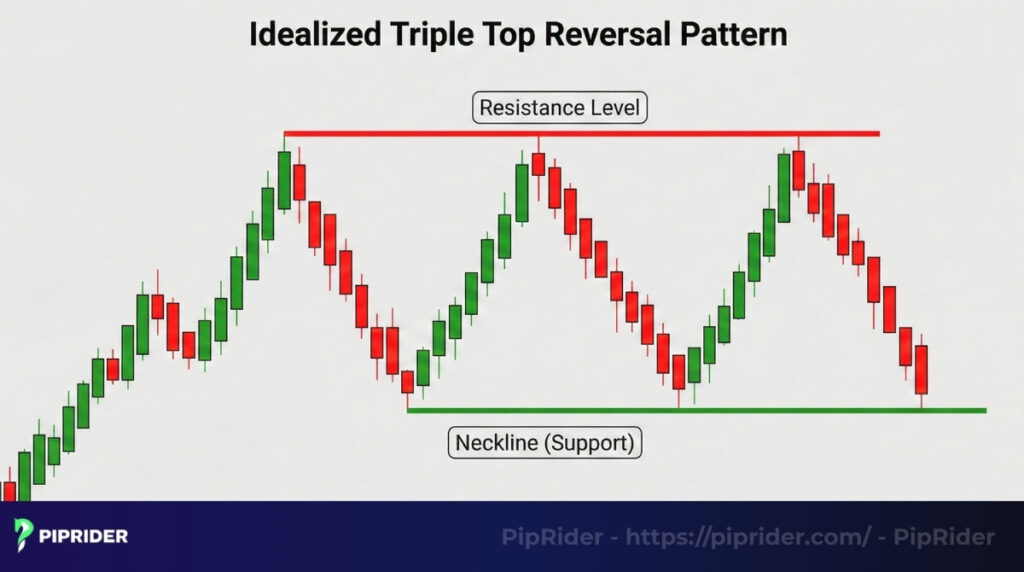
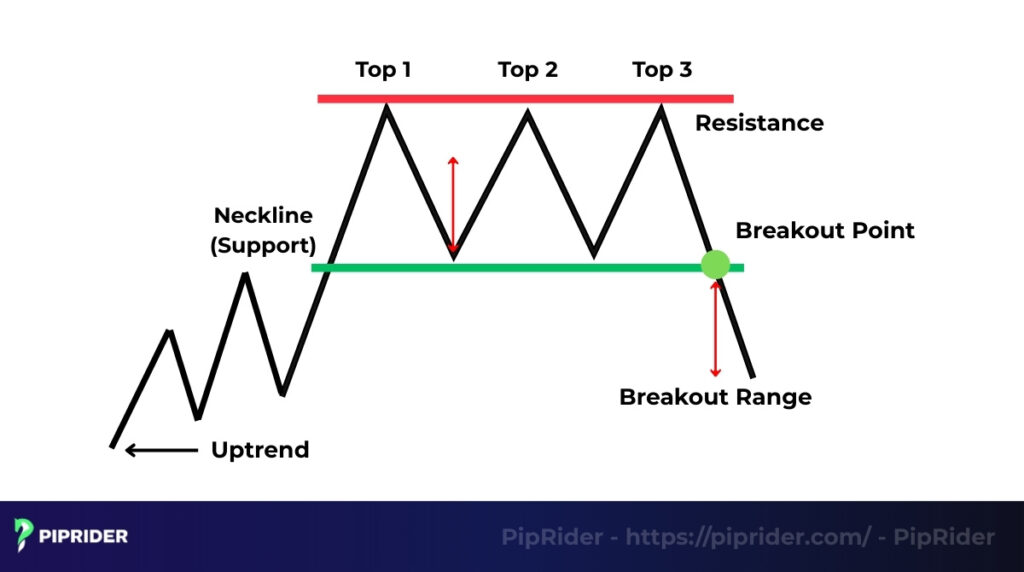
A triple top is a bearish reversal chart pattern used in technical analysis to signal the end of an uptrend and the beginning of a downtrend (Investopedia, 2024). It consists of three successive peaks of roughly equal height, with two intervening troughs. The pattern signals that the buying pressure, which has driven the price up, is losing momentum and sellers are starting to take control.
This pattern is particularly important because it gives traders an early warning to take profits or prepare for a short position, whether they’re trading forex, stocks, or crypto.
2. Structure and Characteristics
To properly identify a triple top pattern on a chart, traders need to understand its core components.
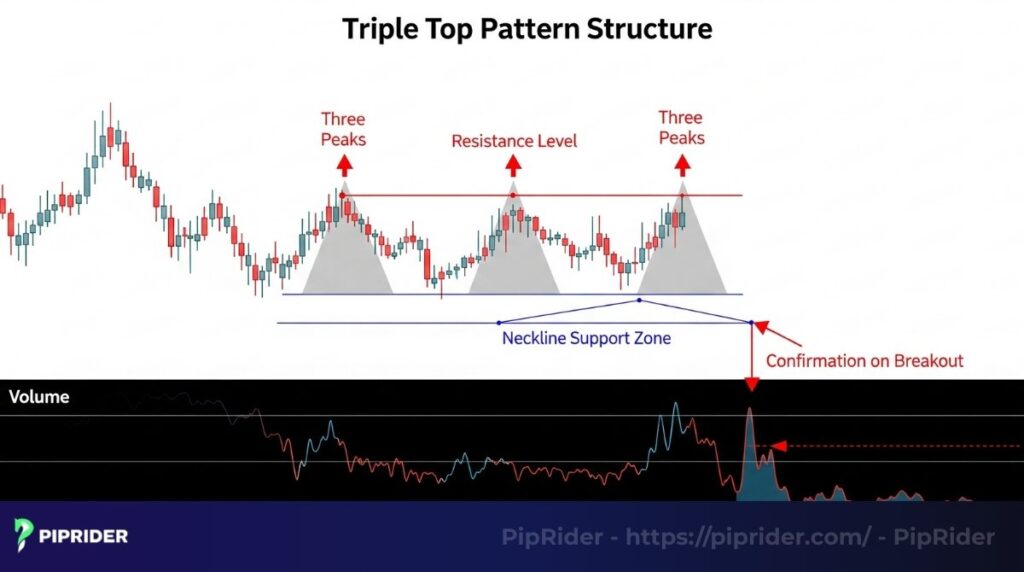
2.1. Three Peaks at Similar Levels
A defining feature of this pattern is three distinct high points that reach approximately the same resistance price level. When the price tries to break through this resistance a third time and fails, it indicates that the asset’s supply is outweighing demand at that specific point. This repeated failure is a strong early signal of weakness in the uptrend.
2.2. Resistance Level of the Triple Top
The horizontal line connecting the three tops forms a major resistance level. This resistance level acts as a “ceiling” for the price, and each failed attempt to break above this resistance reinforces the pattern’s validity.
A stock or currency pair repeatedly hitting the same resistance zone tells traders that a significant amount of supply is entering the market at that price. This repeated rejection at resistance is a powerful psychological signal that buyers are losing their power and the upward momentum is running out of steam.
2.3. Neckline Support Zone
The two troughs between the three highs are connected by a support line, also known as the “neckline.” This line is a critical component of the pattern. It represents a key support level where buyers have previously stepped in to halt the price decline (Investopedia, n.d.).
A decisive break below this neckline is what provides the final validation of the pattern. Until the price breaks this support, the pattern is still in its formation stage and a potential trend reversal has not yet been confirmed.
2.4. Volume Decrease During Formation
As the pattern develops, the trading volume often tends to decrease, especially on the second and third peaks. This decrease in volume shows that the market is losing interest and momentum in the uptrend.
Think of it as a car running out of gas. The price tries to push higher, but the lack of trade turnover indicates that fewer and fewer buyers are willing to participate at these elevated levels. This is a strong sign that buyers are exhausted, and the slightest push from sellers could cause a sharp reversal.
2.5. Confirmation on Breakout Below Support
The triple top pattern is only truly confirmed when the price breaks definitively below the neckline. This is the “trigger” event that signals the uptrend has likely ended and a bearish reversal is in play.
A convincing breakout is often accompanied by a significant surge in trading volume. This spike in volume serves as powerful evidence that sellers are taking full control, as they actively push the price lower and often trigger a cascade of stop-loss orders from previous long positions. This is the moment a trader can be confident in taking action and considering a short position.
3. How Does Triple Top Work?
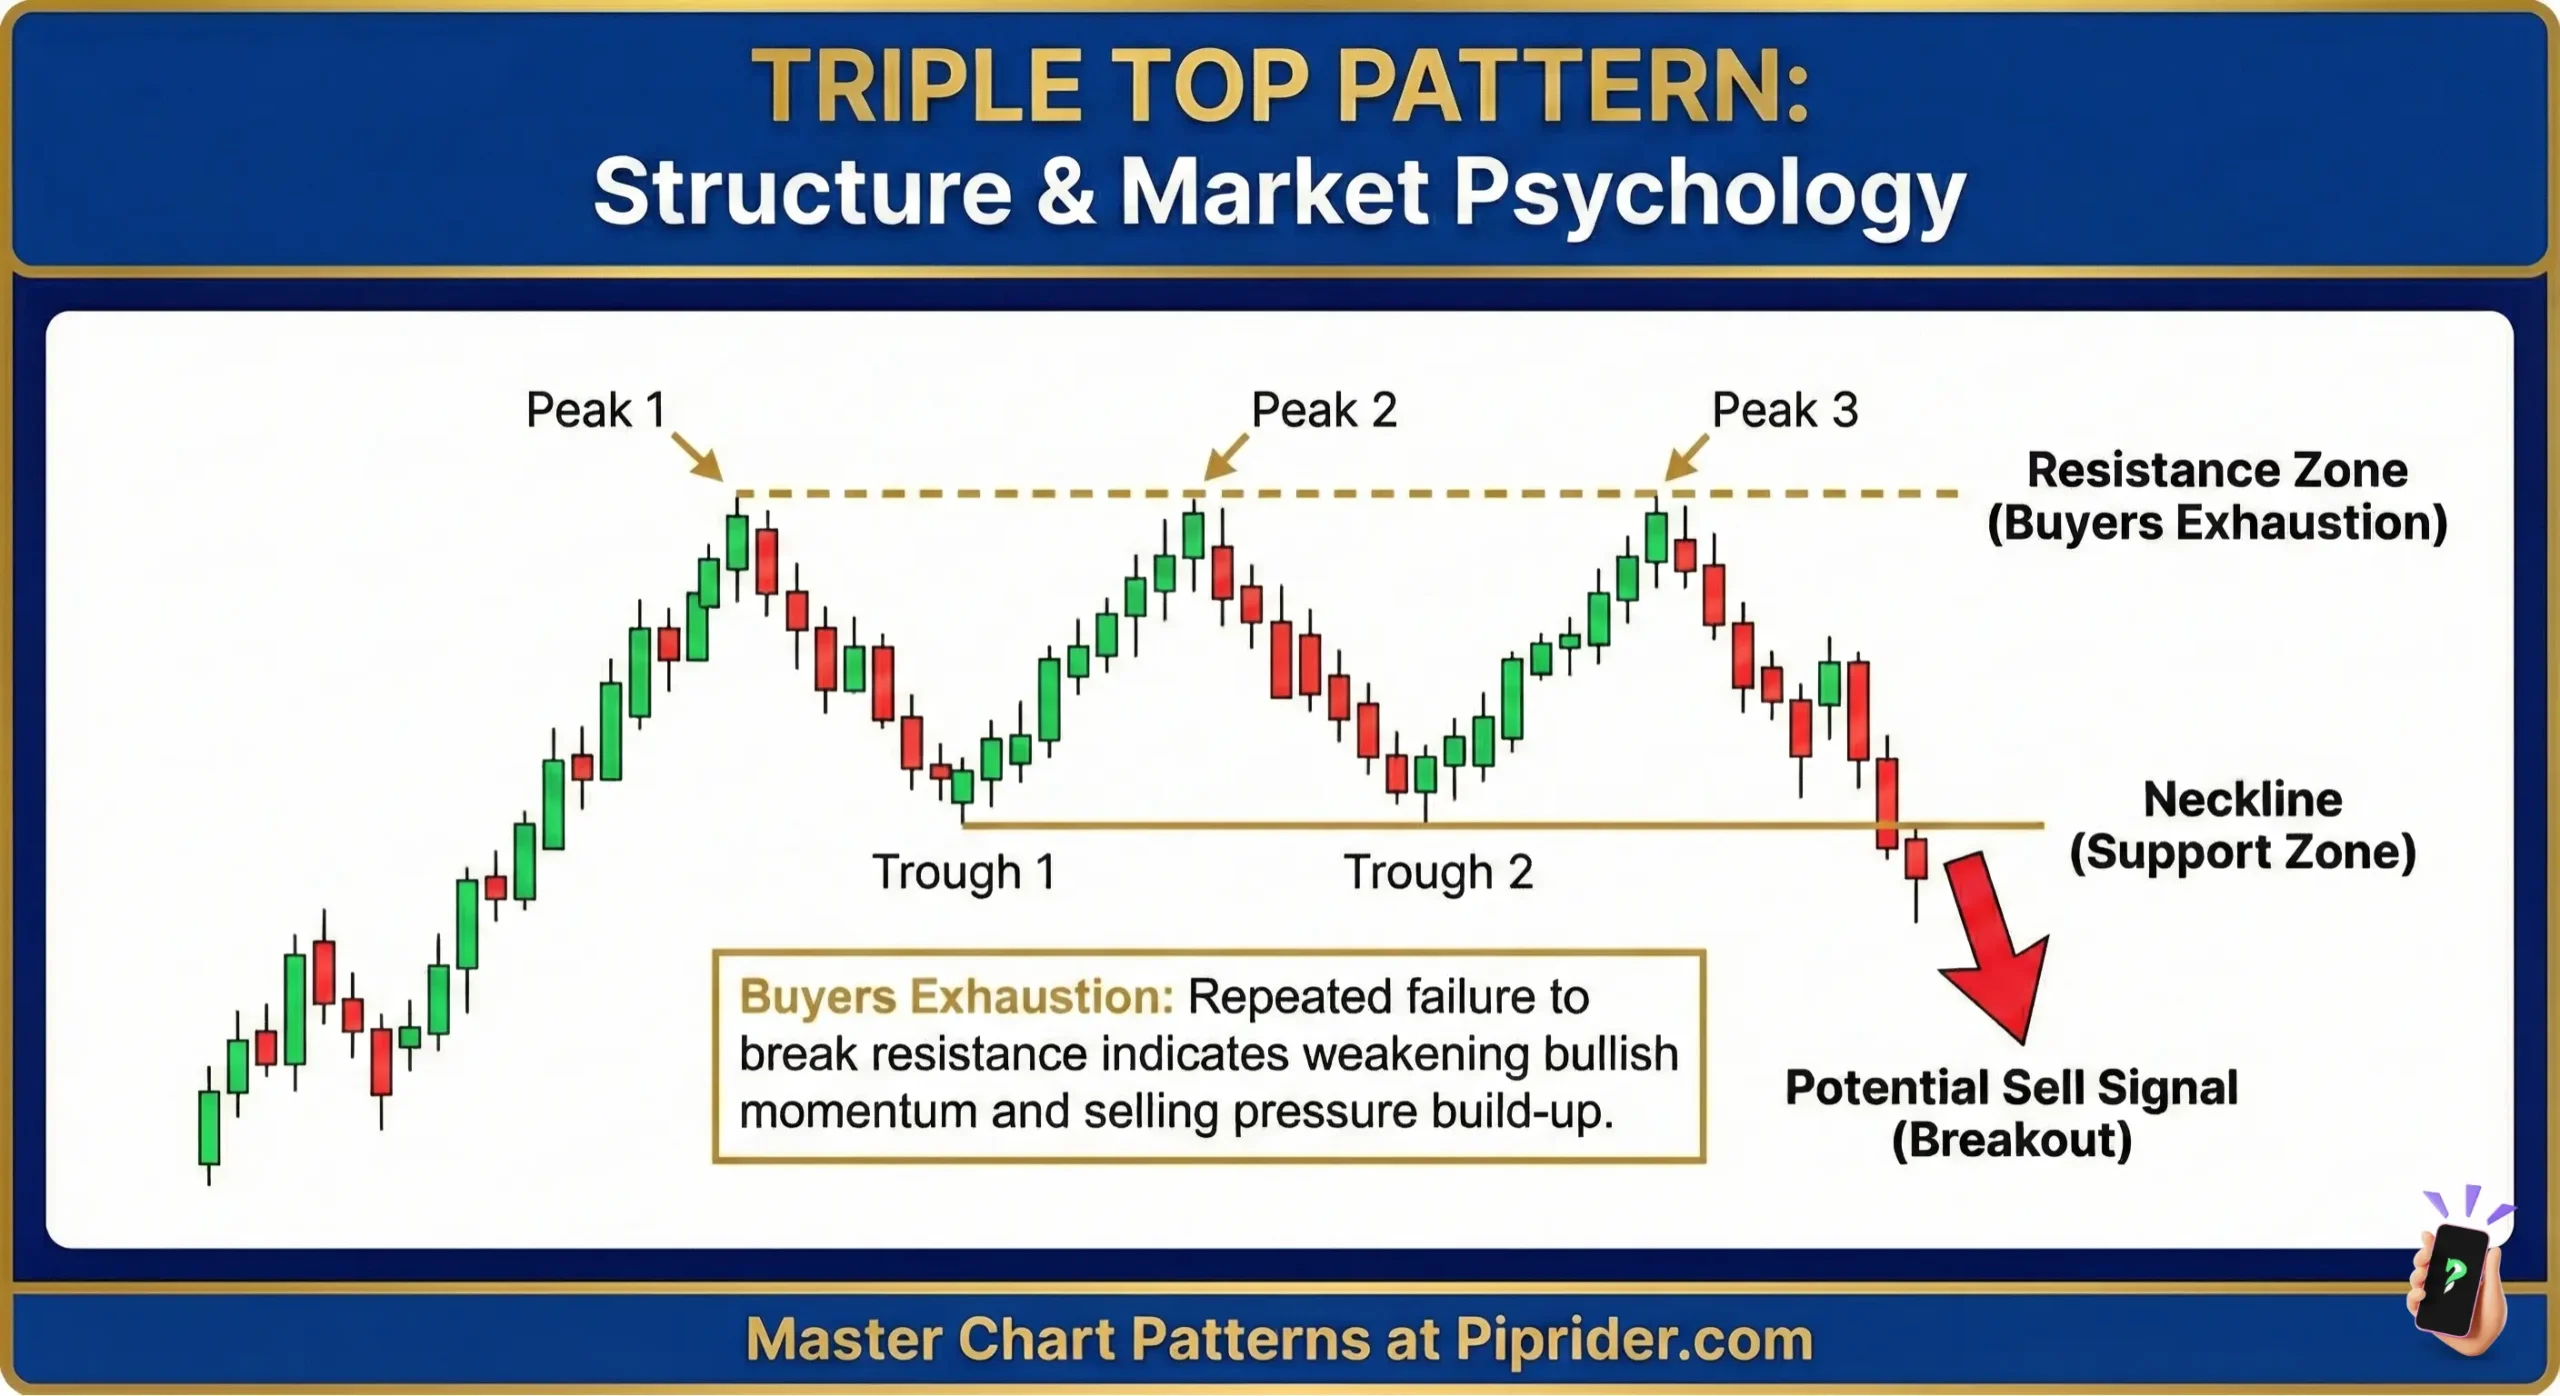
The Triple Top pattern is more than just a shape on a chart; it tells a story about market psychology and the shift in power between buyers and sellers.
3.1. The Psychological Play Across Three High Points
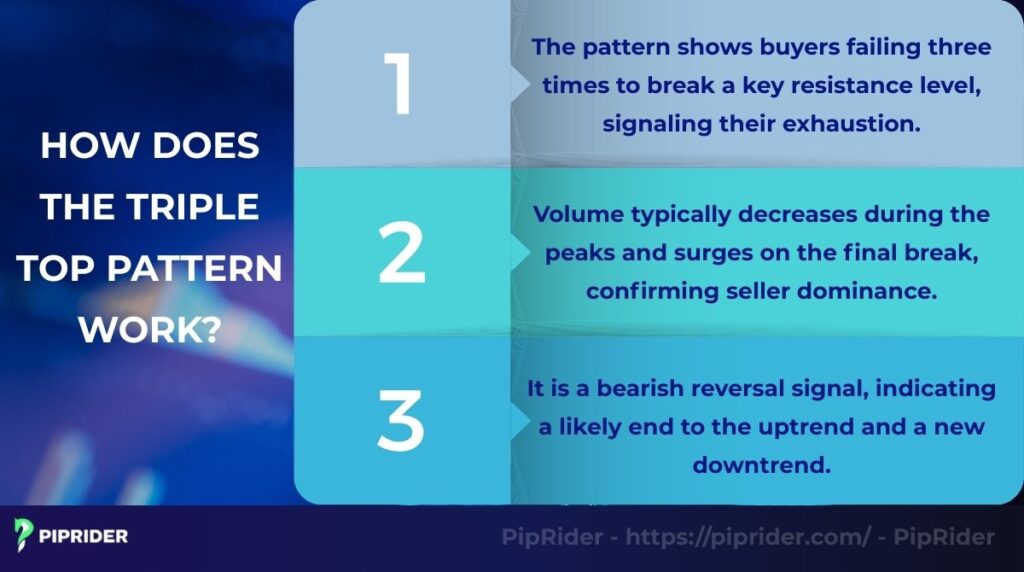
First, buyers are dominant, pushing the price to a new high. However, sellers emerge and halt the rally, pushing the price back down. Buyers then try again but are rejected at the same resistance level, showing their power is weakening. The final, third attempt is a complete failure, signaling that buyers are exhausted and can no longer sustain the uptrend.
3.2. The Crucial Role of Volume
Volume plays a key role in confirming this pattern. Typically, volume decreases as the three peaks form, showing that market interest in the uptrend is fading. When the price finally breaks the neckline, a sudden surge in volume is a powerful validation that sellers have taken control and are pushing the price down. In our experience, a low-volume breakout can be a false signal, and we always remain cautious with this type of price action.
3.3. The Reversal Signal
After the three peaks are complete and the price breaks the neckline, the Triple Top pattern officially becomes a reversal signal to the downside. It indicates that the uptrend has ended and a new downtrend is likely to begin. This is a clear signal for traders to consider closing long positions or preparing for short trades.
4. Importance of Triple Top for Technical Analysis
The triple top pattern is a cornerstone of technical analysis for several key reasons. It’s more than just a shape on a chart; it’s a powerful tool for understanding market sentiment.
This pattern plays a critical role in identifying trend reversals. It provides a clear, objective signal that a current uptrend is losing momentum and that a reversal to a downtrend is imminent. By recognizing this pattern early, we can anticipate a significant market shift, allowing us to adjust our strategies from a bullish to a bearish perspective.
The triple top is generally considered more reliable than the similar double top pattern. The three failed attempts to break through resistance provide stronger evidence of buyer exhaustion and seller dominance. This repeated rejection at a key resistance price level gives us greater confidence in the bearish signal.
Ultimately, this pattern helps us analyze the market’s underlying meaning. Each peak and valley tells a story about the ongoing battle between supply and demand. The pattern’s formation reveals a market that’s struggling to go higher, signaling a significant loss of bullish momentum, and that a significant price correction is on the way.
5. Benefits and Risks of Using Triple Top in Trading
The triple top pattern can be a powerful tool, but like any strategy, it comes with both advantages and potential pitfalls. Understanding these is key to using the pattern effectively in trading.
5.1. Potential Benefits
The Triple Top offers several distinct advantages that enhance trade planning and execution.
- Clear short entry: One of the biggest advantages is that it provides a very clear and objective signal for entering a short trade once the neckline is broken.
- Measurable profit targets: The pattern allows for a simple, measurable way to set profit targets (often calculated by projecting the height of the pattern downwards from the neckline).
- Enhanced risk management: This clarity in entry and target helps us manage risk and make quick, confident decisions, reducing the guesswork often involved in trading.
5.2. Risks and Limitations
Despite its reliability, the pattern is subject to certain risks and limitations that traders must be aware of.
- False breakouts: This happens when the price briefly breaks below the neckline, triggering a sell signal, but then quickly reverses back above it, leading to a potential loss if a stop loss isn’t set.
- Confusion with sideways ranges: A market can bounce between resistance and support multiple times without being a reversal pattern. We must always wait for the final, confirmed breakout to avoid getting caught in a range.
6. How to Identify a Triple Top Pattern on a Chart
Accurately identifying a triple top pattern on the chart is the first critical step to trading it successfully. Traders should follow a practical, step-by-step approach to recognize this powerful reversal signal correctly.

6.1. Practical Identification Steps
The identification process involves five crucial steps, focusing on price action, structure, and volume confirmation.
Step 1: Establish the uptrend
First, confirm that the market is in a clear, sustained ascending trend. A triple top is a trend change pattern, meaning it signals the end of an existing upward movement.
Step 2: Locate three peaks
Identify three distinct high points that reach approximately the same resistance price point. These peaks should be separated by two notable troughs (dips in price). The highs don’t need to be exactly identical in price, but they should be very close, forming a strong resistance area.
Step 3: Draw the neckline
Connect the lowest points of the two troughs that fall between the three tops. This line is called the neckline, and it acts as a critical support level.
Step 4: Observe volume trends
Pay close attention to trading volume. Typically, volume trends to decrease as each successive peak is formed, signaling a diminishing interest from buyers.
Step 5: Wait for the breakout
The pattern is confirmed only when the price decisively breaks and closes below the neckline. This breakout should ideally be accompanied by a significant increase in trading volume, signaling strong selling pressure.
6.2. Suitable Timeframes
While a triple top can appear on intraday charts, longer timeframes tend to be significantly more reliable. According to classical technical analysis guidelines, a major triple top reversal in the stock market typically takes anywhere from 3 to 6 months to fully develop its three distinct peaks (StockCharts, n.d.). Traders therefore prioritize this pattern on:
- Daily charts: Provides robust signals for swing trading and effectively captures the multi-month formation process without excessive market noise.
- Weekly charts: Offers even stronger, macroeconomic reversal indications for long-term position traders.
Shorter timeframes (e.g., hourly or 15-minute charts) are heavily saturated with market noise and exhibit a much higher rate of false breakouts. Attempting to trade a triple top on these micro-timeframes requires extreme caution and stringent confirmation.
6.3. Candlestick Chart Example
When identifying the triple top, a candlestick chart is the preferred tool. Candlesticks clearly illustrate the open, close, high, and low prices, making the formation of the three high points and the breakout below the neckline easily visible.

For instance, imagine a candlestick chart where three bullish candles push up to a resistance, then bearish candles follow, forming the troughs, before a final large bearish candle breaks definitively below the neckline on high volume. This visual clarity is essential for accurate pattern recognition.
7. How to Trade the Triple Top pattern
Trading the Triple Top pattern effectively requires a disciplined approach, combining careful observation with precise execution. This section outlines a clear, step-by-step strategy, covering critical aspects from identifying the ideal entry to managing risk and setting profit objectives, enabling traders to capitalize on this powerful bearish reversal signal.
7.1. Entry Strategy
The trading strategy for the triple top pattern focuses on patience and strict validation. Traders must never enter a trade while the pattern is still forming. Once the price reaches the neckline, professionals typically utilize one of two primary entry methods:
- Entry A (Aggressive Breakout): The trader executes a short position the moment a strong bearish candle decisively closes below the neckline support level. Waiting for a confirmed candle close—rather than a temporary intraday dip—is mandatory.
- Entry B (Conservative Retest): To drastically reduce the risk of a false breakout, conservative traders wait for the price to pull back and retest the broken neckline from below. Once the old support is confirmed as new resistance, they enter the market.
For added security during an aggressive breakout, centralized markets (like stocks or crypto) require a sudden volume spike to confirm that sellers have taken control. However, a critical distinction applies to currency markets: In spot forex, volume is often tick volume based on individual brokers. Forex traders must treat volume metrics as purely supportive, strictly prioritizing the definitive candle close and a successful structural retest instead.
False Breakout Checklist: Before committing capital to a breakdown, traders should run through this quick evaluation to filter out market traps:
- Candle Close vs. Wick: Did the price definitively close below the neckline, or did only a wick pierce the support zone?
- Candle Body Size: Does the breakdown candle exhibit a large, full bearish body signaling strong selling momentum?
- Retest Failure: If a pullback occurred, did the price fail to break back above the neckline, confirming the zone as new resistance?
- HTF Alignment: Is the breakout aligned with the broader market direction, or is it fighting a dominant Higher Time Frame (HTF) uptrend?
7.2. Stop Loss Placement
Setting a strategic stop loss is a critical step for risk management once a short trade is entered.
- Placing the stop loss here ensures that potential loss is limited to a pre-determined, acceptable amount.
- For a triple top pattern, the stop loss is typically placed just above the highest of the three peaks or the most recent peak.
- The logic behind this placement is that if the price moves past that final peak, it invalidates the entire pattern, meaning the bearish signal was incorrect.
7.3. Take Profit Targets
Securing profits often relies on a practical and widely used method called the “measured move.”
- To calculate the profit target for the triple top pattern, the trader measures the vertical distance from the highest of the three peaks down to the neckline.
- This exact distance is then projected downwards from the breakout point (where the price broke below the neckline).
- The calculated price point serves as the primary take-profit target, based on the principle that the distance of the initial price swing often equals the magnitude of the subsequent move after the pattern is confirmed.
7.4. Example Trade
To bring this strategy to life, let’s walk through a practical case study on the EUR/USD currency pair.
Assume a clear Triple Top pattern emerges on the EUR/USD daily chart. The three peaks form around the 1.1000 resistance price point, and the Neckline sits firmly at 1.0800.
- Action Steps: The pattern achieves confirmation when a strong bearish candle decisively breaks and closes below the 1.0800 Neckline. The trader enters a Short position at or near this breakout level.
- Calculate Pattern Distance (M):
- M = Peaks – Neckline
- M = 1.1000 – 1.0800 = 0.0200 (200 pips)
Trade Plan Summary
| Action | Price Level | Logic & Rationale |
|---|---|---|
| Entry (Short Position) | ≈ 1.0800 | Confirmed breakdown and definitive candle close below the Neckline. |
| Stop Loss (SL) | 1.1000 | Placed just above the highest peak. Reaching this level invalidates the pattern. |
| Take Profit (TP) | 1.0600 | Calculated using the Measured Move strategy: Neckline – Distance (M) = 1.0800 – 0.0200 = 1.0600 |
| Risk/Reward | Variable (Targeting ≥ 1:1.5) | Risk/reward depends heavily on stop placement and neckline distance. Many professional traders target a ratio of 1:1.5 or higher if the broader market structure allows, adjusting their stop-loss accordingly. |
This example demonstrates how the Triple Top pattern provides a complete trading plan with defined entry, exit (SL), and profit (TP) levels, giving the trader a clear roadmap to follow in a live market.
8. When Should You Use the Triple Top Chart Pattern?
The triple top pattern is a specific signal for a specific market condition. Knowing when to look for it is key to its effectiveness.
- In a bullish market: The pattern forms at the peak of an established uptrend, signaling that the buying momentum is exhausted and a bearish reversal is likely. It tells traders to prepare for a shift from up to down.
- In a bearish market: The triple top is not relevant here. Since it’s a reversal from an ascending trend, it holds no significance if the market is already falling. Traders should look for bullish patterns instead.
- In a sideways/ranging market: Be cautious. While price might hit resistance three times, it’s not a true triple top unless preceded by a clear uptrend and confirmed by a strong breakout with volume. Traders must avoid confusing consolidation with a genuine reversal signal.
9. Indicators That Work Best with Triple Top
Combining the triple top pattern with other technical indicators significantly boosts its reliability. These tools help confirm the pattern and provide higher-conviction trade signals.
- Volume: Traders look for decreasing volume during peak formation (showing fading buyer interest) and a sharp increase in volume during the neckline breakout (confirming strong selling pressure). Without volume validation, traders are cautious.
- Moving Averages (MA): A break below a key Moving Average (e.g., 50-period or 200-period MA) at the same time the neckline is broken adds powerful validation of a new downtrend.
- Relative Strength Index (RSI): Traders often seek bearish divergence. This happens when the price makes higher highs on the tops, but the RSI makes lower highs, signaling a loss of bullish momentum even before the price drops.
- Fibonacci Retracement Levels: If the neckline of the triple top aligns with a significant Fibonacci retracement level (like 50% or 61.8%), it reinforces the importance of that support zone, making a breakout even more meaningful.
10. Mistakes to Avoid When Trading
Even with a reliable pattern like the triple top, mistakes can lead to losses. Avoiding these common pitfalls is key to success.
- Entering too early before breakout: Many traders jump into a short position once the three peaks are visible but before the price decisively breaks the neckline. This is highly risky, as the pattern is not confirmed, and the price could reverse and continue its ascending trend. Always wait for a confirmed close below the neckline.
- Ignoring volume confirmation: A breakout without accompanying volume is often a false breakout. If the price breaks the neckline but volume is low, it suggests a lack of strong selling conviction. Always disregard such signals and only trade when a significant surge in volume confirms strong selling pressure.
- Forgetting to set a stop-loss: No pattern is 100% accurate. If the triple top fails and the price reverses upwards, a properly placed stop loss order will automatically close the trade, limiting potential loss to a predetermined amount. Always place stop loss just above the most recent peak to protect capital.
11. Triple Top vs Other Chart Patterns
The Triple Top pattern is a powerful reversal signal, but it’s important to differentiate it from other commonly observed chart formations. Understanding its unique characteristics compared to similar patterns can help traders avoid misinterpretations and improve their decision-making.
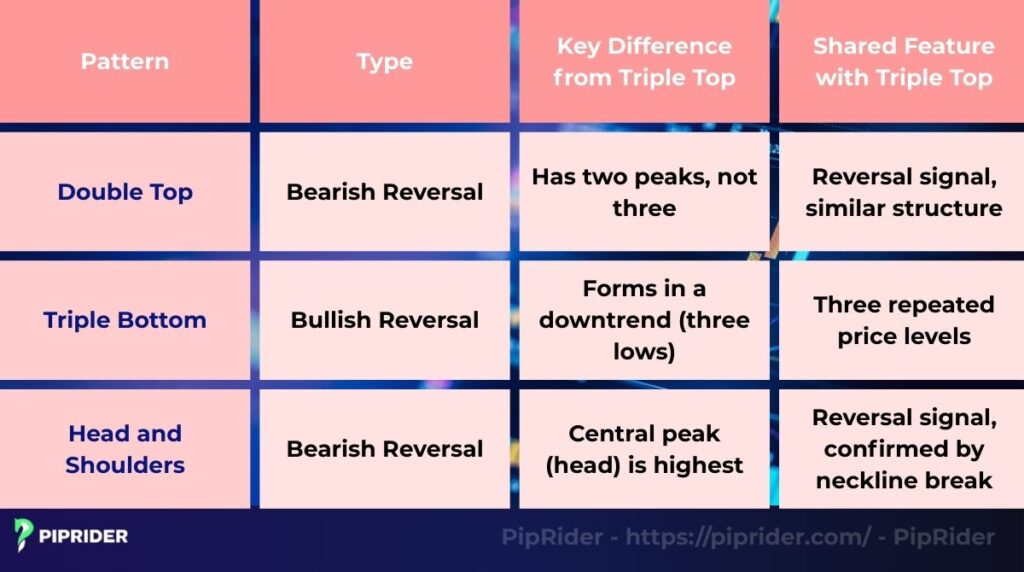
11.1. Triple Top vs Double Top
The two patterns are often confused because both are reversal signals for a downtrend. They share a similar structure, with two or three peaks at a resistance level and a neckline.
The key difference lies in the number of peaks. While the double top has two failed attempts to break resistance, the triple top has three. Although this extra rejection illustrates a more prolonged struggle for buyers, it does not automatically make the pattern more reliable. In fact, historical performance statistics vary significantly by market and timeframe. Therefore, both formations demand a strict, volume-backed neckline breakout before a trader can confidently confirm the bearish signal.
11.2. Triple Top vs Triple Bottom
Two of them are symmetrical opposites. While they share a similar structure of three repeated price levels, their market conditions and trading implications are completely different. This makes understanding triple tops and bottoms crucial.
- The Triple Top is a bearish reversal pattern. It forms at the end of a sustained uptrend and signals that a move to the downside is imminent. The three high points fail to break resistance, and the pattern is confirmed when the price breaks below the neckline support.
- The Triple Bottom is a bullish reversal pattern. It forms at the end of a sustained downtrend and signals a potential move to the upside. The three troughs (or valleys) fail to break support, and the pattern is confirmed when the price breaks above the neckline resistance.
In short, a triple top signals a shift to a bearish trend, whereas a triple bottom indicates a shift to a bullish one. They are two sides of the same coin.
11.3. Triple Top vs Head and Shoulders
Both of them are considered among the most well-known major reversal patterns for a downtrend in technical analysis. While they share a similar purpose and strategy, their defining structural features are different.
- The Triple Top is characterized by three distinct peaks at approximately the same resistance price point. It signals that the market has attempted and failed to break through a key resistance level three consecutive times.
- The Head and Shoulders pattern, by contrast, is defined by three tops where a central peak (head) is significantly higher than its two surrounding tops (shoulders). This formation suggests a loss of upward momentum as price fails to make a new high after the head.
Both patterns are confirmed by a decisive break below their respective necklines and are traded in a similar fashion. The key distinction is the shape of the peak, which tells a slightly different story about the market’s psychological exhaustion, but ultimately leads to the same bearish conclusion.
12. Real-World Examples of Successful Trades
Seeing the triple top pattern in action on historical charts helps solidify understanding. Here are two real-world examples of how this bearish reversal formation has actually played out in major markets.
12.1. Stock Example: Tesla (TSLA) – 2022
A textbook example of a triple top occurred on the Tesla (TSLA) daily chart in the second half of 2022.
- The Setup: After a volatile period, the stock rallied to form three distinct peaks near the $308 resistance level between August and September.
- The Neckline: The pullbacks between these peaks established a firm support neckline around $265.
- The Breakdown: In late September, TSLA’s price decisively broke and closed below the $265 neckline with a noticeable increase in selling volume.
- The Result: This breakdown confirmed the bearish reversal. Traders who entered a short position at $265 with a stop-loss above $310 were highly rewarded. The stock price plummeted in the following months, easily smashing the measured move target ($308 – $265 = $43 drop, making the target $222) and continuing much lower.

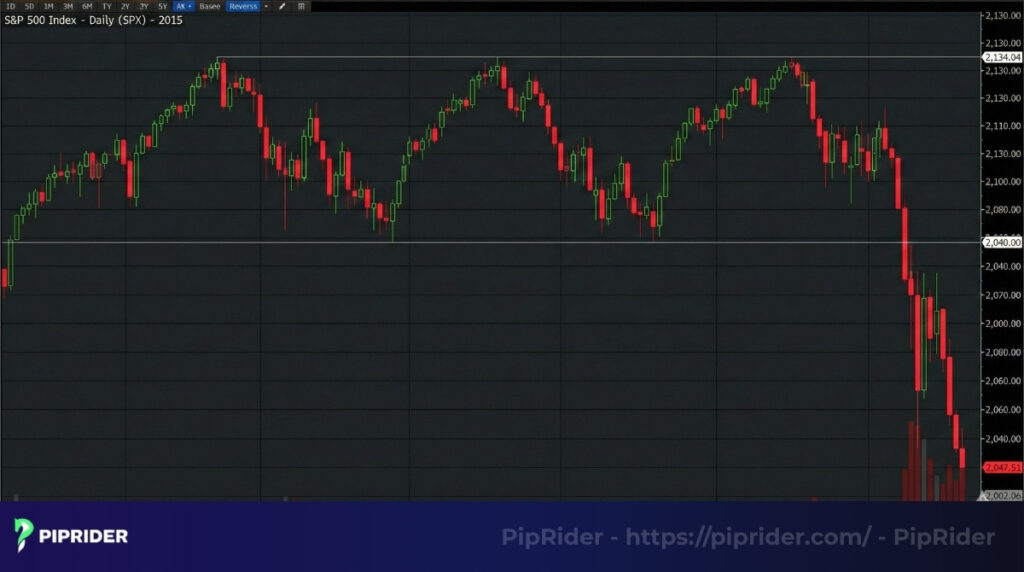
12.2. Index/Macro Example: S&P 500 (SPX) – 2015
A classic macroeconomic example of this pattern formed on the S&P 500 index over a prolonged period in 2015.
- The Setup: The index repeatedly struggled to break past the 2,130 resistance zone, forming three major macroeconomic peaks spanning from February to July.
- The Neckline: The intervening troughs created a critical support zone near 2,040.
- The Breakdown: When the index finally broke below the 2,040 support level in late August 2015, panic selling ensued, accompanied by a massive volume spike.
- The Result: The breakdown triggered a sharp market sell-off, with the index dropping rapidly to the 1,870 level within days. This move far exceeded the measured take-profit target, validating the long-term triple top as a powerful early warning signal for institutional and retail traders alike.
13. FAQs
Here are quick, direct answers to common questions about the triple top pattern, with a bit more detail:
14. Summary
The triple top pattern stands out as a classic bearish reversal formation, providing traders with a clear signal of weakening uptrends and impending market shifts. Its formation, three failed attempts to break resistance followed by a decisive neckline breakout—offers a robust framework for anticipating a new downtrend.
When combined with essential confirmation tools like volume, RSI divergences, and key Fibonacci retracement levels, the triple top transforms into an even more powerful instrument, significantly optimizing trading strategies for accuracy and risk control.
To further deepen your understanding of market conditions and master other critical formations, we encourage you to explore our comprehensive Trading Patterns section on Piprider.
Infographic Section
-
Structure Triple Top Pattern -
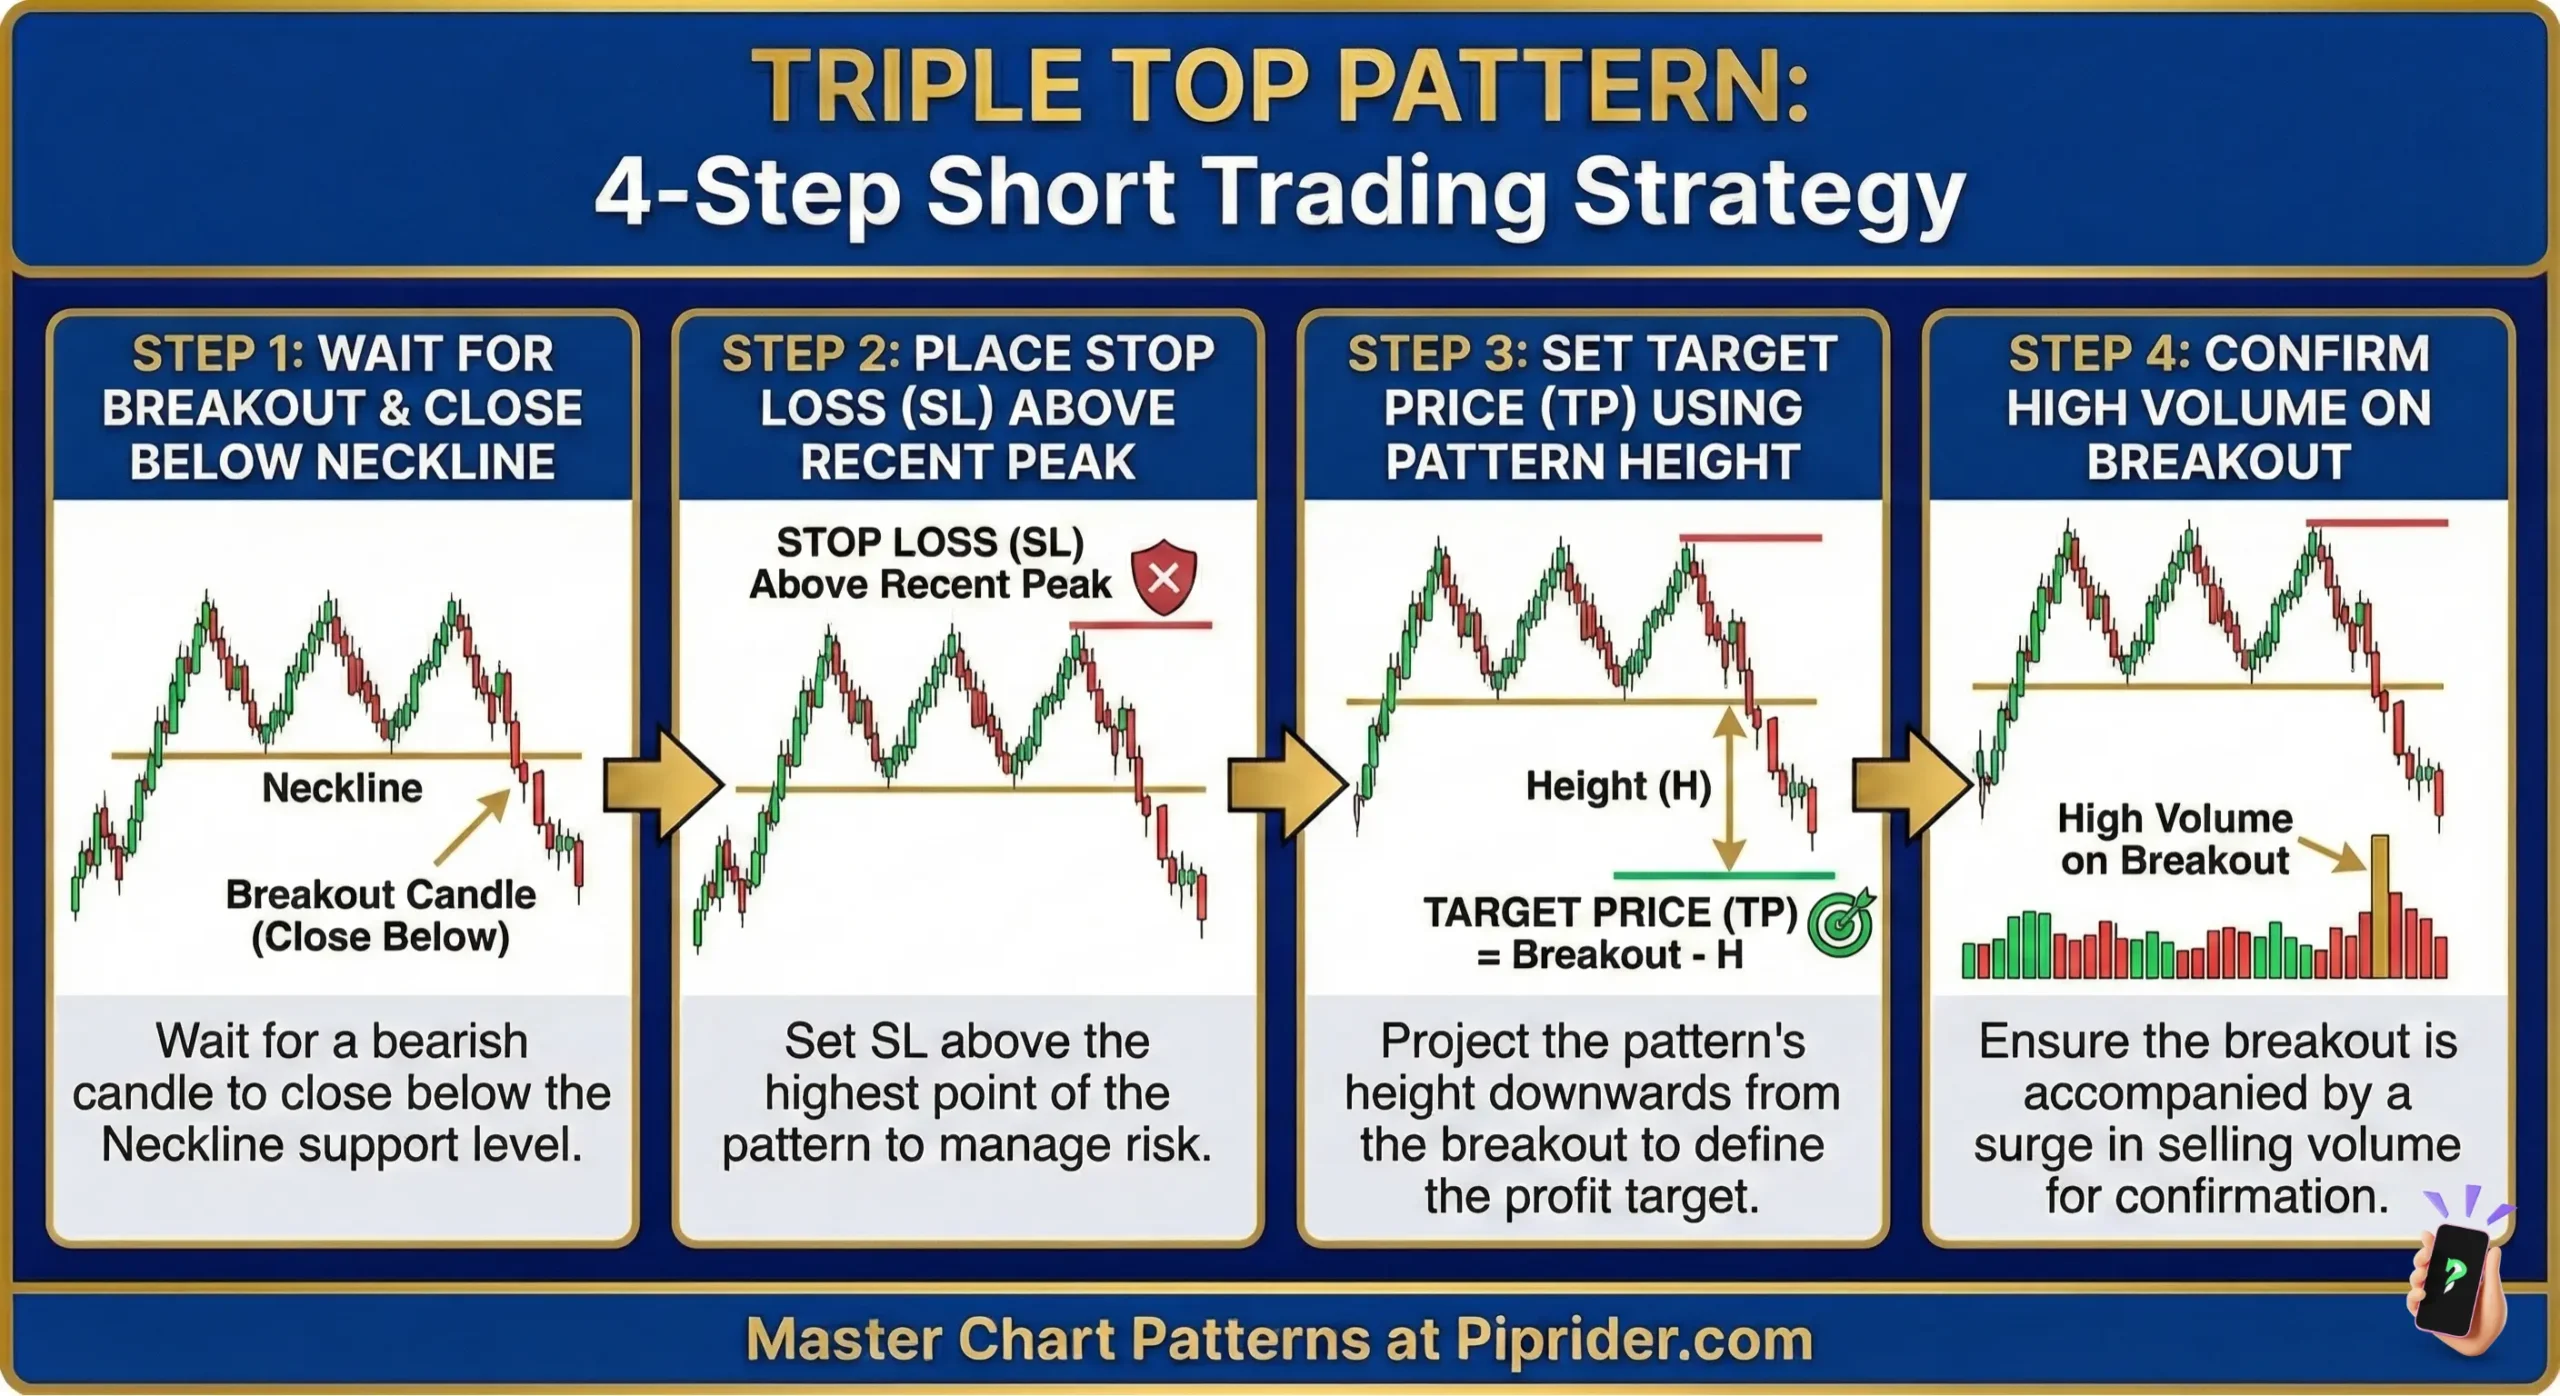
Triple Top Pattern: 4 Step Trading Strategy -
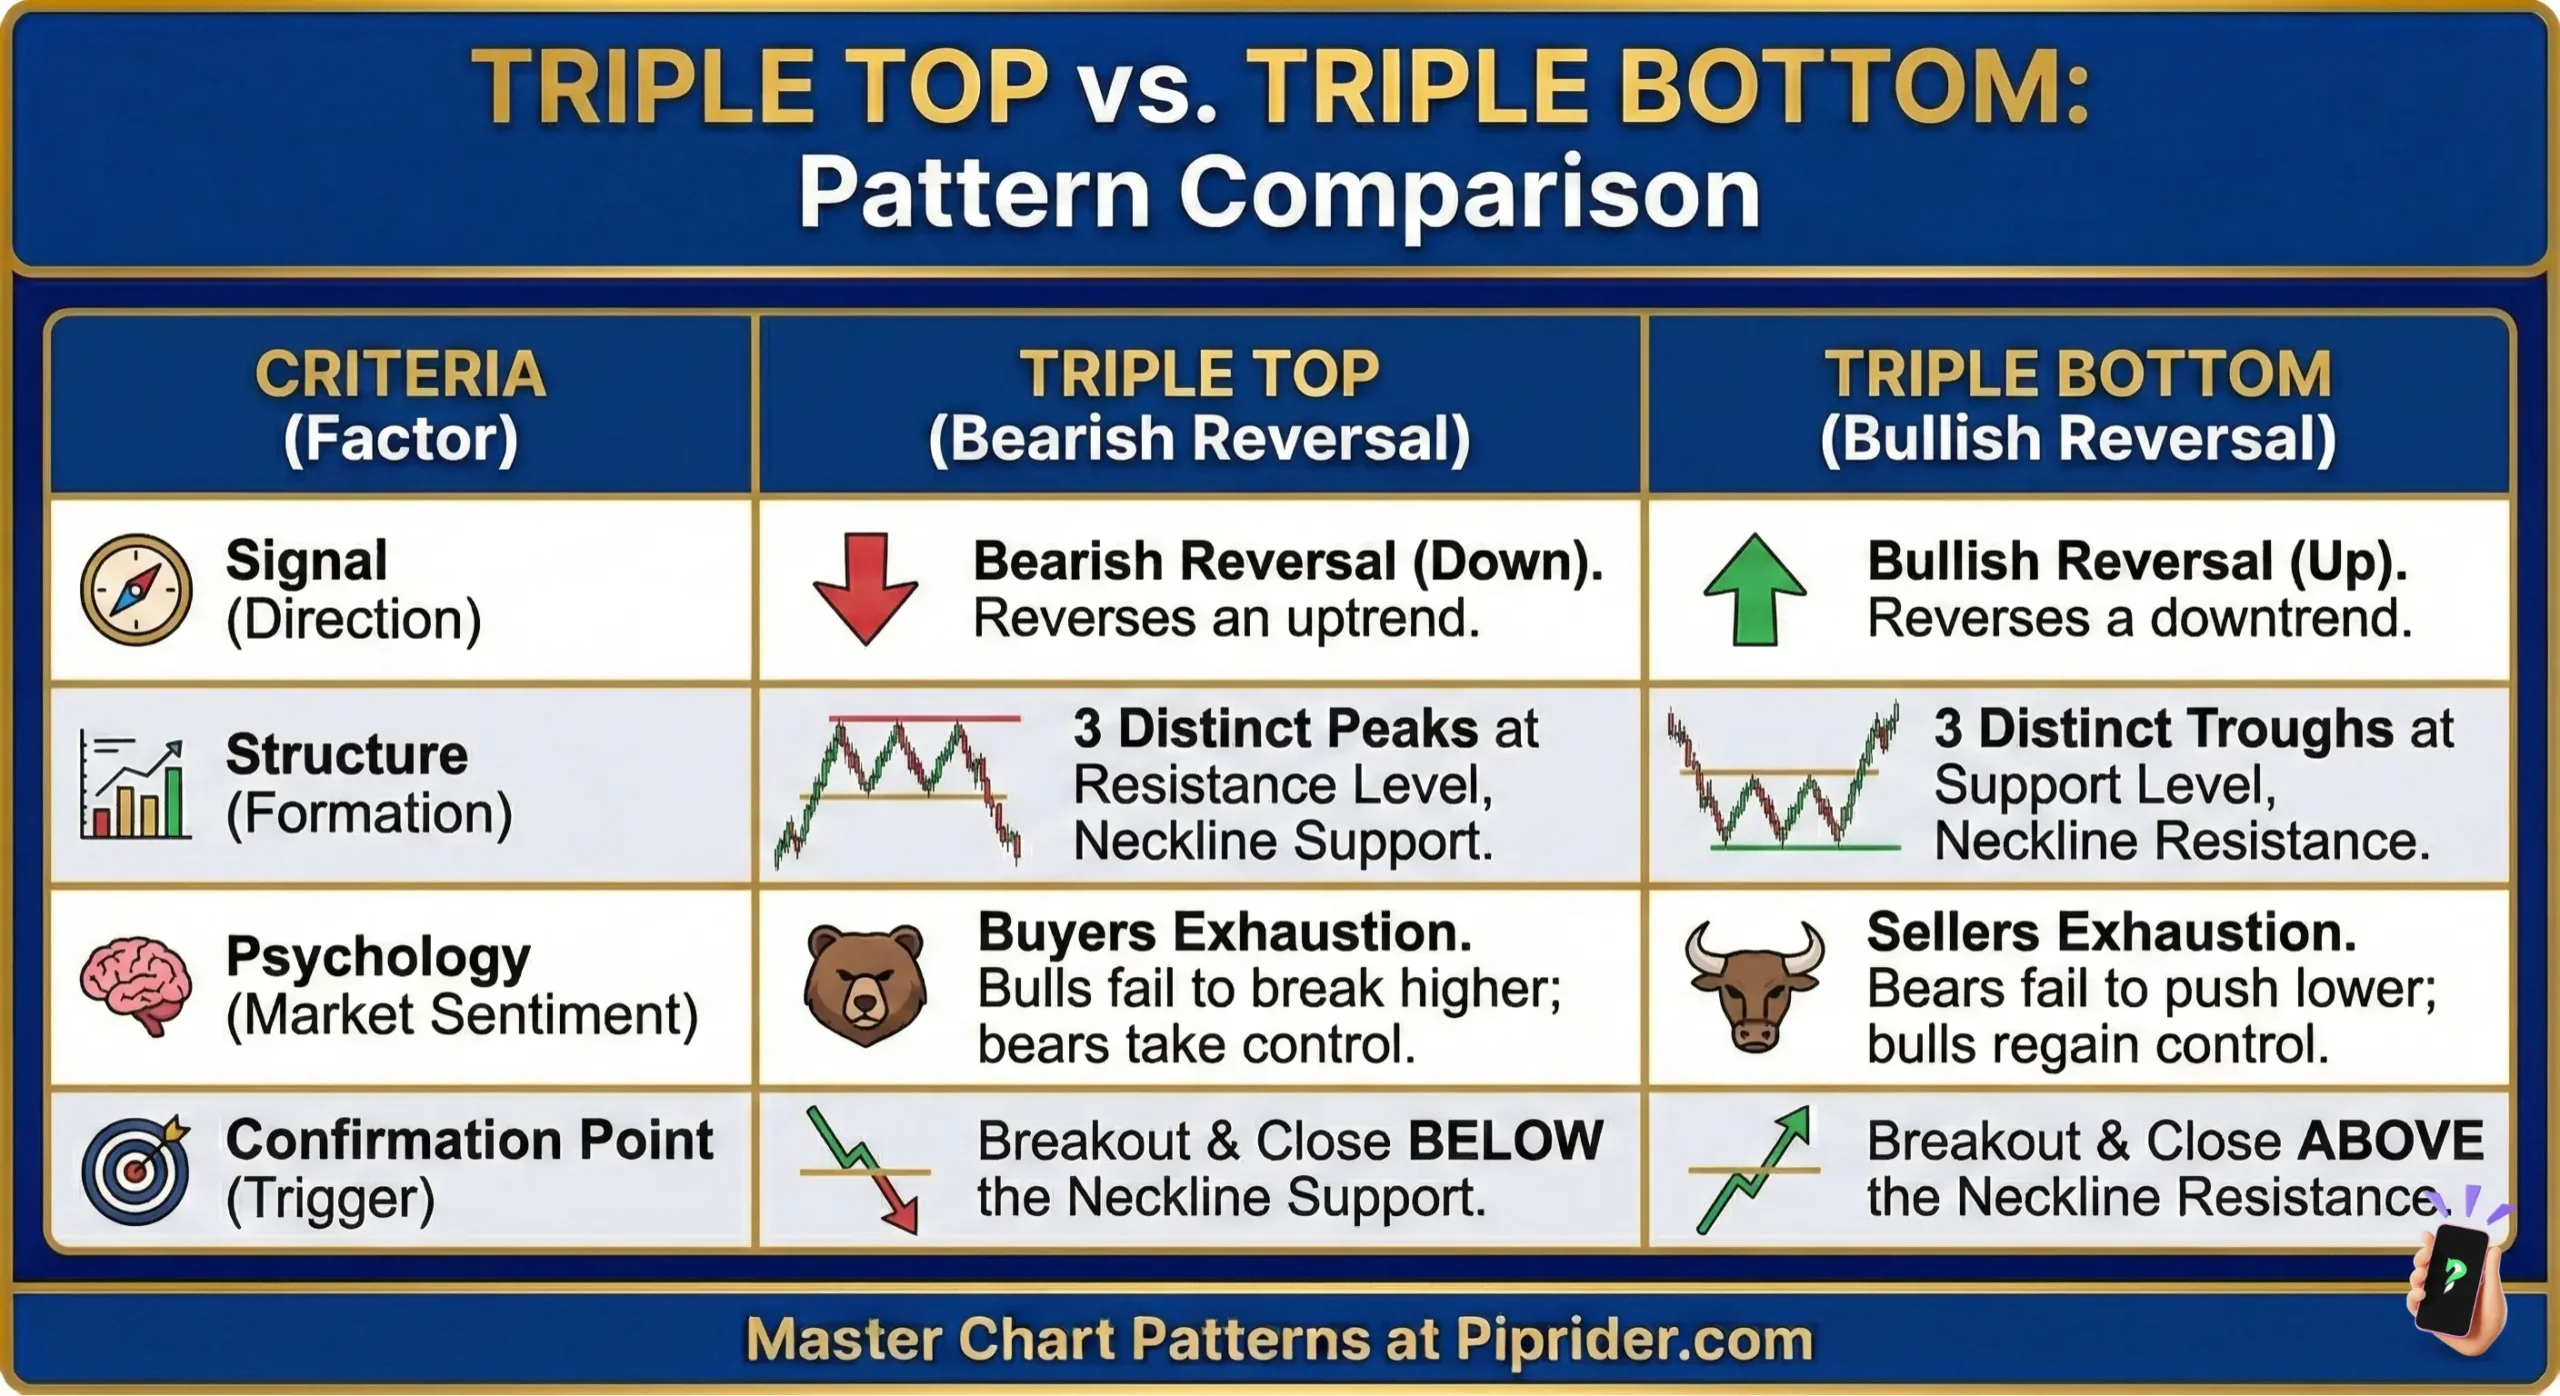
Triple Top Pattern vs. Triple Bottom Pattern


