
The True Strength Index (TSI) is a momentum oscillator that uses a unique double-smoothing technique to filter out market noise. Unlike standard indicators, TSI provides a crystal-clear view of the trend by focusing on three critical signals: Zero-Line Bias (Trend Direction), Signal Crossovers (Entry Timing), and Divergence (Reversal Warnings).
In this guide, Piprider breaks down the formula and provides a practical playbook for trading these signals effectively.
Key Takeaways
- Double-Smoothed Precision: The TSI uses two layers of smoothing to filter out erratic price noise, revealing the true underlying trend.
- Three Core Signals:
- Zero Line: Determines the overall market bias (bullish > 0, bearish < 0).
- Signal Cross: Pinpoints precise entry and exit timing.
- Divergence: Acts as an early warning system for trend reversals.
- Versatility: Effective for trend following (pullbacks) and reversal trading (divergence).
- Comparison: Offers smoother, less frequent signals than the RSI or MACD.
1. What Is the True Strength Index TSI?
True Strength Index TSI is a technical momentum oscillator that gauges the strength and direction of a market trend. Its primary objective is to provide a clear, smoothed representation of price momentum by measuring the velocity of price changes. What makes the indicator unique in technical analysis is its method of double smoothing these price changes, which helps to filter out insignificant market noise (StockCharts, n.d.).
In the 1990s, William Blau engineered the TSI to blend the responsiveness of a momentum indicator with the stability of moving averages (Blau, 1995). This creates a versatile tool that traders find highly effective across various financial markets.
The TSI is constructed from three primary components that work together to produce the final indicator.
- Price Momentum Line (PML): This measures raw market momentum, calculated as the difference between the current and previous closing prices.
- Volatility Smoothing: This core mechanism applies a double Exponential Moving Average to the PML. This smoothing technique effectively smooths the data to filter out market noise.
- Signal Line: This is an EMA of the final, smoothed TSI line. We use its crossovers to identify potential trading signals.
2. How to Calculate the True Strength Index TSI?
You do not need to calculate this manually, but understanding the logic helps you trust the signals. The TSI is unique because it smooths the data twice to remove noise (whipsaws) without sacrificing speed.
2.1. The “Double Smoothing” Formula
The calculation involves three distinct steps to filter out market noise:
- Momentum: Calculate the Price Change (Current Price – Previous Price).
- First Smoothing (Long Term): Apply a 25-period EMA to the Price Change.
- Second Smoothing (Short Term): Apply a 13-period EMA to the result of step 2.
The TSI Formula
In Plain English:
- The Numerator measures the direction (Trend).
- The Denominator measures the total volatility.
- Result: This ratio ensures the TSI oscillates smoothly between -100 and +100.
2.2. The Signal Line (The Trigger)
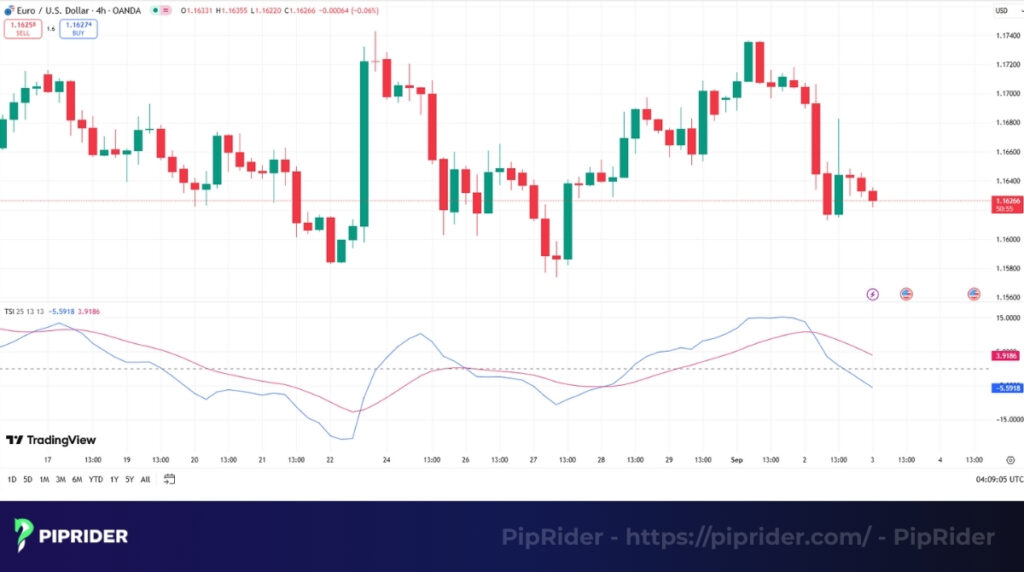
Most traders miss this part: The TSI indicator actually consists of two lines, not one.
- The TSI Line (Main): The result of the formula above (usually Black or Blue).
- The Signal Line (Trigger): An EMA of the TSI Line (usually Red).
This Signal Line is crucial for timing. It lags slightly behind the TSI, creating “Crossover” buy/sell signals.
- Standard Setting: Usually a 7 to 13-period EMA.
2.3. Platform Mapping: Why Your Inputs Look Different
A common source of confusion is that TradingView and MT4 often use different default settings for the Signal Line.
| Platform | Long Length | Short Length | Signal Length | Notes |
|---|---|---|---|---|
| Standard (Textbook) | 25 | 13 | 7 – 12 | Based on William Blau’s original work (Blau, 1995). Faster signals. |
| TradingView | 25 | 13 | 13 | Default is slower. Uses a 13 EMA signal, making it smoother but slightly lagging (TradingView, n.d.). |
| MT4 / MT5 | 25 | 13 | Hidden | Most basic MT4 indicators do NOT have a signal line unless you use a custom version. |
Actionable Tip: If you are following a strategy from an old trading book, check your Signal Line setting. If the book says “Cross,” but your TradingView chart hasn’t crossed yet, change the Signal Length from 13 to 7 to match the book’s speed.
3. Best TSI Settings for Every Trading Style
There is no “magic number” that works for every market condition. The default settings are great for general use, but professional traders often tune the TSI to fit their specific timeframe (Day Trading vs. Swing Trading).
The key trade-off to remember is:
- Lower Settings (Fast): More signals, but higher risk of false alarms (noise).
- Higher Settings (Slow): Smoother lines, but entries may be late (lag).
3.1. The “Golden Rule” Configuration Table
Use this reference guide to configure the TSI for your specific strategy.
| Trading Style | Long Length | Short Length | Signal Line | Best Use Case |
|---|---|---|---|---|
| Standard (Default) | 25 | 13 | 7 – 13* | Balanced. Ideal for Swing Trading (H4, Daily). Catches major moves. |
| Fast (Scalping) | 15 – 20 | 5 – 10 | 5 – 7 | Responsive. Used for Day Trading (M5, M15). Warning: Noisy. |
| Slow (Trend) | 40 | 20 | 15 | Smooth. Best for Weekly charts to filter out all minor corrections. |
3.2. How to Tune Your Settings
To customize the indicator yourself, understand what each number controls:
- Long Length (Base Trend): Increasing this (e.g., to 50) forces the indicator to ignore short-term volatility.
- Short Length (Refinement): Lowering this (e.g., to 7) makes the line jagged and reactive to immediate price spikes.
- Signal Line (The Trigger):
- Low (5-7): Crosses quickly for early entries (Aggressive).
- High (13+): Waits for confirmation (Conservative).
Pro Tip for Crypto Traders: Crypto assets like Bitcoin are naturally volatile. Avoid “Fast” settings as they produce too many fakeouts. Stick to the Standard (25, 13) settings to filter the noise effectively.
4. Interpreting the True Strength Index TSI Values
The correct interpretation of the True Strength Index indicator is straightforward. We focus on three key signals: extreme levels, line crossovers, and price divergence, which often foreshadow significant market turns.
4.1. Overbought and Oversold Levels (Dynamic Calibration)
Unlike the RSI, which is bound between 0 and 100, the TSI is an unbound oscillator. Its values can theoretically go indefinitely high or low depending on the asset’s volatility (StockCharts, n.d.).
Therefore, the standard levels of +25 and -25 are NOT universal rules. Treating them as rigid signals will lead to premature exits in strong trends.
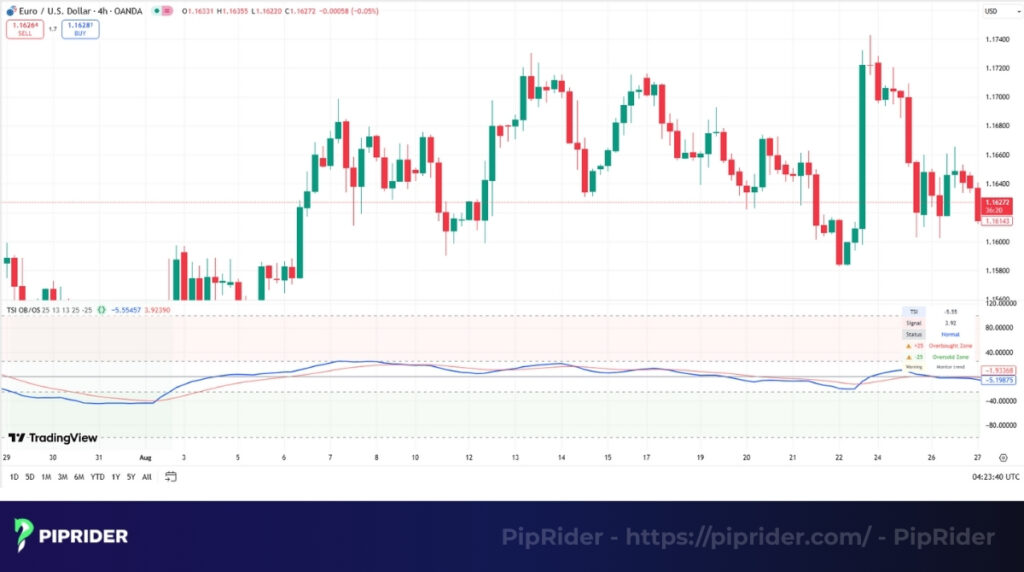
How to Calibrate Your Levels: Since every asset has a unique “personality,” you must adjust the overbought/oversold lines to fit the specific volatility of the chart you are trading. Use one of these two methods:
- Method 1: Visual Calibration (The 6–12 Month Lookback)
- Step 1: Zoom out your chart to view the past 6 to 12 months of price action.
- Step 2: Identify the major peaks and troughs where the price actually reversed.
- Step 3: Draw horizontal lines at these specific levels. For a volatile stock (like Tesla or Nvidia), the “true” overbought line might be +40 or +50, not +25.
- Method 2: The Percentile Rule (Top/Bottom 10%)
- Follow the principle that “extremes are rare.” Identify the levels where the TSI spends only 10% of its time.
- If the TSI rarely crosses above +35, then +35 is your statistical “Extreme Zone.” Any reading below that is simply normal noise, not a reversal signal.
⚠️ The “Trend Trap” Warning: In a strong trending market, hitting these extreme levels (+25 or +40) does NOT mean “Sell.” It often indicates Trend Strength.
- In a Range: Extremes signal a potential Reversal (Fade the move).
- In a Strong Trend: Extremes signal Momentum Continuation (Ride the move). Do not short until you see a clear bearish divergence or a break of structure.
4.2. Centerline & Signal Line Crossovers
Crossovers signal a potential shift in market momentum.
- Centerline Cross: When the TSI crosses above zero, momentum turns bullish. When it crosses below zero, momentum turns bearish. This is a primary trend direction signal.
- Signal Line Cross: A faster, earlier signal occurs when the TSI line crosses its companion EMA. This can be used for more aggressive trade entries.
4.3. Divergence Between TSI And Price
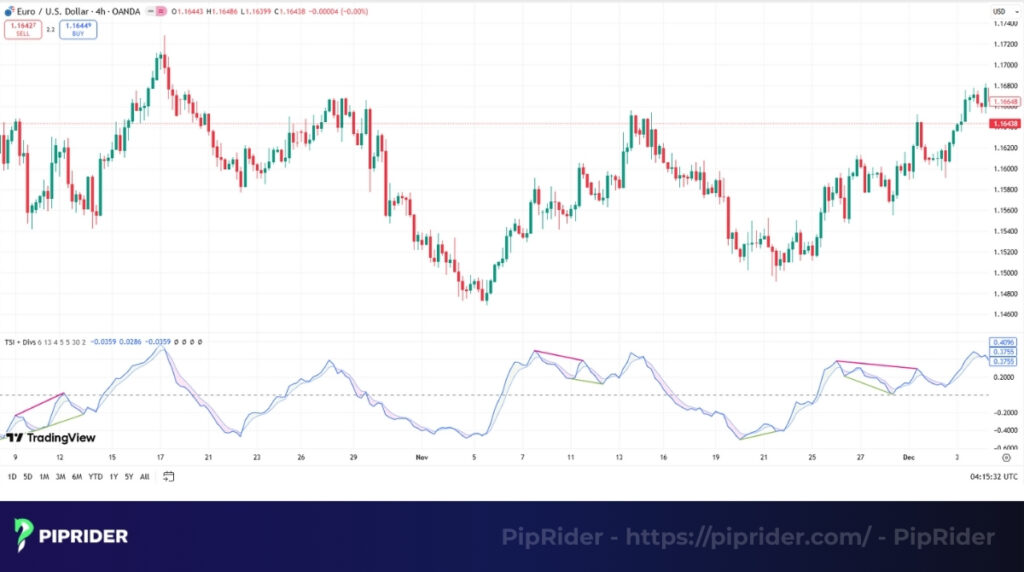
The True Strength Index TSI and Price Divergence is a powerful reversal signal that occurs when the indicator and the price move in opposite directions. Spotting this disagreement is a key skill for anticipating a potential price reversal.
- Negative Divergence: The price makes a higher high, but the TSI makes a lower high. This warns that buying momentum is weakening.
- Positive Divergence: The price makes a lower low, but the TSI makes a higher low. This warns that selling momentum is fading.
5. How to Trade TSI: 3 High-Probability Playbooks
Knowing the formula is not enough; you need a strict execution plan. Below are three rule-based strategies designed to help you catch trends, spot reversals, and avoid false breakouts using the TSI.
5.1. Playbook A: The “Pullback Sniper” (Trend Following)
This is a low-risk strategy ideal for beginners. It involves waiting for an established trend to pause (pullback) and using the TSI to time the resumption of the move.
TRADING RULES:
- Best For: Trending Markets (Stocks, Forex pairs like GBP/JPY).
- The Context: Price is trading ABOVE the 200-period EMA (Uptrend).
- The Setup: Price pulls back towards the EMA but does not close below it.
- The Trigger:
- TSI Line drops near the Zero Line (resetting momentum).
- Signal: TSI crosses ABOVE the Signal Line.
- Stop Loss (SL): Place just below the recent Swing Low of the pullback.
- Take Profit (TP): Target the previous Swing High (Risk/Reward 1:2).
5.2. Playbook B: The “Divergence Fade” (Reversal)
This is a counter-trend strategy used to catch market tops or bottoms. It relies on the concept that momentum changes direction before price does.
TRADING RULES:
- Best For: Range-bound markets or exhausted trends.
- The Context: Price hits a major Support or Resistance level (e.g., Daily High).
- The Setup:
- Price: Makes a Lower Low.
- TSI: Makes a Higher Low (Positive Divergence).
- The Trigger: Wait for the TSI to cross ABOVE the Signal Line.
- Crucial Confirmation: Price must print a reversal candlestick (e.g., Hammer or Engulfing).
- Stop Loss (SL): Strictly below the absolute Low of the formation.
- Take Profit (TP): Target the nearest Moving Average (e.g., 50 EMA).
5.3. Playbook C: The Breakout Filter (Trap Avoidance)
Use this technique not to enter trades, but to filter out bad signals. It prevents you from buying “Bull Traps” or selling “Bear Traps.”
TRADING RULES:
- Best For: Breakout Traders.
- The Situation: Price is breaking a key Resistance level.
- The Decision:
- VALID BREAKOUT: TSI is pointing sharply UP and the lines are expanding (Velocity is increasing). → Action: Enter Trade.
- FALSE BREAKOUT (TRAP): Price breaks out, but TSI is flat, pointing down, or showing Negative Divergence. → Action: Stand Aside.
6. How to Scan & Set Alerts for TSI Signals
Stop staring at the screen for hours. You can automate your trading by setting up alerts that notify you only when specific “High-Probability” conditions are met.
6.1. The “Scanner Logic” Cheat Sheet
Most beginners fail because they alert every crossover. A professional alert must combine Trend + Momentum + Trigger.
Copy these logic templates into your screener (TradingView Screener, TrendSpider, or Finviz):
| Strategy | Condition A (Trend) | Condition B (Filter) | Condition C (Trigger) |
|---|---|---|---|
| Bullish Trend (Pullback) | Price > EMA 200 | TSI Value > 0 (Positive Bias) | TSI Crosses Above Signal Line |
| Bearish Trend (Pullback) | Price < EMA 200 | TSI Value < 0 (Negative Bias) | TSI Crosses Below Signal Line |
| Bullish Reversal (Bottom) | Price < EMA 200 (Downtrend extended) | TSI Value < -25 (Oversold) | TSI Crosses Above Signal Line |
6.2. Setting Up Alerts on TradingView (Step-by-Step)
Use this method to get notified for a specific asset (e.g., Bitcoin or Gold).
- Right-click on the TSI Indicator line on your chart.
- Select “Add Alert on True Strength Index…”.
- Configure the Conditions (Crucial Step):
- Condition 1: True Strength Index.
- Action: Crossing Up (Buy) / Crossing Down (Sell).
- Condition 2: Change “Value” to True Strength Index (Signal). Note: You must select the Signal line here, or the alert will not work.
- Options: Select “Once per Bar Close”.
- Why? This confirms the cross is real and prevents false alarms during volatile candles.
Pro Tip: TradingView’s basic alert only tracks the crossover. It does not check if the price is above the EMA 200. You must visually verify the trend (Step A in the table above) before entering the trade.
6.3. Using a Market Scanner (TrendSpider / CryptoScreener)
For traders who want to scan hundreds of coins/stocks at once to find the setup:
- Timeframe: Set to 4H or Daily.
- Filter 1 (Trend):
Priceis greater thanSMA(200). - Filter 2 (Momentum):
TSI(25,13,13)is greater than0. - Filter 3 (Trigger):
TSI(25,13,13)crossed aboveTSI Signal(13).
This combination filters out 90% of the market noise, showing you only assets that are trending up and flashing a fresh buy signal.
7. Comparing TSI with Other Momentum Oscillators
No single indicator is perfect for all conditions, and it’s important to understand the nuances of different oscillator signals. Choosing the right tool depends on the market environment and your trading style. The table below provides a concise comparison of the most popular momentum oscillators.
| Indicator | Advantages (Pros) | Disadvantages (Cons) | Best Use Case |
|---|---|---|---|
| True Strength Index (TSI) | Very smooth; filters out market noise. Fewer incorrect signals in trending markets. |
Slower to react to sharp, sudden price changes. | Identifying momentum in Trending Markets. |
| Relative Strength Index (RSI) | Simple for spotting divergence. Effective for overbought/oversold levels. |
Can be choppy and give false signals. Stays extreme in strong trends. |
Gauging OB/OS in Moderately Trending or Range-bound markets. |
| MACD | Defines the primary trend’s direction. Histogram visualizes momentum shifts. |
It is a lagging indicator by design. Prone to whipsaws in sideways markets. |
Confirming the strength and direction of a Long-term Trend. |
| Stochastic Oscillator | Very fast and responsive to price. Excellent for signals in ranges. |
Extremely “noisy” and erratic in trends. Causes many misleading entries. |
Trading reversals in Range-bound / Sideways markets. |
8. How to Add TSI to Your Trading Platform
One common confusion for beginners is that the True Strength Index is not always available by default on every platform. Here is the step-by-step guide to setting it up correctly.
8.1. On TradingView (Easiest)
TradingView has the TSI built-in, but you must select the correct version.
- Open your chart.
- Click on the “Indicators” tab at the top toolbar.
- Type “True Strength Index” in the search bar.
- Select: Choose the script under the “Technicals” section (this is the official built-in version). Avoid “Community Scripts” unless you need specific custom features.
- Configure Inputs: Click the gear icon (Settings) on the indicator line.
- Long Length: 25
- Short Length: 13
- Signal Length: 13 (Default) or change to 7 for faster signals.
8.2. On MetaTrader 4 / MT5 (Requires Download)
Note: The standard version of MT4/MT5 does NOT include the True Strength Index by default. You must install a custom file.
- Download: Search for “True Strength Index MT4 indicator” (
.ex4) or “TSI MT5” (.ex5) from a reputable source like the MQL5 Market. - Open Data Folder: In MT4, go to File → Open Data Folder.
- Install: Navigate to MQL4 → Indicators. Paste your downloaded file into this folder.
- Refresh: Open the Navigator panel (Ctrl+N), right-click on “Indicators”, and select “Refresh”.
- Add to Chart: Drag and drop the TSI from the Navigator onto your chart.
Pro Tip: If the TSI lines look “flat” or squeezed in MT4, right-click the indicator → Properties → Common tab → Ensure “Fixed Minimum” and “Fixed Maximum” are UNCHECKED.
9. Frequently asked questions
10. Summary
Mastering the True Strength Index TSI is not about memorizing a complex calculation but about understanding its role as a powerful momentum filter. By interpreting its centerline crossovers, divergence signals, and overbought/oversold levels, traders can gain a significant edge in identifying trend strength and potential reversals.
The TSI is a fantastic tool, but it’s just one piece of a complete trading system. To build a robust strategy, it’s essential to understand how other tools work. We encourage you to continue your learning journey by exploring our technical indicators list in the Learn Forex category on Piprider.


