
The 80/20 pattern is a powerful probability rule in price action that helps traders predict whether a price move will result in a strong breakout or simply reverse back into a range. Understanding the 80 20 pattern, which is rooted in the famous Pareto principle, allows you to filter market noise, avoid traps, and enter trades at the most logical moments.
This guide explains how to use this concept to improve your trading strategy and overall performance.
Key Takeaways
- The 80/20 pattern suggests that 80% of breakouts from a trading range will fail, causing the price to reverse.
- It is highly effective when used in supply-demand zones, liquidity zones, and consolidation ranges.
- Traders use it to forecast false breakouts, liquidity sweeps, and genuine momentum shifts.
- For higher accuracy, combine this pattern with volume flow, ATR, EMA, and Fair Value Gaps (FVG).
- While effective on all timeframes, it produces the most reliable signals on the H1 and H4 charts.
1. What Is the 80 20 Pattern in Trading?
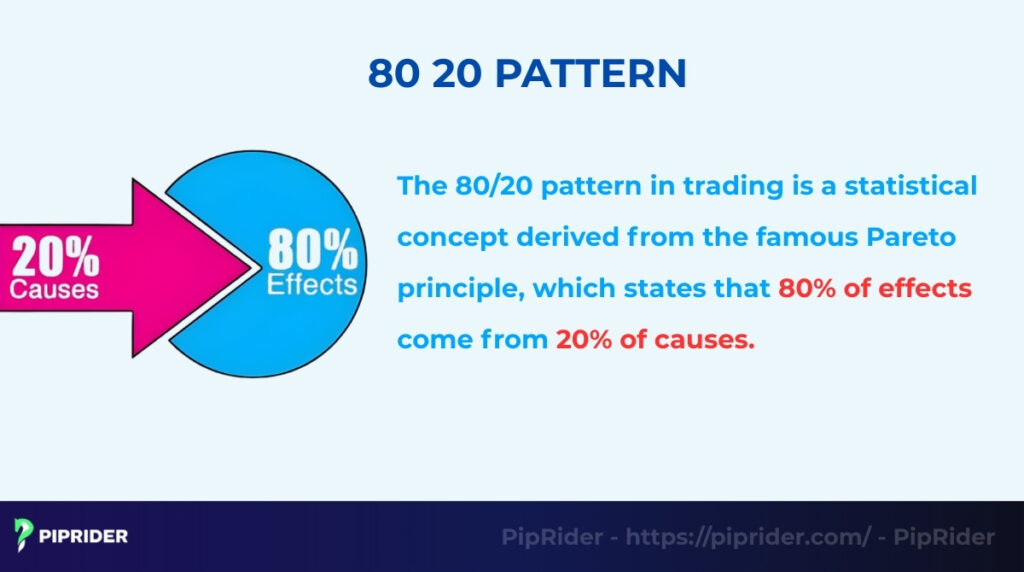
The 80/20 pattern in trading is a statistical concept derived from the famous Pareto principle, which states that 80% of effects come from 20% of causes. However, in the context of price action and technical analysis, traders apply this rule specifically to market volatility and breakouts.
According to price action experts like Linda Raschke and Al Brooks, the 80/20 rule suggests that a breakout attempt will likely fail when the market is in a consolidation range (Brooks, 2009). This failure has roughly an 80% probability and causes the price to reverse back into the range. Only about 20% of breakouts successfully start a new trend.
To understand why this works, we must look at its origin. This concept describes a power law distribution found everywhere. Originally observed in wealth distribution and income dynamics, it applies to almost any field involving management and efficiency.
- General Application: In business quality control, 20% of defects cause 80% of problems. In medicine, a few chronic conditions drive the majority of healthcare costs. In time management, 20% of your efforts yield 80% of your outcomes.
- Trading Application: In the markets, the “trivial many” attempts to break out usually fail, while the vital few successful breakouts are the true drivers of the trend.
What It Means for Traders:
This pattern helps you identify market sentiment at critical boundaries. Instead of chasing every move, you understand that most initial inputs (breakout attempts) result in trapped traders. Understanding this probability helps you trade the reversal (the 80% chance) rather than getting caught in a false breakout.
2. How the 80/20 Rule Works in Market Structure
The 80/20 rule works by identifying the psychological tipping points in market structure. It relies on three core mechanisms: the tendency of price to reverse at range boundaries, the institutional need to sweep liquidity (false breakouts), and the cycle of compression versus expansion.
2.1. Price Behavior Near Range Boundaries
Markets spend a significant amount of time consolidating. When the price approaches the upper or lower boundary of a range, it enters a critical decision zone. Proper analysis of this zone is key. If the breakout attempt is weak (characterized by low volume or small candles), the 80/20 rule suggests the price will likely reject the boundary and return to the middle of the range.
2.2. False Breakouts and Liquidity Sweeps
Smart money often pushes price just outside a range to trigger stop losses from retail traders. This is known as a “liquidity sweep.” The 80 20 pattern helps you spot these traps. If price breaks a high but immediately falls back inside, it confirms that the breakout was a trap to gather liquidity.
2.3. Compression vs. Expansion
It is important to remember the “20%” part of the rule. While 80% of breakouts fail, the remaining 20% are powerful trend starters. These usually happen after a period of compression, where the price coils tightly.
This build-up of energy is one of the main causes of the explosive move that follows. Identifying the difference between a “loose” range (likely to reverse) and a “tight” coil (likely to break out) is key to finding real price movements.
3. What Are the Types of 80/20 (Pareto principle) Scenarios?
Traders will typically encounter three main scenarios when analyzing this pattern. Identifying which scenario is playing out allows you to predict the likely outcomes, whether the price will reverse or continue trending.
Here is a quick comparison of the three types:
| Pattern Type | Market Bias | What Happens |
| Breakdown Failure | Bullish (Buy) | Price breaks a low, fails, and reverses up. |
| Breakout Failure | Bearish (Sell) | Price breaks a high, fails, and reverses down. |
| Continuation | Momentum (Follow) | Price breaks with volume and stays outside the range. |
3.1. What Is a Breakdown Failure (Bullish Setup)?
A breakdown failure is a bullish reversal pattern that occurs when sellers attempt to push the price below a key support level or the previous day’s low.
Signal: The price dips below the low but cannot maintain the downward momentum. Instead of dropping further, it quickly reverses up and closes back inside the previous trading range. This indicates that sellers are exhausted and buyers are taking over.
3.2. What Is a Breakout Failure (Bearish Setup)?
A breakout failure is a bearish reversal pattern where buyers manage to push the price above a resistance level or the previous day’s high.
Signal: The price breaks the high but is immediately rejected. It closes back down inside the range, often leaving a long wick at the top. This “fakeout” suggests the bulls are weak, and a move back to the bottom of the range is likely.
3.3. What Is the 80/20 Continuation Pattern?
The continuation pattern is the rare (20% probability) scenario where the breakout is legitimate.
Signal: The price breaks the range boundary with a massive candle and high volume, and crucially, it does not return to the range. This signals a momentum shift, meaning the market has moved from a consolidation phase to a trending phase.
4. How to Identify the 80 20 Pattern (Step-by-Step)
Identifying this pattern is a structured 5-step process requiring attention to detail. It involves marking the consolidation range, closely watching price action at the extremes, confirming the breakout’s strength, spotting rejection candles, and finally validating the move with volume.
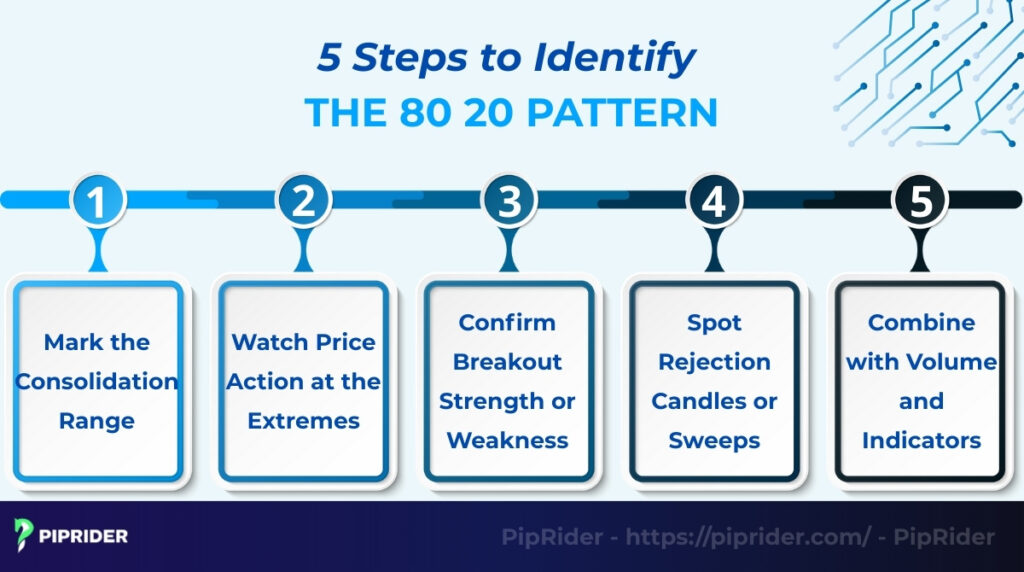
4.1. Step 1: Mark the Consolidation Range
Start by scanning for a market that is moving sideways, not trending. You need to identify a clear “box” structure. Look for at least two similar highs and two similar lows. Draw horizontal lines across these points to clearly define your Resistance (top) and Support (bottom).
4.2. Step 2: Watch Price Action at the Extremes
Once the range is defined, you must be patient. Focus your attention only when the price reaches the top 20% or bottom 20% of that range. Do not trade in the middle of the box, as that is just noise. You must wait for the price to push into these “extreme zones” where retail traders often get trapped chasing moves.
4.3. Step 3: Confirm Breakout Strength or Weakness
Analyze the momentum as price hits the edge. Are the candles getting smaller and overlapping (indicating weakness)? Or are they large and aggressive (indicating strength)? Weakness at the boundary suggests an 80/20 reversal is forming.
4.4. Step 4: Spot Rejection Candles or Sweeps
Look for specific technical analysis patterns like pin bars, dojis, or engulfing candles that reject the boundary. A long wick sticking out of the range and snapping back in is the classic visual sign of a liquidity sweep.
4.5. Step 5: Combine with Volume and Indicators
Finally, check your volume. A breakout attempt on low volume is highly likely to fail (confirming the 80% probability of reversal). Conversely, a breakout on explosive volume might indicate a real trend change (the 20% scenario).
5. How Do You Trade the 80/20 Pattern?
Once the setup is identified, execution requires a clear plan. Strategies include fading the breakout (trading the reversal) or trading the momentum breakout (the 20% case), supported by precise stop loss placement and defined take profit targets.
5.1. Strategy 1: Fade the Breakout (Most Common)
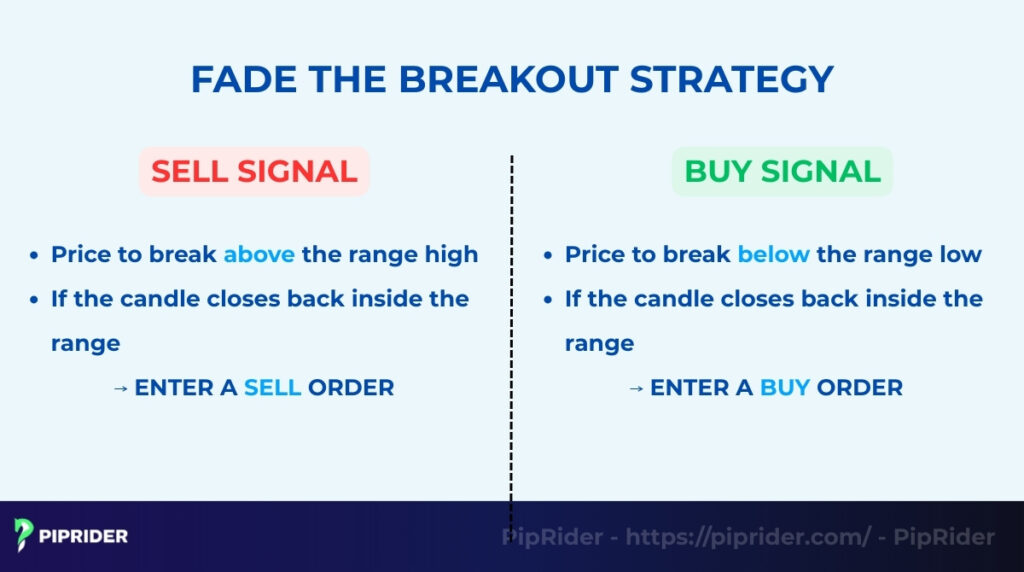
“Fading” means trading against the initial move. This is the primary strategy for applying the rule in trading because it aligns with the statistical probability that most breakouts fail.
- Sell Signal: Wait for the price to break above the range high. If the candle closes back inside the range (leaving a wick), enter a sell order.
- Buy Signal: Wait for the price to break below the range low. If the candle closes back inside the range, enter a buy order.
5.2. Strategy 2: Momentum Breakout (20% Cases)
Sometimes, the market genuinely wants to trend. Trading the breakout captures the 20% of times the price successfully leaves the range.
- Entry: Do not fade if the breakout candle is massive and closes far outside the range. Instead, look for high volume and a large body. You can enter on a “follow-through” candle that breaks the high of the breakout candle.
5.3. Stop Loss Placement
Precise risk management is the only way to survive false signals in the long run.
- For reversals: Place your stop loss just beyond the “tail” (the highest/lowest wick) of the failed breakout candle. If the price pushes past that wick, the reversal setup is invalid, and you should exit immediately.
- Using ATR: Alternatively, calculate the Average True Range (ATR) and place your stop 1.5x ATR away from your entry. This method creates a “buffer” to account for normal market volatility.
5.4. Take Profit Targets
Professional traders often “scale out” of their positions (close parts of the trade) to lock in money as the trade progresses.
- TP1 (Mid-Range): Close half your position when the price reaches the 50% (middle) of the trading range. This ensures you bank some profit even if the price reverses.
- TP2 (Opposite Range): Close more when the price hits the opposite boundary (e.g., if you sold the top, your target is the bottom support).
- TP3 (Measured Move): If the trade turns into a trend and breaks out of the range completely, aim for a target equal to the height of the range projected forward.
6. Which Indicators Best Confirm the 80/20 Pattern?
While the 80/20 pattern is based on price action, using indicators provides the necessary “confluence” to filter out low-quality setups. Think of these tools as a form of quality control for your trade signals, helping you verify if a breakout is real or just a trap.
- Volume & On-Balance Volume (OBV): Volume acts as the ultimate lie detector. If price breaks a range boundary but volume is low or decreasing, it confirms the 80% probability that the move is false and will reverse. Conversely, a massive spike in volume suggests a real breakout (the 20% scenario).
- Average True Range (ATR): This tool measures volatility to see if a move is “overextended.” If the price pushes to the edge of a range and has already exceeded its average daily range, it is statistically exhausted. This increases the probability of an 80/20 reversal back to the center.
- Moving Averages (EMA 20/50): Use these to determine the trend bias. A high-probability setup involves trading an 80/20 reversal back towards the 20 or 50-period EMA. For example, in an uptrend, if price dips below a short-term support range, buying that “false breakdown” back towards the rising EMA is a classic strategy.
- RSI or Stochastic: Oscillators are perfect for trading ranges. When price hits the top 20% of the range, look for the RSI to be overbought (above 70) or showing bearish divergence. This technical signal aligns with the 80/20 concept that the price is too expensive and due for a rotation down.
7. What Do Real Chart Examples Look Like? (FX, Indices, Crypto)
Seeing the pattern in action is the best way to learn. Here are three common scenarios across different markets, showing both the 80% reversal and the 20% breakout.
7.1. EURUSD Range 80/20 Reversal Setup
Currency pairs often move sideways, making them perfect for this strategy. On the 1-Hour chart, EURUSD might form a clear “box” during the quiet Asian session.
When the London session opens, the price suddenly drops below the Asian low, enticing breakout traders to sell.
However, the 80/20 signal appears when that candle fails to close below support and immediately reverses back inside the box. A trader would buy this “false breakdown,” targeting the top of the range.
7.2. NAS100 False Breakout + Liquidity Sweep
Indices like the NAS100 (Nasdaq) are famous for “hunting” stop losses. In this scenario, the index approaches the previous day’s high, a level where many stop-loss orders sit.
Price spikes aggressively above the high but fails to hold it, leaving a long wick (tail). This confirms a “Liquidity Sweep.”
Instead of buying the breakout, a smart trader recognizes the 80/20 failure and sells, betting on a move back down.
7.3. BTC Consolidation & The “20%” Breakout
Bitcoin often consolidates for weeks before a massive move. This example illustrates the rare 20% continuation scenario. Bitcoin (BTC) might coil into a very tight range with declining volume.
Suddenly, a massive green candle breaks through resistance. Unlike the previous examples, this breakout has explosive volume and closes near its high, far outside the range.
This is not a trap; it is a valid trend start. Traders buy the breakout, expecting a long trend run.
8. How Is the 80/20 Pattern Different from Similar Concepts?
Many traders get confused because different methodologies use different names for the exact same price behavior. The 80/20 pattern is essentially a statistical way of describing market mechanics that other systems also identify.
Here is how they relate to each other:
| Concept | Focus | Relationship to 80/20 |
| False Breakout | The Action | It is the same thing. 80/20 adds a statistical probability to it. |
| Liquidity Grab | The Intent | Explains why the 80/20 reversal happens (to hunt stops). |
| Order Block | The Location | Explains where the 80/20 reversal happens (at institutional zones). |
8.1. Is the 80/20 Pattern Just a False Breakout?
Fundamentally, yes. A “false breakout” is the general technical term for a price breaking a level and failing. The 80/20 rule simply quantifies this behavior, reminding traders that statistically, 80% of these breakout attempts will fail. This turns a random observation into a probability-based strategy.
8.2. How Does 80/20 Compare to an ICT Liquidity Grab?
While the 80/20 rule describes what happens (price reverses), the ICT concept of a “liquidity grab” explains why it happens. Smart money pushes price to the edge of the range specifically to trigger retail stop losses. An 80/20 trader sees a reversal pattern; an ICT trader sees institutions “fueling up” their position.
8.3. What Is the Link Between 80/20 and Order Blocks?
This comparison focuses on causes and effects. Price often respects the 80/20 rule at the edge of a range because it has hit an order block (a pile of institutional limit orders). The order block acts as the concrete wall that causes the price to bounce back into the range, creating the visual 80 20 pattern on the chart.
9. What Are Common Mistakes When Trading the 80/20 Pattern?
Even with a statistical edge, traders often lose money by misidentifying the setup or managing risk poorly. Avoiding these specific traps through better prioritization of high-quality setups is just as important as finding the pattern.
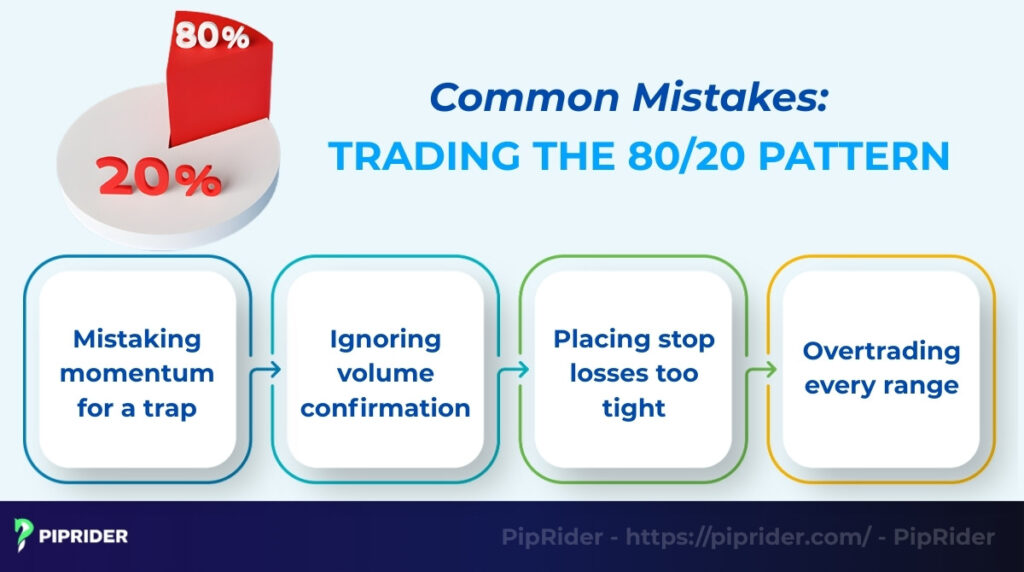
- Mistaking momentum for a trap: Not every breakout fails. A common error is trying to “fade” (bet against) a breakout that has massive momentum and huge candles. If the price closes far outside the range with strength, do not stand in front of it. Fighting this momentum is one of the leading causes of trading losses.
- Ignoring volume confirmation: Volume acts as the ultimate “lie detector.” Attempting to trade an 80/20 reversal without checking volume is risky. Remember: low volume suggests a trap; high volume suggests a real breakout.
- Placing stop losses too tight: Since this pattern relies on volatility and “stop hunts,” placing your stop loss exactly at the range edge is a mistake. You must give the trade “breathing room” (using ATR or the wick tail) to avoid being swept out just before the reversal happens.
- Overtrading every range: Not every consolidation creates a valid 80/20 setup. Beginners often force trades in messy, undefined ranges. You should only trade when the range boundaries are clear and the rejection signal is obvious.
10. What Tools Can Help You Detect the 80/20 Pattern?
Manually drawing ranges on every chart can be time-consuming. Fortunately, modern trading platforms offer specific tools and scanners to automate this efficiency process.
- TradingView range scripts: The TradingView community library offers thousands of free Pine Script indicators. You can search for “Range Detector” or “Previous Day High/Low” to automatically plot the boundaries where the 80/20 pattern is most likely to occur.
- MT4 range indicators: For MetaTrader 4 users, custom indicators like “High-Low Boxes” or “Session Breakout” tools are essential. These visually highlight the consolidation zones on your chart, allowing you to spot the 20% extremes instantly.
- TrendSpider consolidation scanner: This AI-powered platform allows you to scan the entire market for “Tight Consolidations” or “Squeezes.” It finds stocks that are currently coiling, alerting you before the breakout or reversal happens so you don’t have to watch the screen all day.
11. Frequently asked questions about the 80/20 Pattern Trading
Traders often ask about the reliability of this pattern across different markets and timeframes. Here are the answers to the most common questions.
12. Conclusion
The 80 20 pattern states that 80% of breakout attempts statistically fail in a consolidation or trading range. Its primary purpose is to shift a trader’s focus from chasing price to patiently waiting for a reversal entry after the initial failure.
However, no pattern is perfect. To achieve the best outcomes, you should always combine the 80/20 rule with volume analysis, ATR, and EMA confirmation. Identify the vital few setups that meet all your criteria, and ignore the rest. Ready to master more price action secrets? Explore the expert trading guides and trading strategies at Piprider today.


