Is the volume supporting the price trend? The Chaikin Money Flow indicator (CMF), developed by famed analyst Marc Chaikin, is a volume-weighted oscillator designed to answer this critical question. It measures the amount of money flowing into or out of an asset over a specific period and provides insight into the underlying buying and selling pressure.
This guide breaks down the CMF formula, its key signals, and practical chaikin algorithm trading strategies.
Key Takeaways
- An oscillator that measures buying and selling pressure by combining an asset’s closing price position with its volume.
- A positive CMF value (above the zero line) indicates buying pressure, while a negative value signals selling pressure.
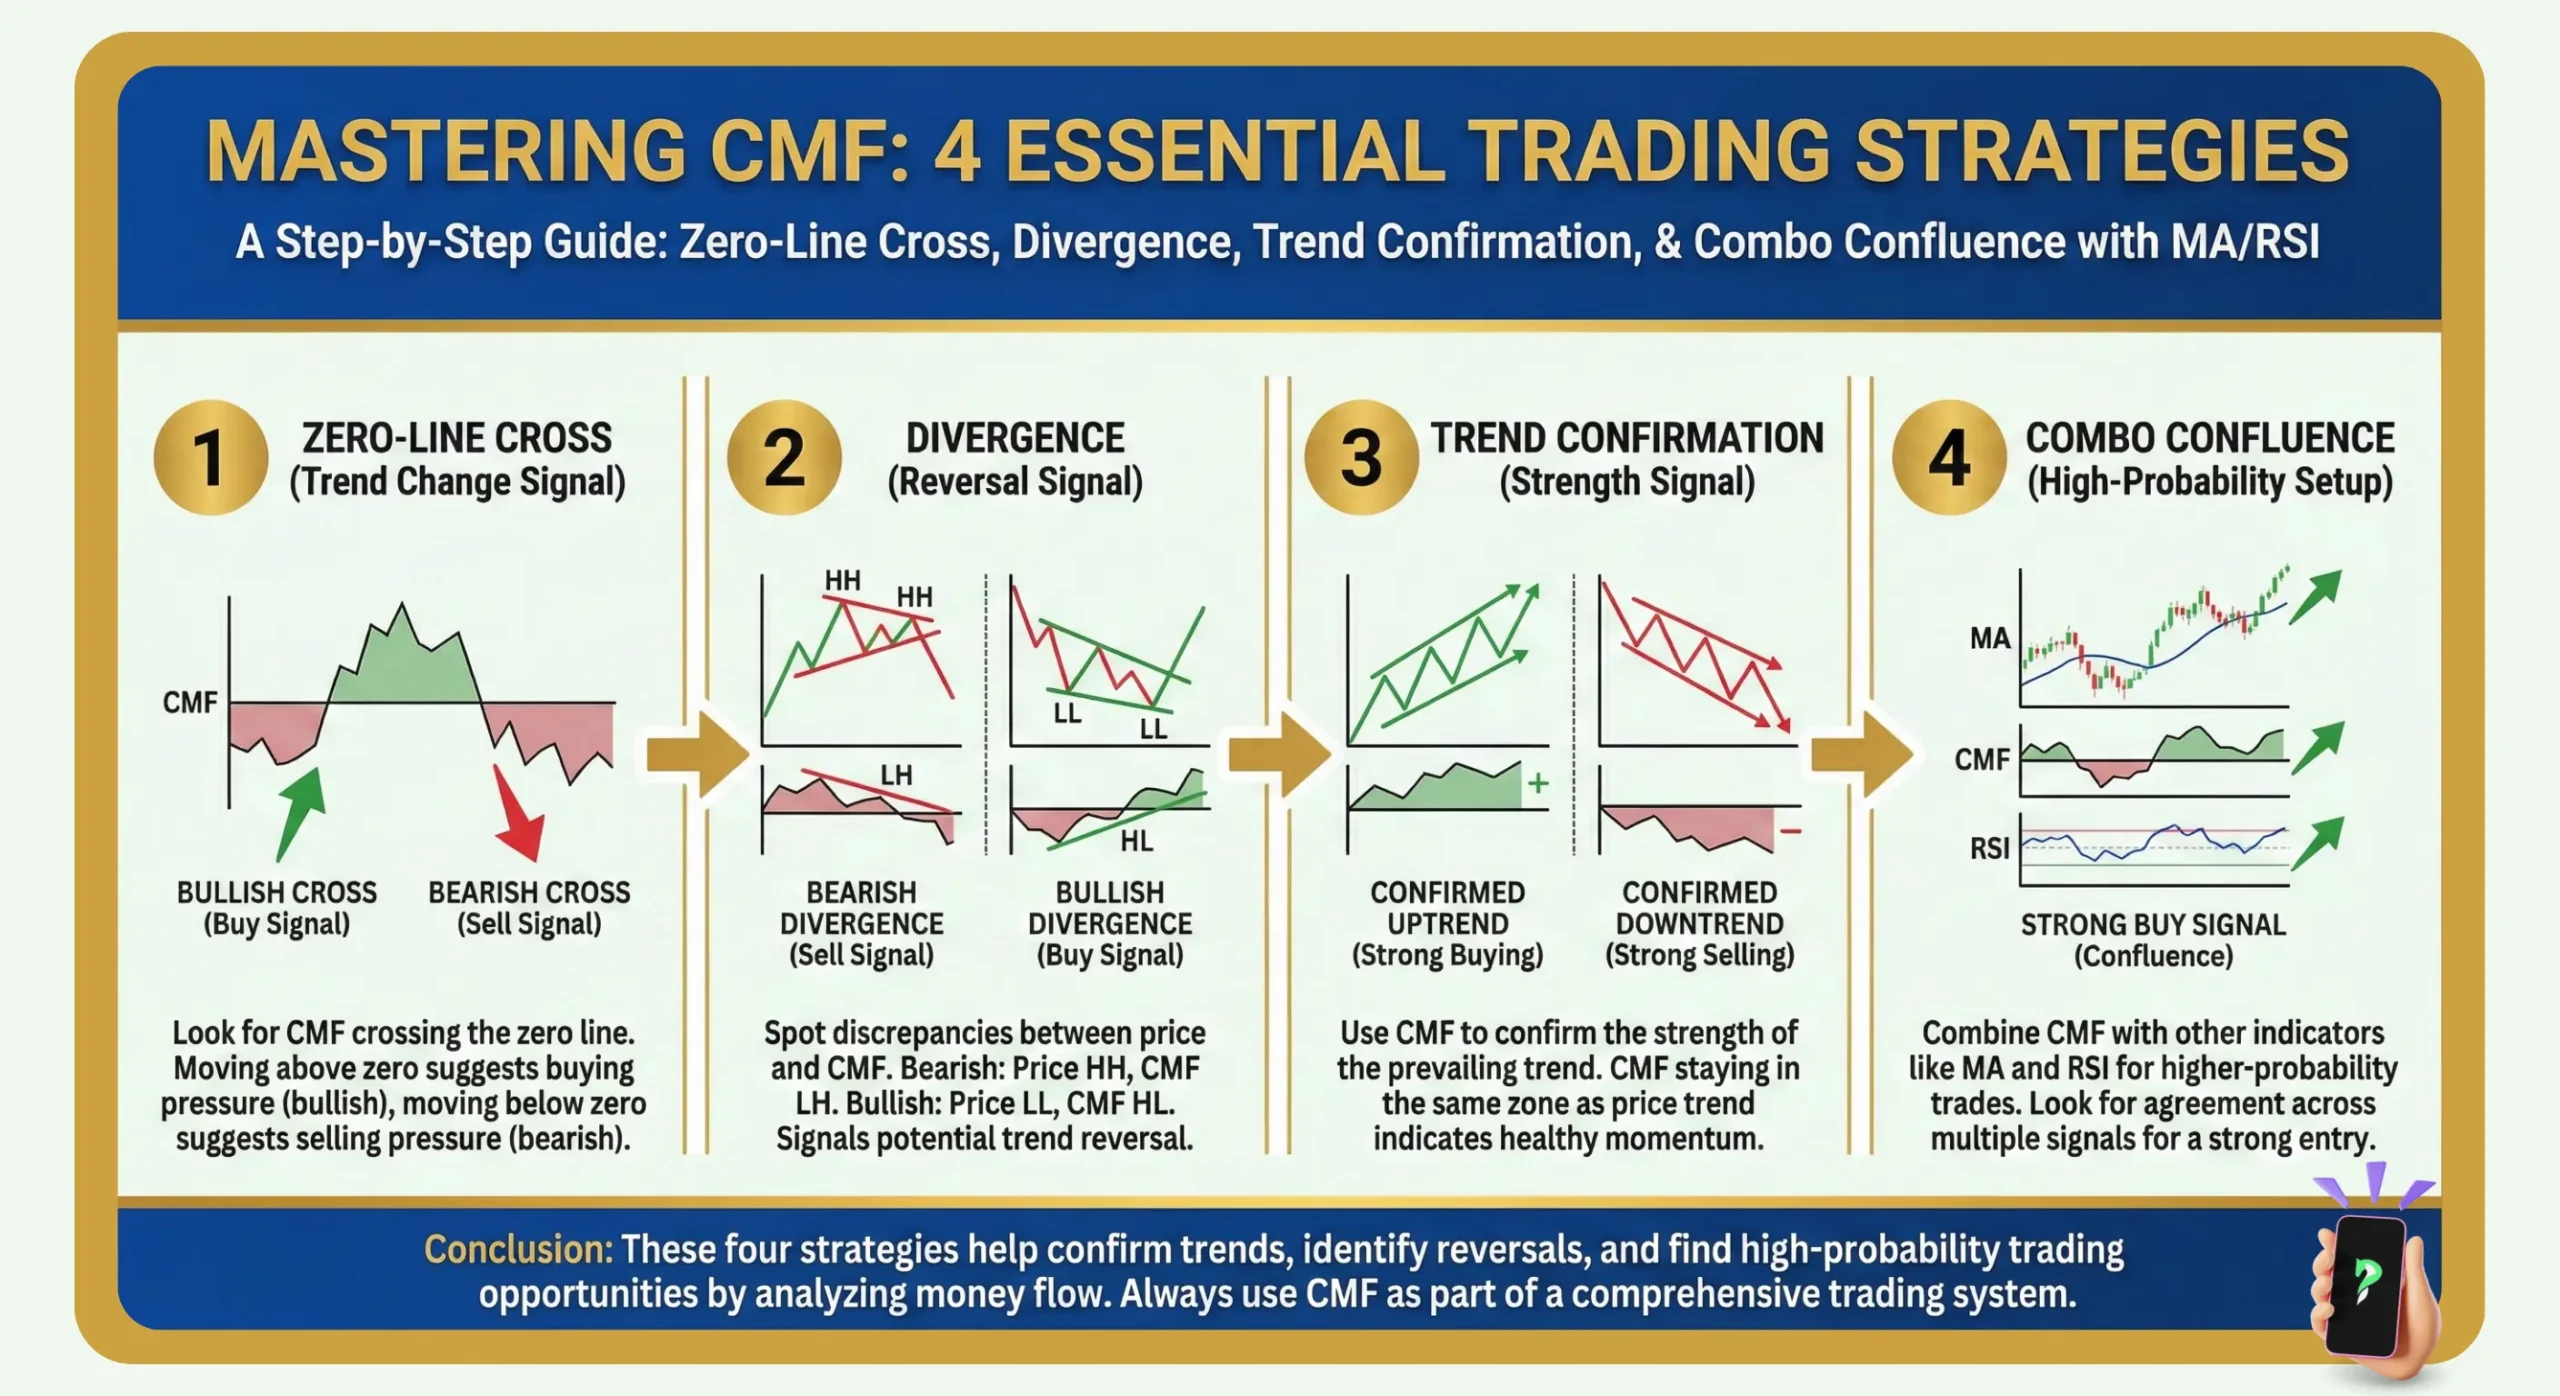
- Traders use zero-line crossovers for trend confirmation and divergences to spot potential reversals before they happen.
- The chaikin money flow oscillator can generate false signals (whipsaws) in choppy or non-trending markets.
- It works best when combined with other indicators like moving averages or the RSI for signal confirmation.
1. What Is Chaikin Money Flow Indicator (CMF)?
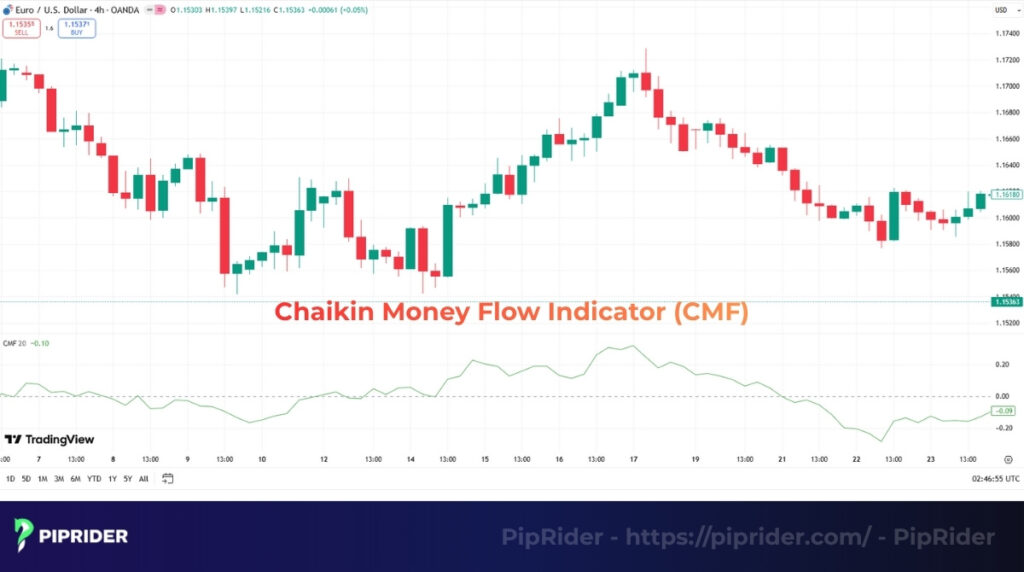
The Chaikin Money Flow (CMF) is a volume-weighted oscillator that measures the flow of money into or out of a security over a specific period. Developed in the late 1980s by renowned stock market analyst Marc Chaikin, it was created as an evolution of the cumulative Accumulation-Distribution (A/D) Line.
By oscillating between +1 and -1, the CMF simplifies money flow analysis and helps traders gauge the underlying buying and selling pressure that might not be obvious from price action alone.
Here’s the core logic:
- Core principle: High-volume closes near the top of a period’s range signal accumulation (buying pressure), while high-volume closes near the bottom signal distribution (selling pressure).
- Visual representation: A reading above the zero line indicates buying pressure is dominant, while a reading below zero shows selling pressure is in control.
- Main goal: Ultimately, the CMF’s purpose is to help traders answer a critical question: is the “smart money” confirming or contradicting the current price trend?
2. The Chaikin Money Flow Formula

The CMF’s formula is a three-step process that quantifies buying and selling pressure for each period and then averages it out to create a smooth oscillator line.
2.1. CMF Formula
The complete formula for the Chaikin Money Flow is:
Where ‘n’ is the look-back period. The most common setting for this period, as recommended by Marc Chaikin, is 20 or 21 days.
2.2. Step-by-Step Calculation
Here’s a breakdown of how that final value is derived:
Step 1: Calculate the Money Flow Multiplier (MFM)
First, the formula determines where the closing price landed within the period’s high-low range. A close near the high results in a positive multiplier, while a close near the low results in a negative one.
Step 2: Calculate the Money Flow Volume (MFV)
Next, the multiplier is multiplied by the volume for that period to determine the amount of money flow.
Step 3: Calculate the Final CMF Value
Finally, the indicator sums up the Money Flow Volume for the chosen period (e.g., 20 days) and divides it by the sum of all volume over that same period. This gives you the final CMF oscillator value.
3. The Core Logic: Closing Position vs. Volume Conviction
To truly master the Chaikin Money Flow, traders must look beyond the formula and understand the market psychology it represents. The CMF is built on the critical relationship between where a candle closes within its daily range and the volume that drove it there.
It evaluates “Smart Money” footprints through a two-part logical sequence:
3.1. The Location of the Close (Who won the battle?)
Unlike standard indicators that only care if a candle is green or red (Close vs. Open), the CMF focuses on the Close vs. the High-Low Range. This determines the Money Flow Multiplier (MFM).
- Closing near the High (Accumulation): Even if the market opened lower, if buyers manage to push the price up and close it near the absolute high of the session, they have decisively won the battle. The CMF assigns this a positive multiplier.
- Closing near the Low (Distribution): If sellers overwhelm buyers and force the price to close near the bottom of the session’s range, it signals distribution, resulting in a negative multiplier.
- Expert Insight: A candle can be technically “Green” (closing higher than it opened), but if it has a massive upper wick and closes near its low, the CMF will correctly read this as bearish selling pressure, exposing a trap that traditional volume bars often miss.
3.2. Volume as the “Conviction Amplifier”
Once the indicator determines who won the session (via the close), it uses volume to determine how much capital backed the winner.
- High Volume + Close near High: This is the ultimate signal of Institutional Accumulation. Large players are aggressively buying and absorbing all sell orders, pushing the CMF line sharply higher.
- Low Volume + Close near High: If the price closes near the high but volume is extremely low, it means the move was driven by a lack of liquidity rather than real buying power. The CMF automatically gives this session a very low weight, preventing “retail noise” from generating a false buy signal.
Forex & Crypto Reality Check: In centralized stock markets, this volume is literal shares traded. In the decentralized Spot FX market, which processes a staggering $9.6 trillion in daily turnover according to the 2025 Bank for International Settlements (BIS) survey, the CMF utilizes Tick Volume (proxy) to measure the frequency of price changes. In Crypto, the CMF is only as reliable as your exchange’s data feed, which is why it performs best on high-liquidity pairs like BTC/USD on major centralized exchanges.
4. What the Chaikin Money Flow Tells You
The interpretation of Chaikin Money Flow provides three distinct indication types that traders use to spot potential trading opportunities: the direction of money flow, divergences, and zero-line crossovers.
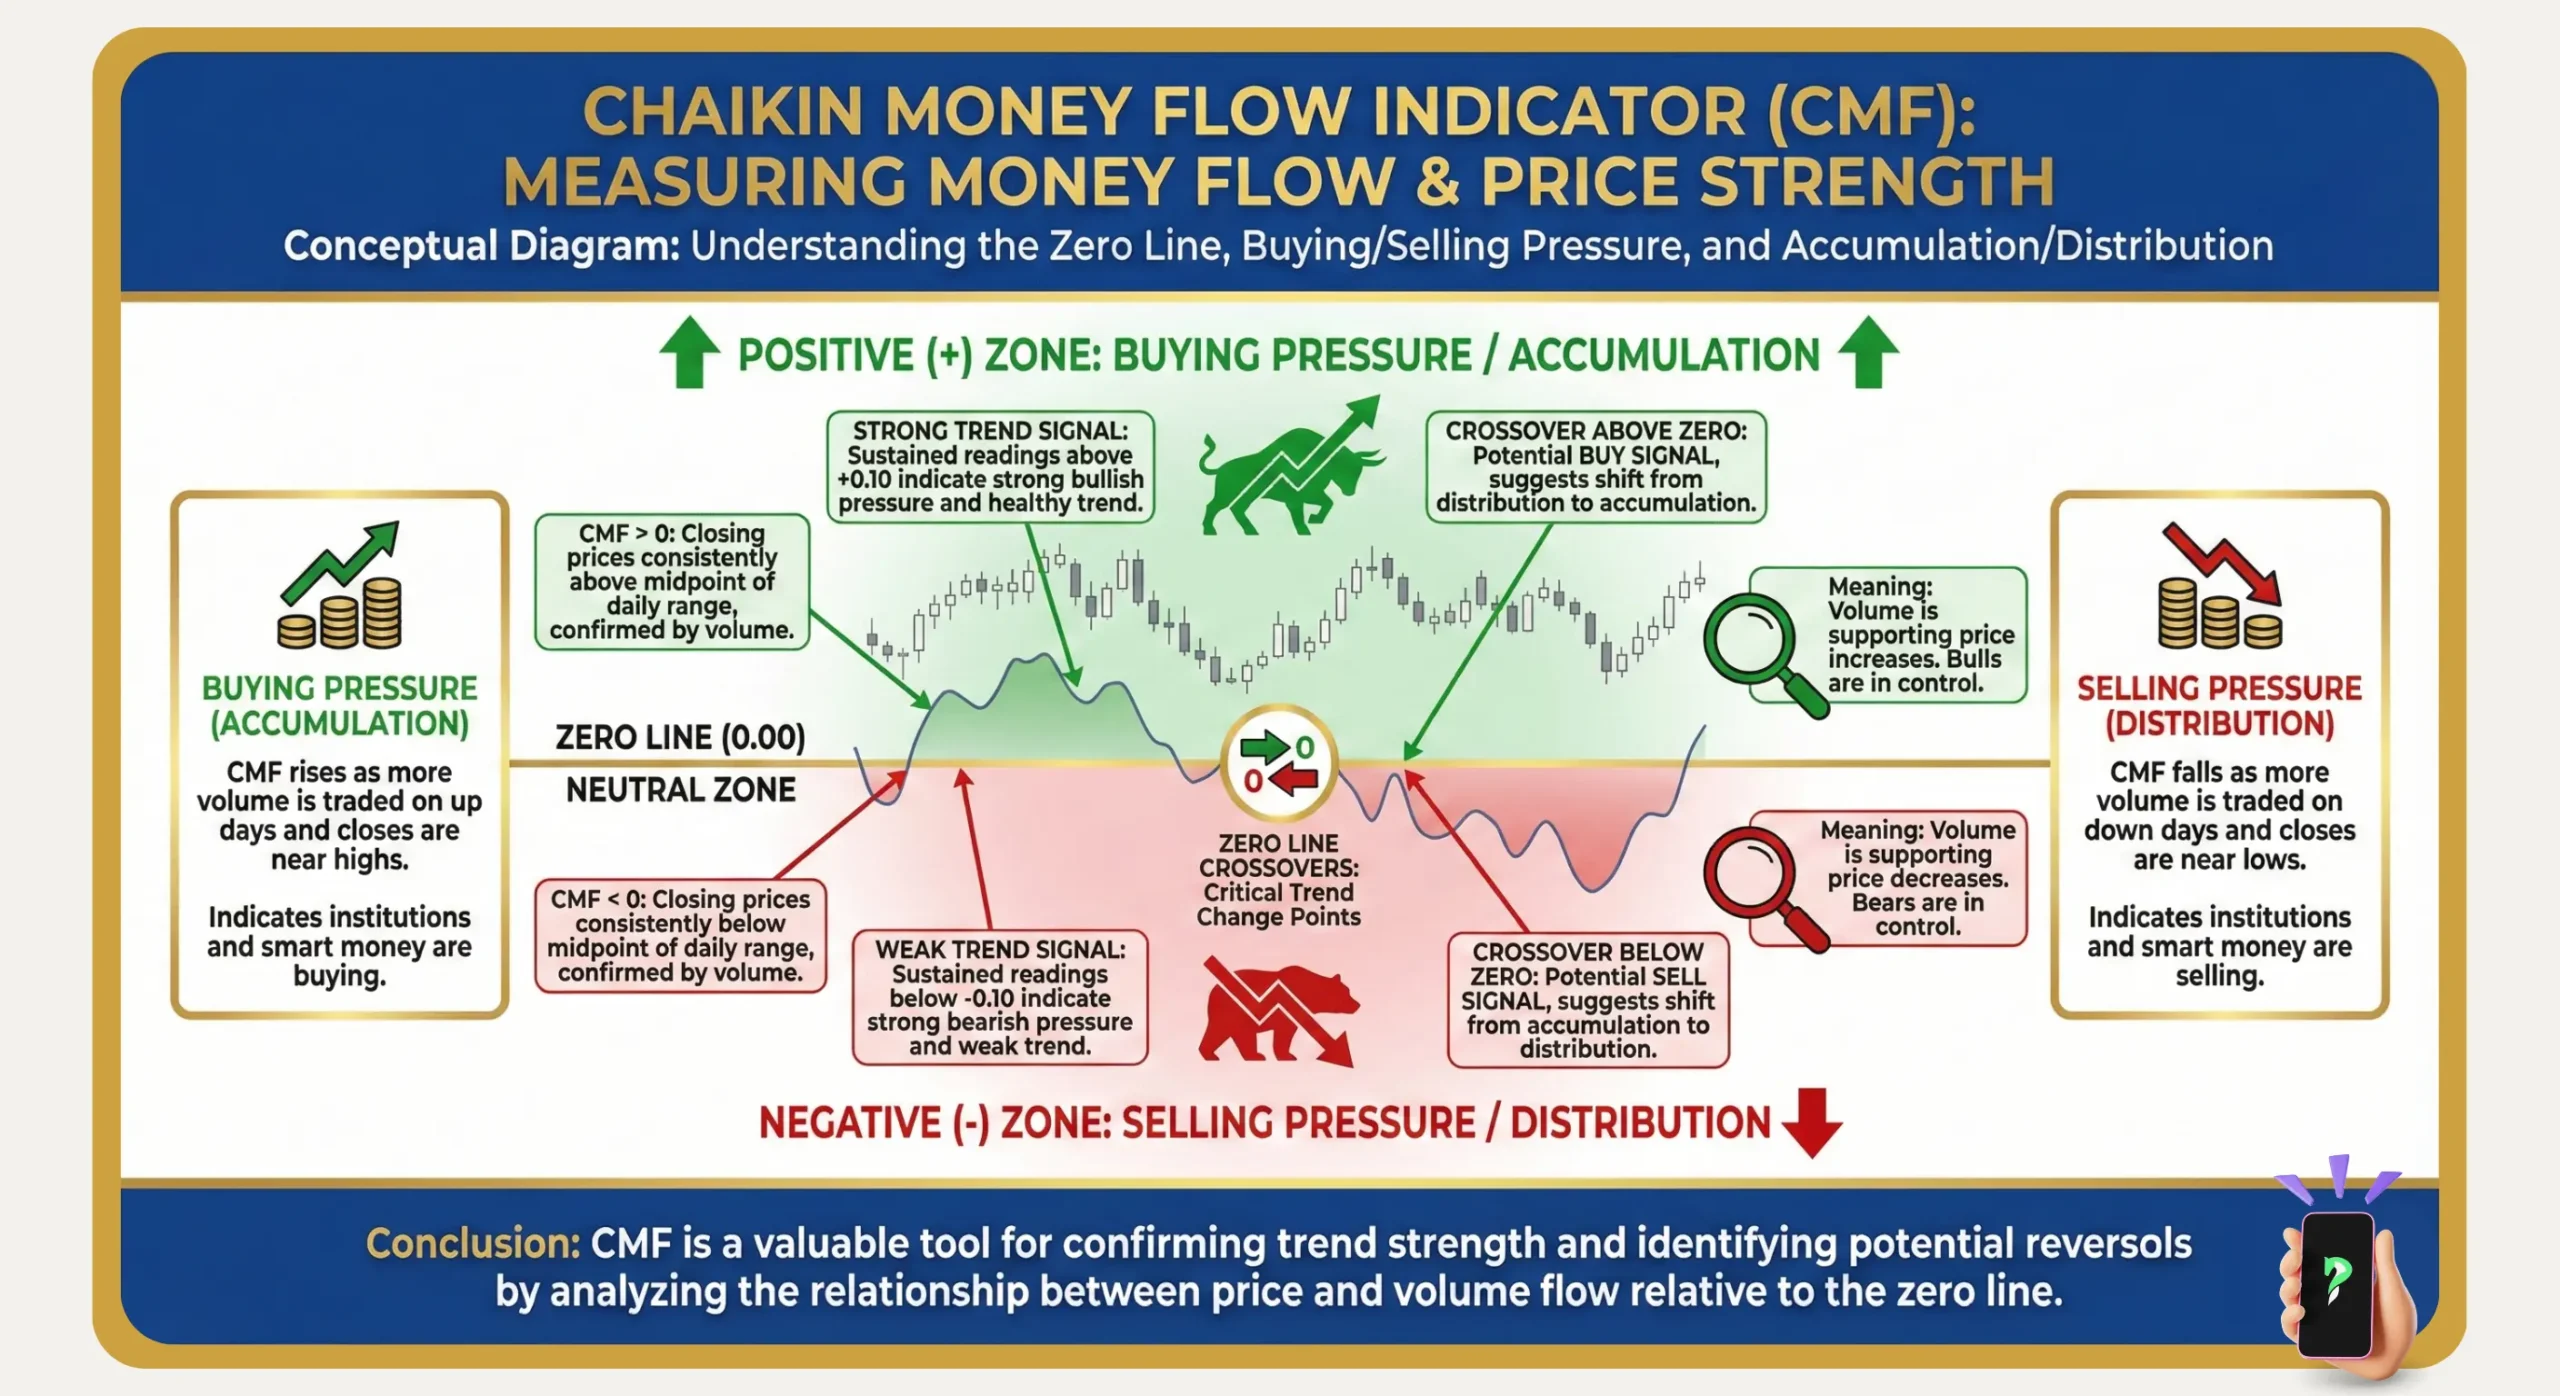
4.1. Positive vs. Negative Values
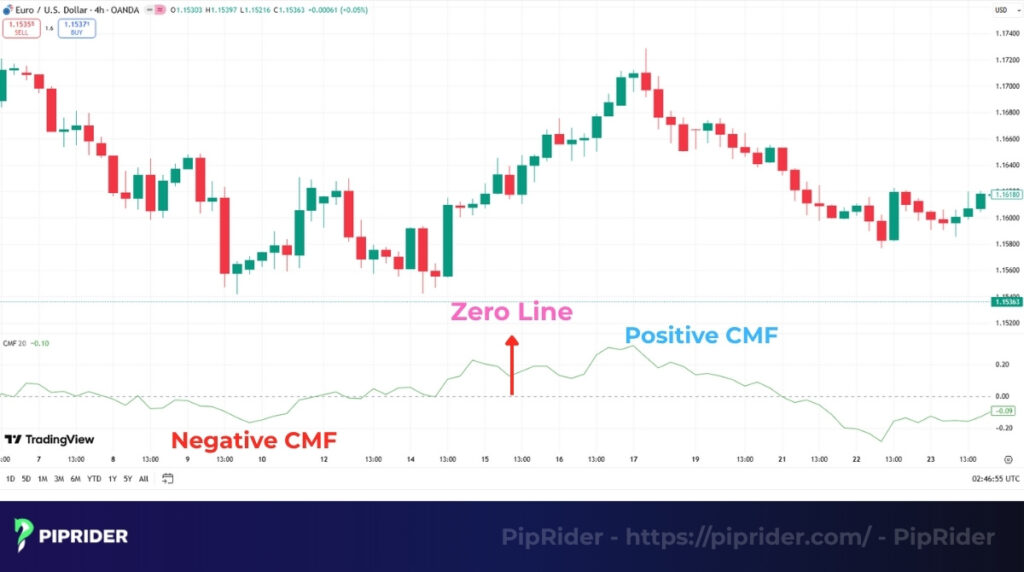
The indicator’s position relative to the central zero line is the most fundamental signal. It provides an immediate reading of the dominant pressure in the market.
- A positive CMF (above 0) indicates that buying pressure is in control, suggesting a bullish sentiment.
- A negative CMF (below 0) indicates that selling pressure is dominant, suggesting a bearish sentiment.
4.2. Divergences
Divergences are powerful warnings that occur when the CMF indicator disagrees with the price action. They often provide an early warning that a trend is losing its underlying momentum.
- A bearish divergence occurs when the price makes a new high, but the CMF fails to do so, making a lower high instead. This is a red flag that the uptrend is weakening and may soon reverse.
- A bullish divergence occurs when the price makes a new low, but the CMF forms a higher low. This suggests that selling pressure is easing, and a bullish reversal could be imminent.
4.3. Zero Line Crossovers
Crossovers of the zero line are used as direct confirmation signals for a shift in money flow, often providing potential entry and exit triggers.
- A bullish crossover happens when the CMF crosses from negative to positive territory. This is interpreted as a buy signal, confirming that money is now flowing into the asset.
- A bearish crossover happens when the CMF crosses from positive to negative. This is a sell signal, confirming that money is flowing out.
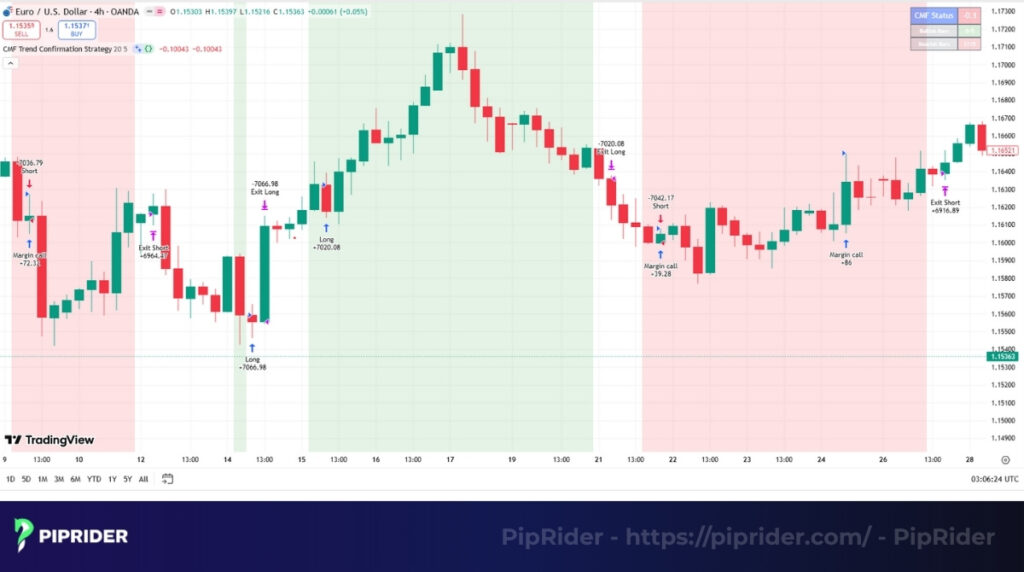
4.4. Trend Confirmation (Gauging Trend Health)
While a zero-line crossover provides the initial entry signal, the true power of the CMF lies in its ability to confirm the ongoing health of an established trend.
- Healthy Uptrend: In a robust, institutionally backed uptrend, the CMF shouldn’t just cross above zero; it should stay pinned in positive territory (ideally holding above the +0.10 to +0.25 threshold). If the price makes higher highs but the CMF keeps dipping back below zero, the trend is running on retail FOMO and lacks genuine buying pressure.
- Healthy Downtrend: Conversely, a sustainable downtrend is confirmed when the CMF remains consistently anchored below the zero line (e.g., holding below -0.10). This sustained negative reading proves that sellers are aggressively distributing on every minor pullback.
5. Market Context: The Best Conditions to Use CMF
The Chaikin Money Flow is highly sensitive to the surrounding market environment. Using it in the wrong context will result in false signals and capital drain. To maximize accuracy, professionals only deploy the CMF under specific market conditions.
- High-Liquidity Markets (Major FX Pairs & Large Caps): The CMF thrives in deep, liquid markets like Major Forex pairs (EUR/USD, GBP/USD) and major cryptocurrencies. In these environments, volume data (or the tick volume proxy) is thick and consistent, making institutional accumulation/distribution signals highly reliable. Avoid exotic FX pairs where erratic, low-volume spikes can distort the formula.
- Active Trending Environments: The indicator performs exceptionally well in markets with high directional momentum. When the price is making clear higher highs or lower lows, the CMF acts as a trend validator, staying pinned above or below the zero line to confirm that the move is backed by real capital.
- When to Avoid (Choppy & Ranging Markets): In low-volatility, sideways markets, the CMF becomes a liability. Without a clear directional bias, closing prices fluctuate randomly within the daily range, causing the CMF line to repeatedly chop back and forth across the zero line. This generates meaningless “whipsaw” signals. If the market is ranging, discard the CMF and switch to a bounded oscillator like the MFI or RSI.
6. Professional CMF Trading Strategies (The Execution Blueprint)
The Chaikin Money Flow is a confirmation tool, not a standalone signal generator. Professional traders always combine the CMF with price action structures, specifically Moving Averages, Support/Resistance zones, and Trend Lines, to build high-probability setups.
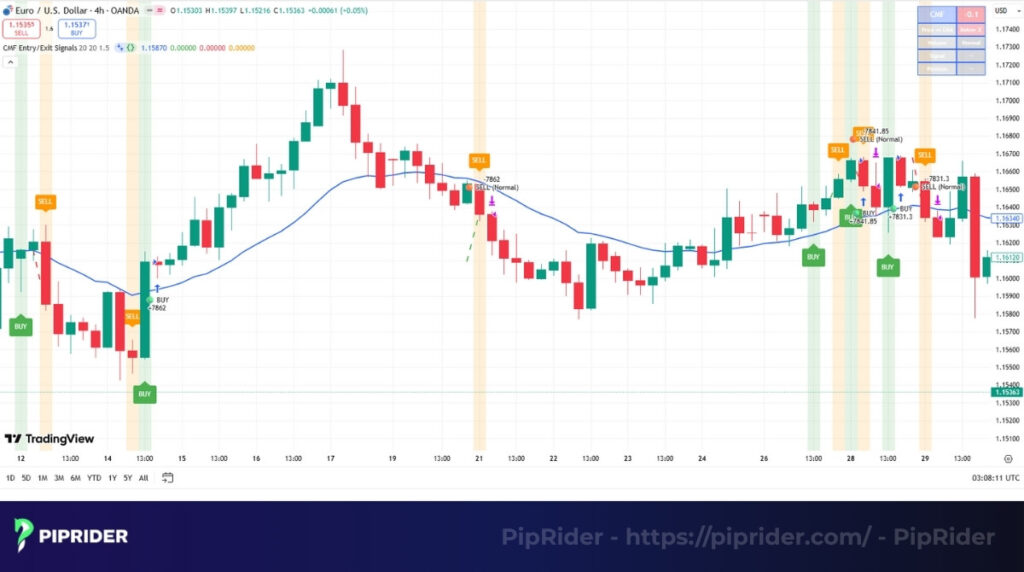
6.1. Trend Pullback Strategy (CMF + Moving Averages)
This strategy uses a Moving Average to define the macro trend and the CMF to confirm that institutional money is defending the pullback.
- The Setup: Apply a 50-period EMA to your chart. For a long setup, the price must be trending above the 50 EMA, and the CMF must be consistently positive (above 0).
- Entry (Trigger): Wait for the price to pull back and touch the 50 EMA. Crucial rule: The CMF must remain above the zero line (or briefly dip and immediately recover). Enter when a bullish reversal candle (like a Pin Bar) rejects the EMA.
- Stop Loss (SL): Place the SL just below the swing low of the pullback wick.
- Exit (TP): Target the previous swing high (recent peak).
- Fail Case (Invalidation): If the price touches the EMA but the CMF plunges deep into negative territory, institutional support has vanished. Abort the trade.
6.2. Breakout Confirmation Strategy (CMF + Support/Resistance)
False breakouts (fakeouts) are the biggest trap for retail traders. Combining CMF with horizontal Support/Resistance levels acts as a lie detector for breakout momentum.
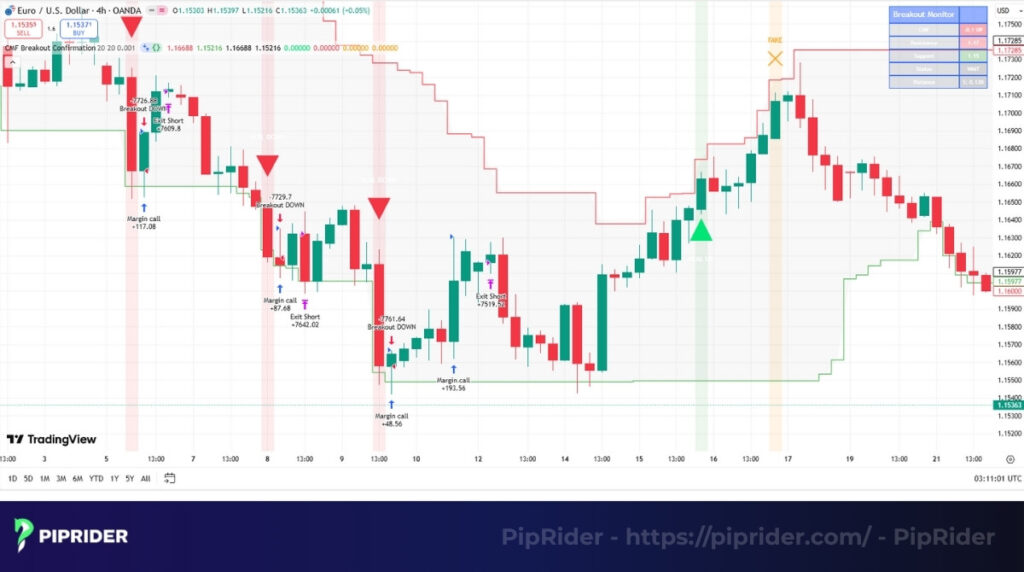
- The Setup: Identify a major horizontal Resistance level that the price has tested multiple times.
- Entry (Trigger): The price breaks and closes above the resistance level. Simultaneously, the CMF must surge significantly above the zero line, confirming that heavy buying volume is driving the breakout.
- Stop Loss (SL): Place the SL just below the breakout candle or the newly formed support level.
- Exit (TP): Target the next major historical liquidity zone on a higher timeframe.
- Fail Case (Invalidation): If the price breaks the resistance but the CMF is flat or trending downwards (divergence), it is a low-volume fakeout. Do not enter.
6.3. Trend Reversal Strategy (CMF + Trend Lines)
Diagonal trend lines are excellent for tracking momentum, and a trend line break combined with a CMF zero-line crossover provides a highly reliable reversal signal.
- The Setup: Draw a clear ascending trend line connecting at least three higher lows in an uptrend.
- Entry (Trigger): The price breaks and closes below the diagonal trend line. To confirm this isn’t a bear trap, the CMF must cross from positive to negative territory, indicating a definitive shift from accumulation to distribution.
- Stop Loss (SL): Place the SL above the most recent lower high formed just before the trend line break.
- Exit (TP): Trail your stop loss using a 20-period moving average to ride the newly formed downtrend.
- Fail Case (Invalidation): If the price breaks the trend line but the CMF refuses to cross below zero, the “Smart Money” is still holding. The price will likely consolidate rather than reverse.
6.4. CMF Divergence Strategy (Spotting Trend Exhaustion)
Trading divergences is arguably the most popular and powerful way professionals use the Chaikin Money Flow. It acts as an early warning system, highlighting the exact moment when “Smart Money” begins to quietly exit a trend while retail traders are still pushing the price to new extremes.
The Core Logic:
- Bearish Divergence: Price makes a Higher High (HH), but the CMF makes a Lower High (LH). Logic: Retail FOMO pushes the price up, but decreasing volume and weak closes indicate institutions are distributing (selling into the rally).
- Bullish Divergence: Price makes a Lower Low (LL), but the CMF makes a Higher Low (HL). Logic: Panic selling drives the price down, but strong volume and high closes show institutions are quietly accumulating at a discount.
The Strategy Card (Execution Blueprint):
- The Setup: Identify a mature, established trend. Look for a clear discrepancy between the price extremes and the CMF oscillator peaks/troughs.
- Entry (Trigger): Never trade a divergence blindly, CMF can stay divergent for long periods during strong trends. Enter only after Price Action Confirmation, such as a structural trendline break or a reversal candlestick pattern (e.g., an Engulfing candle or a Pin Bar rejecting a key resistance/support level).
- Stop Loss (SL): Place the stop safely beyond the extreme wick of the reversal candle (the absolute High or Low of the divergence pattern) plus a small spread buffer.
- Exit (TP): Take partial profits (TP1) at the nearest major structural swing level or liquidity pool. Trail the remaining position (TP2) using a dynamic support/resistance line like a 20-period EMA.
- Fail Case (Invalidation): If the CMF oscillator suddenly surges and breaks its own divergence trendline (e.g., pushing to a new Higher High during a presumed bearish divergence), the momentum has returned. The reversal setup is immediately invalidated—exit the trade manually.
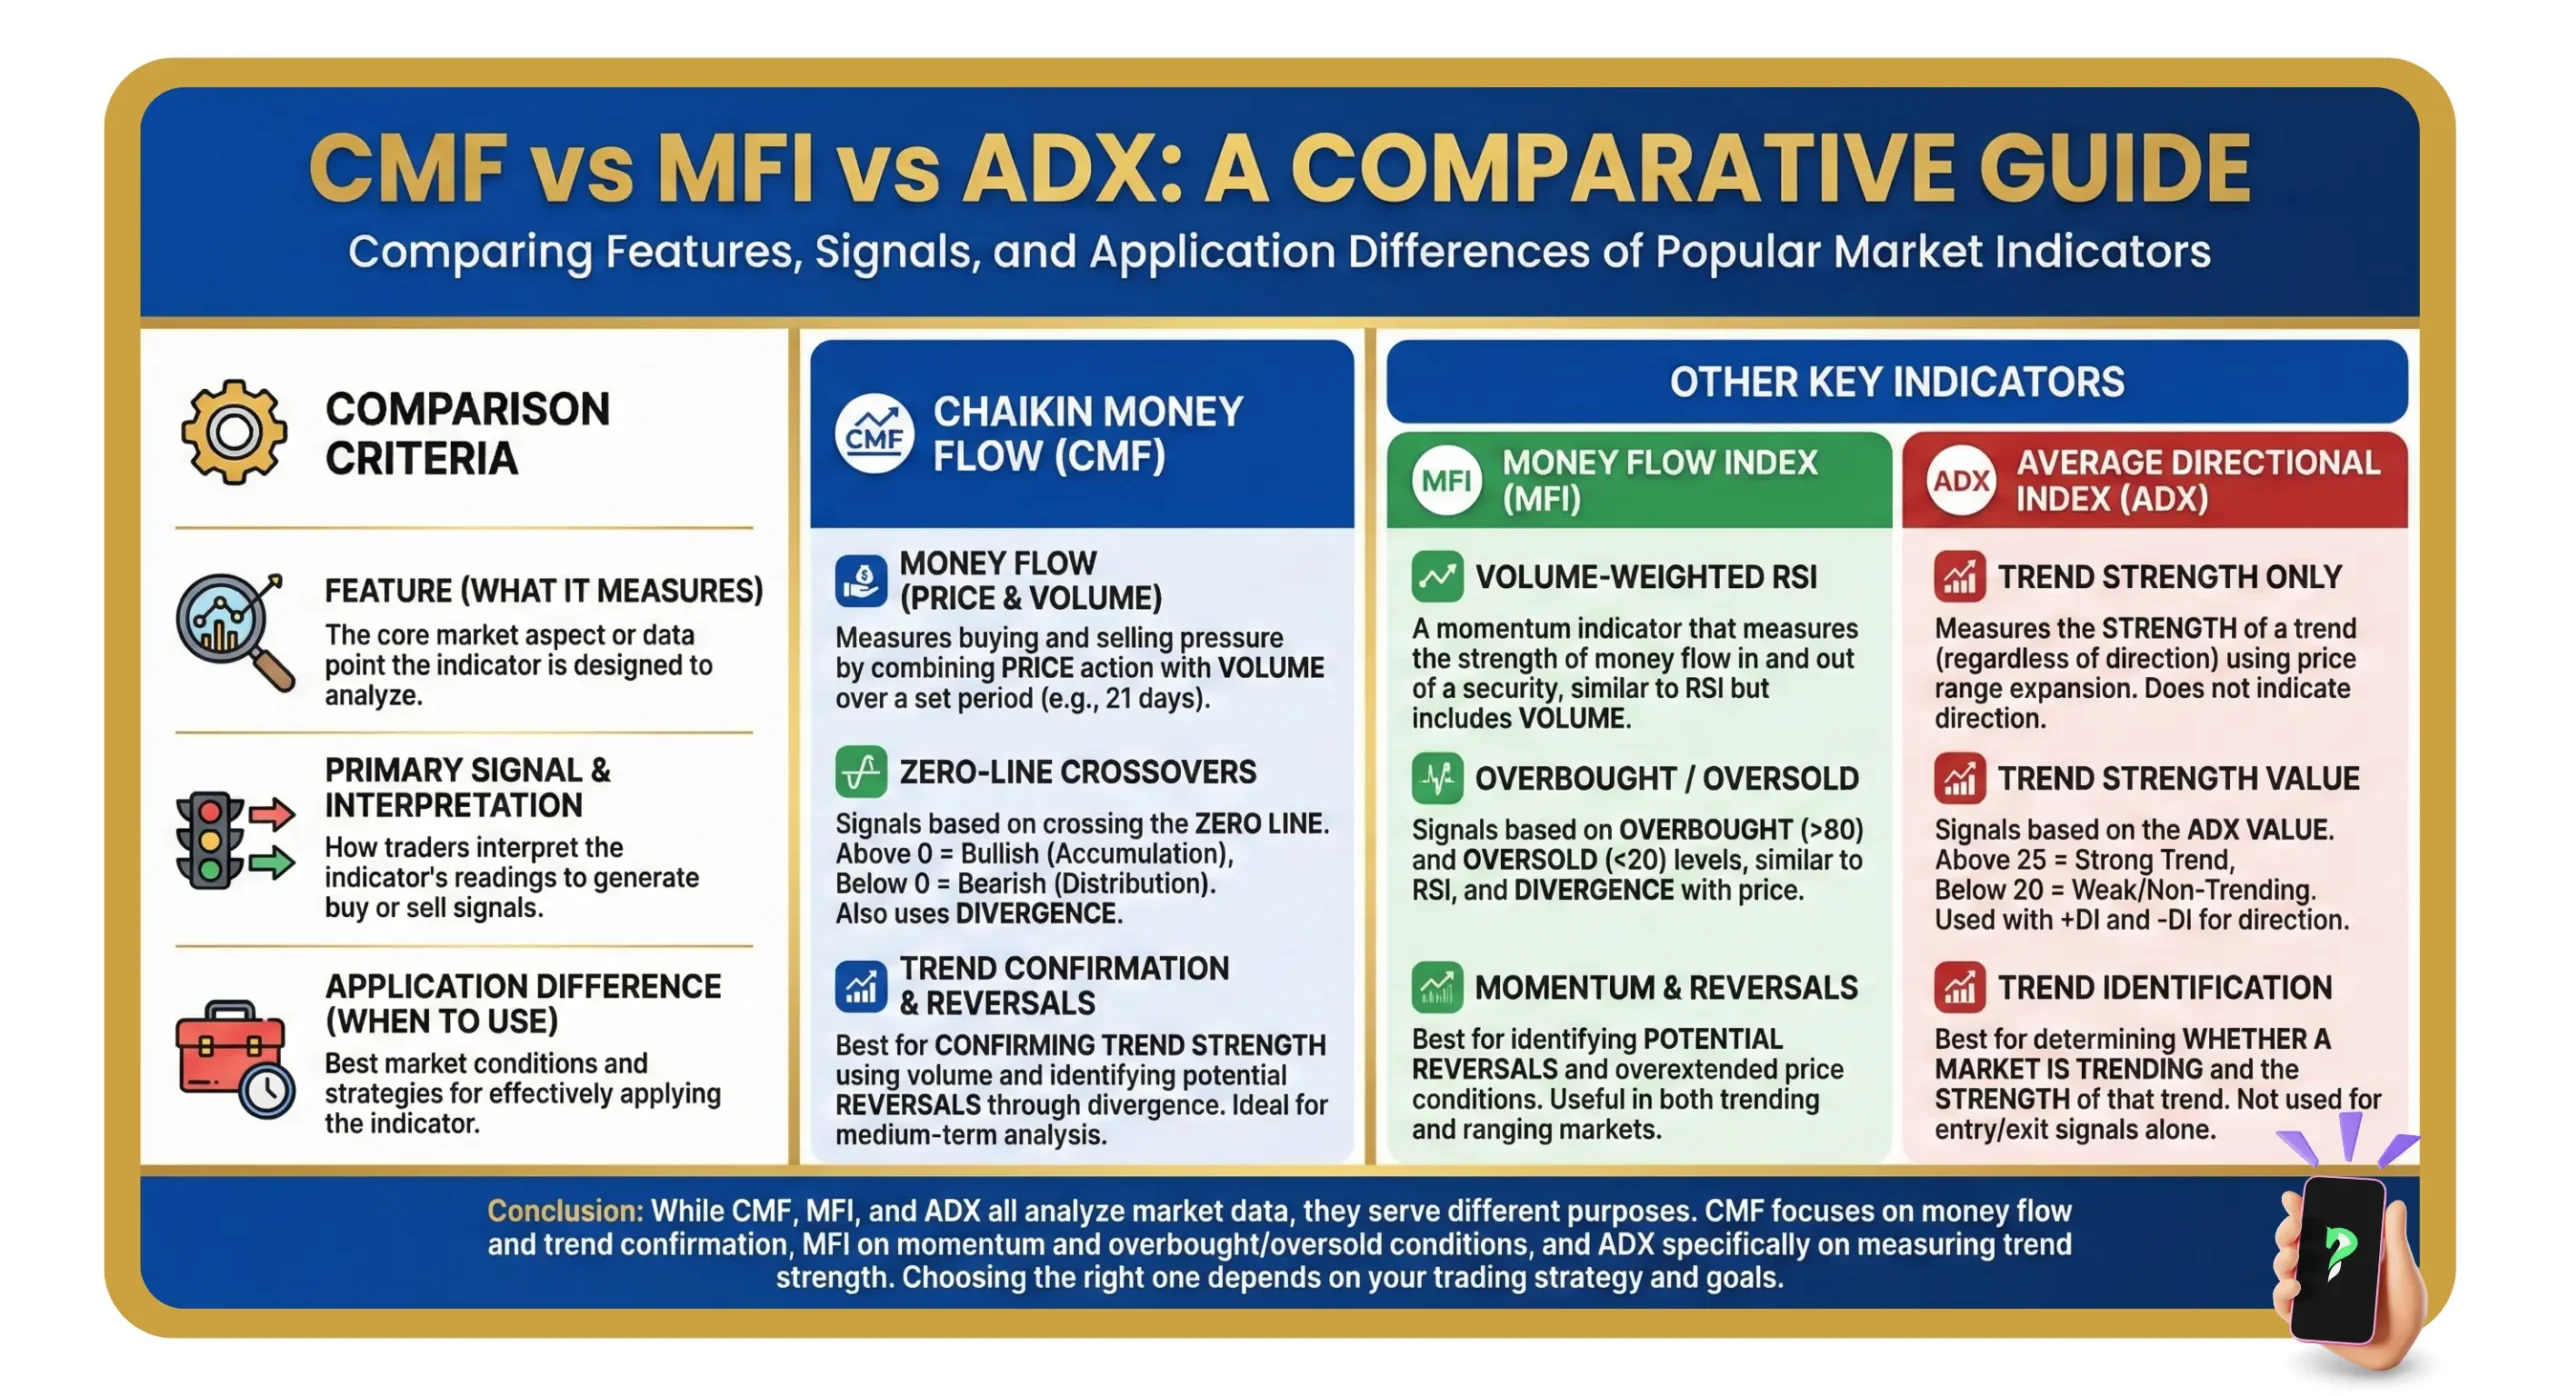
7. Volume Indicator Showdown: CMF vs. OBV vs. MFI
While the Chaikin Money Flow (CMF), On-Balance Volume (OBV), and Money Flow Index (MFI) all utilize volume to confirm price action, they process market data using fundamentally different mathematical logic. Understanding these nuances is the key to choosing the right tool for your specific trading strategy and avoiding redundant analysis.
7.1. The Core Differences Explained
Although CMF, OBV, and MFI are often grouped together as volume indicators, they interpret market data through entirely different mathematical lenses. The key to building a robust trading system is knowing exactly what question each indicator is asking the data. Here is the breakdown of their mechanical differences:
- On-Balance Volume (OBV) – The Macro Tracker: OBV, pioneered by Joseph Granville in 1963, is a cumulative indicator that simply adds volume on an “up day” and subtracts it on a “down day.” It only cares about the Close versus the Previous Close. It ignores intraday price action entirely (like wicks and daily ranges), making it best for long-term, macro trend confirmation.
- Money Flow Index (MFI) – The Volume-Weighted RSI: The MFI behaves almost exactly like the Relative Strength Index (RSI) but injects volume into the formula. It uses the “Typical Price” and is bounded between 0 and 100. It is primarily an oscillator used to find Overbought and Oversold extremes.
- Chaikin Money Flow (CMF) – The Intraday Detective: CMF ignores yesterday’s close. It focuses exclusively on where the price closed within its own daily High-Low range. This makes it the superior tool for spotting hidden institutional accumulation or distribution that occurs within a single session.
7.2. Head-to-Head Comparison Table
To capture the exact mechanical and strategic differences at a glance, refer to this breakdown:
| Feature | Chaikin Money Flow (CMF) | On-Balance Volume (OBV) | Money Flow Index (MFI) |
|---|---|---|---|
| Core Logic | Close relative to the High-Low range. | Close relative to the Previous Close. | Typical Price combined with Volume. |
| Indicator Type | Unbounded Oscillator (-1 to +1) | Cumulative Line (No boundaries) | Bounded Oscillator (0 to 100) |
| Primary Strength | Spotting hidden accumulation/distribution in candlestick wicks. | Confirming long-term macro trends and broad sentiment. | Pinpointing exact Overbought/Oversold exhaustion zones. |
| Biggest Weakness | Produces whipsaws in choppy, ranging markets. | Ignores intraday price rejection (does not factor in wicks). | Can stay overbought/oversold for extended periods during strong trends. |
| Best Used For | Breakout confirmation & Divergences. | Broad trend health analysis. | Mean-reversion trading strategies. |
The Expert Verdict: Use OBV to determine if the macro trend is healthy. Use MFI to see if the price is overextended and due for a pullback. Use CMF to confirm if the “Smart Money” is actually backing an intraday breakout or quietly taking profits via distribution.
8. Limitations of CMF: Avoiding Common Trading Traps
While the Chaikin Money Flow is a powerful tool for revealing institutional footprints, it is not a “holy grail.” To trade effectively, you must understand its mechanical blind spots and how to mitigate them.
- Vulnerable to Whipsaws (Choppy Markets): As discussed in the Market Context section, the CMF is highly unreliable in sideways markets. Without a clear trend, the closing prices fluctuate randomly, causing the CMF to flip-flop across the zero line.
- The Fix: Never use CMF signals in isolation when the ADX is below 25 or when the price is trapped in a tight horizontal range.
- Inherent Calculation Lag: The standard 20 or 21-day look-back period means the CMF is a lagging indicator. It confirms a shift in money flow only after the price action has already begun to move. This can result in slightly delayed entries compared to pure price-action triggers.
- The Fix: Use the CMF as a secondary filter, not a primary trigger. Let price action (like a trendline break) lead the way, and use the CMF crossover to confirm the move’s validity.
- Redundancy with Other Volume Indicators: Using CMF alongside the Accumulation/Distribution Line or the Chaikin Oscillator is often redundant since they share the same DNA.
- The Fix: Combine the CMF with non-correlated indicators. Instead of another volume tool, pair it with a momentum oscillator (RSI) or a volatility indicator (Bollinger Bands) to get a 360-degree view of the market.
9. Frequently asked questions about Chaikin Money Flow Indicator
10. The Bottom Line
The Chaikin Money Flow indicator (CMF) is a powerful tool for determining whether volume is confirming or contradicting the current price trend. By measuring the underlying buying and selling pressure, it gives traders a valuable look “under the hood” of the market.
When combined with momentum oscillators like the RSI or a simple Moving Average, the CMF becomes an effective filter for noise, helping to pinpoint genuine shifts in money flow. However, to achieve the best results, it should always be used for confirmation alongside other volume or momentum indicators.
To discover more essential tools for your trading arsenal, explore our in-depth guides on technical indicators list in the Learn Forex section at Piprider.
Infographic Section
-
Chaikin Money Flow Indicator -
CMF vs. MFI vs. ADX -
Mastering Chaikin Money Flow Indicator