One of trading’s biggest challenges is determining if a market is truly trending or just moving sideways. To solve this, J. Welles Wilder Jr. developed the Directional Movement indicator (DMI) (also known as the Directional Movement Index), a comprehensive technical tool that measures both a trend’s direction and its underlying strength. This guide provides a direct, no-nonsense look at the DMI’s formula, interpretation, and practical trading strategies.
Key Takeaways
- A complete indicator with three lines: +DI (bullish force), -DI (bearish force), and ADX (overall trend strength).
- Use the +DI/-DI crossover to find the trend’s direction and the ADX line to measure its strength.
- +DI crossing above -DI is a potential buy signal; -DI crossing above +DI is a potential sell signal.
- The ADX component helps traders avoid choppy, sideways action by identifying when a strong trend is present.
- As a trend-following indicator, it lags price and should always be used with other tools for confirmation.
1. What Is the Directional Movement Index (DMI)?
The Directional Movement Indicator (DMI) is a powerful system designed to identify trend direction and measure its underlying strength. First introduced as the “Directional Movement Index” by J. Welles Wells Jr. in his 1978 classic, ‘New Concepts in Technical Trading Systems’, it helps traders filter out market “noise.” This ensures capital is focused only on high-momentum conditions where the probability of profit is highest.
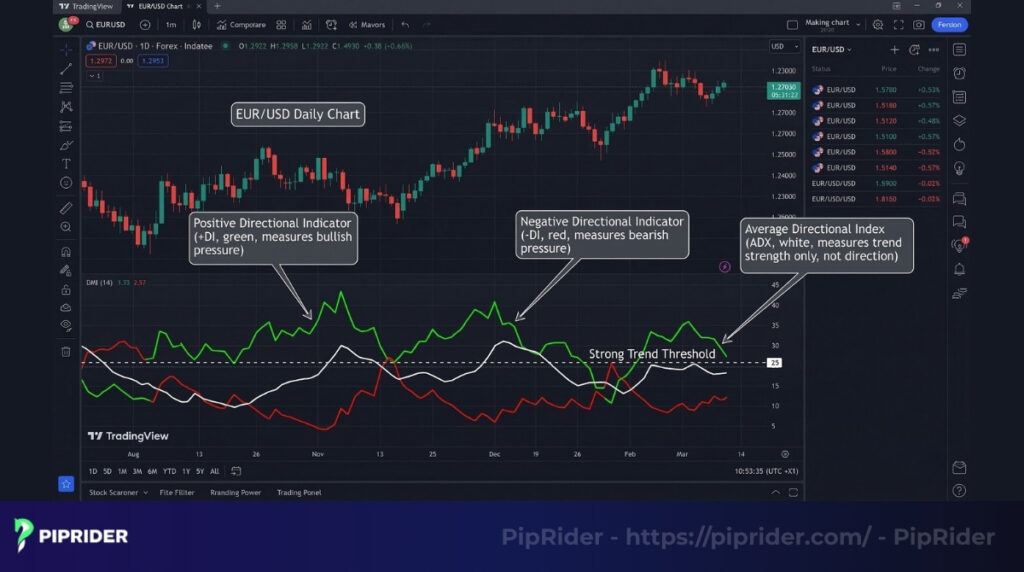
The system achieves this by plotting three distinct lines:
- The Positive Directional Indicator (+DI): Measures the presence and strength of bullish or upward price pressure.
- The Negative Directional Indicator (-DI): Measures the presence and strength of bearish or downward price pressure.
- The Average Directional Index (ADX): A non-directional line that measures the overall intensity of the trend, regardless of whether it is moving up or down.
Critical Distinction: DMI vs. ADX
Newer traders often use the terms “DMI” and “ADX” interchangeably, but understanding the hierarchy is vital for professional execution:
- DMI (The System): The entire 3-line indicator framework.
- +DI & -DI (The Direction): These components determine the Trend Bias (Who is winning the tug-of-war?).
- ADX (The Strength): This component measures only the Trend Conviction (How fast is the winner moving?).
The Quick Analogy: Think of the +DI and -DI as your Compass (telling you where the market is headed), while the ADX is your Speedometer (telling you how much power is behind the move).
2. The Formula and Calculation of the DMI
While your trading platform calculates the DMI instantly, understanding the mechanics behind the process helps you interpret its signals more effectively. The calculation turns raw price action into actionable data through a four-step process.
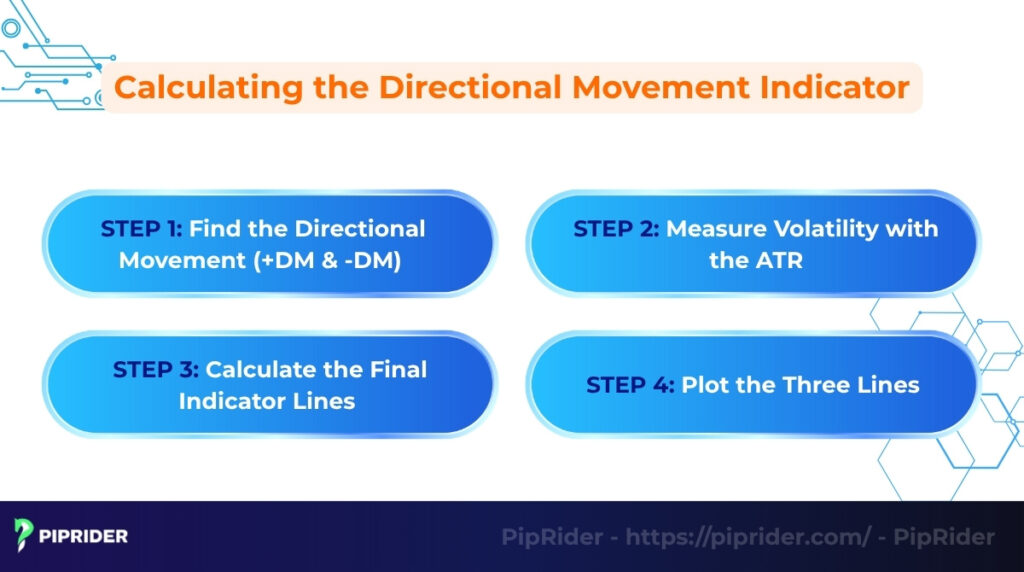
Step 1: Find the Directional Movement (+DM & -DM)
The process starts by comparing the current High/Low to the previous High/Low to determine the raw price thrust:
- +DM (Positive Directional Movement): Represents how much higher the current high is compared to the previous high.
- -DM (Negative Directional Movement): Represents how much lower the current low is compared to the previous low.
Step 2: Measure Volatility with the ATR
Next, the Average True Range (ATR) is calculated over a set number of periods. The ATR measures the asset’s overall volatility. This is crucial because it is used to “normalize” the +DM and -DM readings, ensuring the indicator’s values remain consistent across different Forex pairs, regardless of their daily pip movement.
Step 3: Calculate the Indicator Lines
The raw values are smoothed over a default setting of 14 periods (as recommended by Wilder). The final +DI and -DI lines are calculated by dividing the smoothed directional movement by the ATR:
Once the DI lines are established, the system calculates the DX (Directional Index), which is the absolute difference between the two DI lines divided by their sum. The ADX is simply the smoothed moving average of the DX as shown in the formula above.
Step 4: Plot the Three Lines
The final result is the classic three-line indicator plotted below your price chart, giving you a complete, real-time picture of bullish pressure, bearish pressure, and overall trend strength.
3. What Does the Directional Movement Index Tell Traders?
The Directional Movement Index (DMI) acts as a market GPS, answering two critical questions: Which way is the price moving? and Is the move strong enough to trade? By breaking price action into three distinct lines, the DMI helps traders distinguish between a profitable trending market and a dangerous “sideways” trap.
3.1. The Directional Indicators (+DI and -DI)
These indicators isolate the direction of price movement by comparing current highs and lows to previous ones.
- Positive Directional Indicator (+DI): Measures the intensity of upward pressure. When rising, it suggests bulls are gaining ground.
- Negative Directional Indicator (-DI): Measures the intensity of downward pressure. When rising, it suggests bears are taking control.
- The Technical Signal: When these lines cross, it indicates a shift in market dominance. However, at PipRider, we treat this crossover as a “Setup” rather than an automatic entry signal.
3.2. The Average Directional Index (ADX)
While the DI lines tell you where the price is going, the ADX tells you how fast it’s getting there. It is a non-directional indicator, it only measures the “trendiness” of the market.
- The 25 Benchmark: Based on industry standards recognized by the CFA Institute and leading financial resources like Investopedia, an ADX reading above 25 generally indicates a trend strong enough for trend-following strategies.
- Slope vs. Value: The direction of the ADX line is often more important than the number itself. A Rising Slope means the trend is accelerating, while a Falling Slope indicates momentum is fading, regardless of the price direction.
Quick Reference: The ADX Trend Strength Scale
To read the ADX like a professional, memorize these three critical thresholds. They act as your market speedometer:
- Below 20 (Weak Trend): The market is directionless and choppy. Buyers and sellers are in a stalemate. Action: Stand aside or use mean-reversion strategies.
- 25+ (Strong Trend): A clear, dominant trend has emerged. Momentum is healthy and sustainable. Action: This is the optimal zone for trend-following entries (buying dips or selling rallies).
- 40+ (Very Strong Trend): The trend is extremely powerful, but the “rubber band” is stretched tight. Action: Ride the momentum, but begin tightening your Stop-Loss, as a period of exhaustion or a sharp pullback is imminent.
(Note: The zone between 20 and 25 is considered the “Transition Phase” where a new trend is attempting to ignite).
3.3. DMI vs. The Aroon Indicator: Precision vs. Recency
To truly understand what the DMI tells you, it helps to compare it with another popular trend-spotting tool: the Aroon Indicator. While they look similar on a chart, they measure market dynamics in fundamentally different ways.
The DMI focuses on the expansion of price to gauge strength, answering the question: “Does this trend have enough power?” Conversely, the Aroon Indicator focuses purely on time, answering the question: “How recently did this trend start?”
| Aspect | DMI (Directional Movement Index) | Aroon Indicator |
|---|---|---|
| Core Philosophy | Measures Momentum and Strength. | Measures Time since the last extreme. |
| Calculation Basis | Based on the expansion between current and previous Highs/Lows. | Based on the number of periods passed since the highest High or lowest Low. |
| Primary Use Case | To analyze a trend’s conviction and decide if it’s safe to ride. | To spot early signs of a new trend emerging or consolidating. |
The Bottom Line: Use the Aroon Indicator to find out when a trend started. Use the DMI to find out how strong that trend actually is.
4. Professional DMI Trading Strategy (Practical Application)
In the Forex market, a technical signal without a framework is just noise. To extract consistent profit, you must move beyond simply watching lines cross. This professional framework prioritizes market context and price confirmation to eliminate false signals and protect your capital.
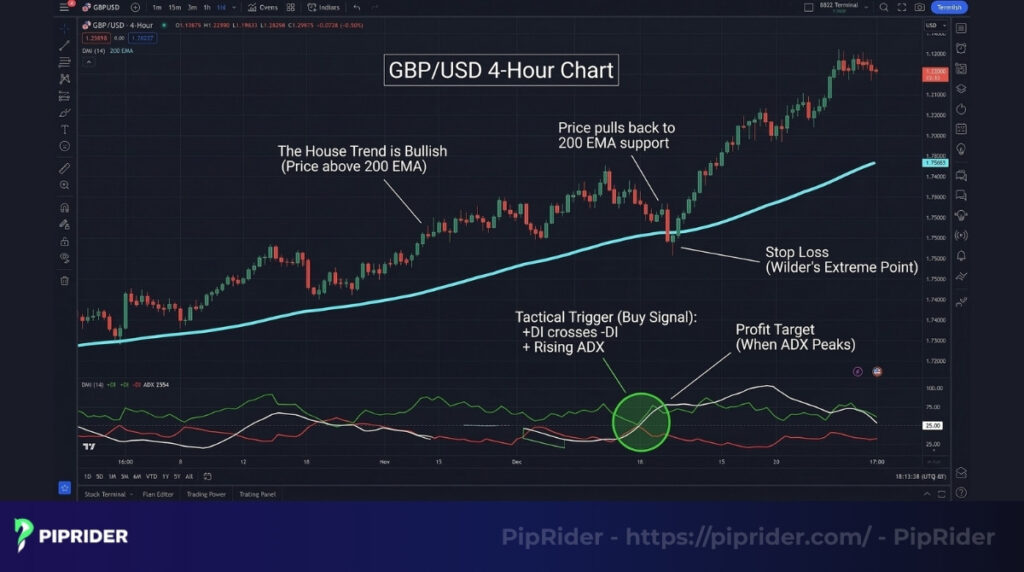
4.1. Phase 1: Strategic Trend Context (The “House Trend”)
To achieve a high win rate, your tactical entry must align with the “Big Money” flow. Trading against the higher timeframe (HTF) is the fastest way to hit your Stop-Loss.
- Identify the Bias (HTF): Check the Daily or 4-Hour chart. Is the ADX above 25 and pointing up? Is the +DI above the -DI? If yes, the “House Trend” is Bullish.
- Filter Entries (Alignment): Once the HTF bias is set, move to your lower execution timeframe (e.g., the 15-Minute or 1-Hour chart). Only take signals that match the HTF bias. If the Daily chart is Bullish, you must ignore all Sell signals on the lower timeframe.
4.2. Phase 2: Tactical Execution (The 3-Step Trigger)
Once the strategic context is confirmed, do not buy blindly on a crossover. Use Wilder’s original Extreme Point Rule, a core component of his 1978 methodology to pinpoint your entry and ensure price action confirms the indicator’s signal.
- Step 1: The Setup. Wait for a fresh DI crossover on your execution timeframe that matches your HTF bias.
- Step 2: The Momentum Check. Ensure the ADX is rising at the moment of the cross. This confirms that the “ignition” phase of the trend has begun.
- Step 3: The Trigger (Extreme Point). * Mark the High (for Longs) or Low (for Shorts) of the exact candle where the crossover occurred.
- Execute the trade only when a subsequent candle breaks and closes beyond this level.
- Invalidation: If the price fails to break this extreme point within 3 candles, the momentum is stale. Cancel the setup.
4.3. Phase 3: Risk Management & Exit Strategy
Knowing when to exit is more critical than knowing when to enter. A professional DMI strategy uses the indicator’s logic to define precise stop-loss levels and profit-taking zones based on trend maturity.
- Initial Stop-Loss Placement: Place your hard stop-loss at the Extreme Point of the signal candle. For a Long trade, this is the Low of the candle where the +DI crossed above the -DI.
- The “Climax” Exit (Profit Taking): When the ADX rises above 40 and then turns downward, it suggests the trend is overextended and entering an “exhaustion” phase. This is the optimal time to secure partial profits or tighten your trailing stop.
- The Counter-Cross Exit: Exit the position immediately if the DI lines cross back in the opposite direction (e.g., -DI crosses back above +DI for a Long trade), regardless of the current ADX value.
4.4. Advanced Tactic: Spotting DMI Divergence
While the standard 3-step execution works perfectly for trend-following, professional traders also use the DMI as an early warning system to anticipate market reversals before they happen. This is done through Divergence.
Divergence occurs when price action disagrees with the DMI readings, signaling that the current trend is silently losing power before a crossover even takes place.
- ADX Divergence (Momentum Decay):
- The Setup: Price makes a Higher High (in an uptrend), but the ADX line peaks at a Lower High.
- The Action: The trend is still technically moving upward, but the institutional “fuel” pushing it is running out. Do not enter new trend-following positions. Tighten your Stop-Loss.
- DI Divergence (Pressure Shift):
- The Setup: Price makes a Higher High, but the +DI line makes a Lower High.
- The Action: Even though the price is hitting new extremes, the actual buying pressure is weaker than the previous swing. This is a leading indicator of a trend collapse. Prepare for a structural price break or an impending DI crossover to execute a counter-trend entry.
Professional Warning: Divergence is a condition, not an immediate trigger. Never trade DMI divergence in isolation. Always wait for price action to confirm the reversal (such as breaking a trendline) before pulling the trigger.
5. Market Conditions: When the DMI Shines (and When It Fails)
The DMI is a momentum-based trend follower. In the Forex market, its accuracy depends entirely on the “environment” it is operating in. Recognizing these conditions is the first step to protecting your trading capital.
5.1. The “Sweet Spot”: Strong Trending Markets
The global Forex market now exceeds $9.6 trillion in daily turnover, according to the 2025 Triennial Central Bank Survey by the Bank for International Settlements (BIS). Within this massive liquidity, the DMI reaches its maximum predictive power during periods of ‘Strategic Imbalance’, when one side (bulls or bears) gains total psychological and financial control.
- Market Psychology: In a strong trend, “Buy the Dip” or “Sell the Rally” mentalities create a feedback loop. This causes price to move decisively in one direction, creating the high-conviction environment the DMI was built for.
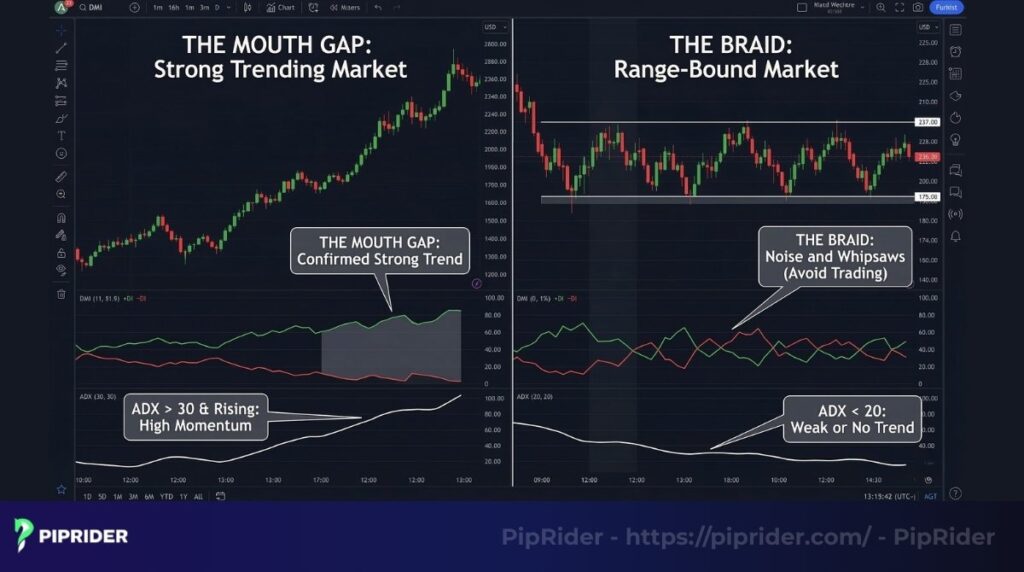
- The “Mouth” Gap Expansion: As price trends, the distance between the +DI and -DI lines widens. This “Expanding Cone” indicates that directional movement is significantly outperforming average volatility (ATR), confirming a healthy trend.
- Momentum Reinforcement: In this zone, a rising ADX confirms that new participants are entering the market, providing the “fuel” needed to sustain the move and keep your trend-following signals valid.
5.2. The “Danger Zone”: Sideways and Choppy Markets
In a range-bound market, price is in a state of Equilibrium. Neither buyers nor sellers have enough conviction to break established support or resistance levels, causing the DMI’s mathematical logic to struggle.
- The Mathematical “Noise”: Because the DMI calculates the difference between highs and lows over a set period (usually 14), a sideways market produces small, alternating values. This causes the +DI and -DI lines to “converge” rather than diverge.
- “The Braid” Phenomenon: When you see +DI and -DI intertwining repeatedly, it represents a “tug-of-war” where no winner emerges. Each “crossover” in this zone is likely a whipsaw, a false signal that will stop you out as the price immediately reverts to the mean.
- Energy Compression: While the DMI is “asleep” (ADX < 20), the market is actually compressing energy. However, the DMI is a lagging indicator in these zones; it cannot predict the direction of the breakout, only that a breakout has not yet occurred.
Professional Rule: In the “Danger Zone,” the DMI is a liability. This is where mean-reversion tools like Bollinger Bands or the RSI provide better utility by identifying overbought/oversold levels within the range.
5.3. The Master Strategy Matrix
Instead of guessing, use this master checklist as your final filter before executing any trade. This matrix combines Trend Strength (ADX) and Directional Bias (DI) into one definitive execution plan.
| Market Context | Technical Signal | Strategy Selection | Final Action |
|---|---|---|---|
| Strong Trend | ADX > 25 & Rising Wide DI “Mouth” Gap | Trend Following | Aggressive Entry: Buy Dips / Sell Rallies. |
| Early Trend | ADX 20 – 25 Fresh DI Crossover | Breakout Trading | Conservative Entry: Apply Extreme Point Rule. |
| Choppy / Range | ADX < 20 DI "Braiding" | Mean Reversion | Avoid DMI. Switch to RSI or Stochastics. |
| Trend Climax | ADX > 40 & Falling DI Lines Converging | Profit Protection | Take Profits: Tighten Stops or Exit. |
Pro Tip: An Aggressive Entry means entering the trade immediately at the candle close of the DI crossover. A Conservative Entry means waiting for the price to break Wilder’s Extreme Point (as explained in Section 4.2).
6. Efficiency Tip: Automating DMI Setups with Scanners
Manually monitoring dozens of currency pairs for the perfect DMI setup is inefficient. To trade like a professional, you should utilize automated scanners to alert you only when the “House Trend” and “Tactical Entry” align. This allows you to focus on execution rather than searching.
6.1. How to Build a Professional DMI Scanner
Most modern platforms, including TradingView, MetaTrader (MT4/MT5), and ThinkorSwim, allow users to create custom filters. Instead of a simple crossover, your scanner should identify Momentum Ignition by using the following logic:
- The Bullish Ignition Scan:
- Condition 1:
+DIcrosses above-DI(14-period). - Condition 2:
ADXis above 20 and has a positive slope (Rising). - Target: Finds pairs where buyers have just taken control and momentum is accelerating.
- Condition 1:
- The Bearish Collapse Scan:
- Condition 1:
-DIcrosses above+DI(14-period). - Condition 2:
ADXis above 20 and has a positive slope (Rising). - Target: Finds pairs where sellers are dominating and the downtrend is gaining “fuel.”
- Condition 1:
6.2. Enhancing Accuracy with Indicator Confluence
No indicator is perfect. To reach a “Pro” win rate, institutional traders often pair DMI scanners with secondary filters to confirm the quality of the breakout:
- Supertrend Overlay: Use this to provide a visual “Green/Red” background. Only take DMI Longs when the Supertrend is Green.
- Volume Profile: Ensure the DMI crossover happens at a point of high trading volume. A crossover on low volume is often a “fakeout” caused by retail noise rather than institutional money.
- Timeframe Sync: Set your scanner to run on the 4-Hour timeframe. When an alert triggers, drop down to the 15-Minute chart to apply the “Extreme Point Rule” for your entry.
PipRider Tip: A scanner is a filter, not a signal. Always perform a manual chart check to ensure the price isn’t hitting a major psychological support or resistance level before entering the trade.
7. Strategy Combinations: Trading DMI with Confluence
No single indicator is a holy grail. Professional traders use the concept of confluence, combining multiple technical tools that measure different market variables to filter out false signals. By pairing the DMI (momentum and direction) with price action and oscillators, you build a robust trading system.
7.1. DMI + Moving Averages (The Dynamic Trend Filter)
While the DMI calculates momentum, Moving Averages (MAs) smooth out price data to act as dynamic support and resistance. This combination ensures you never trade against the macroeconomic flow.
- The Setup: Apply a 200-period Exponential Moving Average (EMA) to your chart to determine the baseline trend.
- The Execution Rules:
- Bullish Confluence: If the price is trading above the 200 EMA, you only accept Long signals from the DMI (+DI crossing above -DI with ADX > 25). Treat all Bearish DMI signals as temporary pullbacks and ignore them.
- Bearish Confluence: If the price is below the 200 EMA, you only accept Short signals (-DI crossing above +DI with ADX > 25).
7.2. DMI + Trend Lines (Breakout Confirmation)
Indicators inherently lag behind real-time price action. Trend lines define the exact structural boundaries of the market, allowing you to anticipate moves before the DMI confirms them.
- The Setup: Draw descending trend lines connecting lower highs (in a downtrend) or ascending trend lines connecting higher lows (in an uptrend).
- The Execution Rules: A trend line breakout is the first sign of a reversal, but fakeouts are common.
- The Trigger: When a candle closes beyond the trend line, look at your DMI. If the DI lines cross simultaneously and the ADX is rising, the breakout is backed by institutional momentum. Enter the trade. If the ADX is flat or dropping, it is likely a trap.
7.3. DMI + RSI (Managing Ranges and Early Reversals)
While DMI Divergence (Section 4.4) warns you about internal momentum decay, RSI Divergence acts as an external validator, showing when price is reaching a mathematical limit. The Relative Strength Index (RSI) is the perfect partner for the DMI because it excels exactly where the DMI fails: ranging markets and identifying exhaustion.
- Strategy 1: The Range Filter (When ADX < 20)
- When the ADX drops below 20, the DMI is effectively useless. Stop looking at the DI lines. Switch your focus to the RSI to trade the range, buying when RSI hits oversold (< 30) and selling when it hits overbought (> 70).
- Strategy 2: RSI Divergence (The Early Warning System)
- The DMI crossover is a lagging signal. To anticipate a trend change, look for RSI Divergence (e.g., price makes a lower low, but the RSI makes a higher low).
- Once divergence is spotted, wait for the +DI to cross the -DI. The divergence validates the crossover, allowing you to enter the new trend with maximum confidence.
8. The Benefits of Using the DMI
When applied correctly, the Directional Movement Index indicator offers several key advantages that can significantly improve a trader’s ability to navigate trending markets.
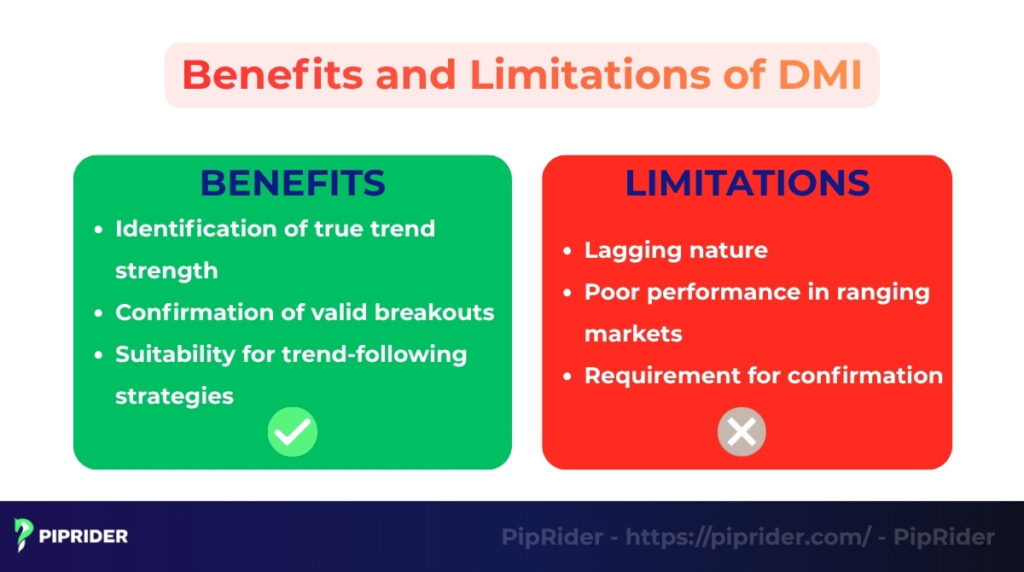
- Identification of true trend strength: The DMI’s primary benefit is its all-in-one nature. It doesn’t just indicate the trend’s direction; the ADX component also reveals if that trend has enough strength to be worth trading and helps filter out weak or choppy price action.
- Confirmation of valid breakouts: The ADX is an excellent tool for validating breakouts. A price move past a key level is much more reliable when the ADX is also rising. This confirms that the breakout is backed by growing momentum and is not a false signal.
- Suitability for trend-following strategies: The indicator is specifically designed for trend-following and swing trading strategies. It helps traders enter a trend and ride it while it has momentum (high ADX) and get an early warning when it starts to weaken (falling ADX).
9. The Drawbacks or Limitations of the DMI
While the DMI is one of many powerful indicators, it is not a standalone solution. To use it effectively, you must be aware of its inherent limitations.
- Lagging nature: Like most trend-following indicators, the DMI is a lagging indicator. It is calculated using past price data, meaning its signals will always come after a new trend has begun. This can lead to delayed entries and exits.
- Poor performance in ranging markets: The DMI is specifically designed to identify trends. In a sideways or ranging market, the +DI and -DI lines will frequently cross back and forth. This action generates a series of false signals known as ‘whipsaws’, which is common while the ADX stays low.
- Requirement for confirmation: Relying solely on DMI crossover signals for trade decisions is not recommended. Its accuracy is significantly increased when its signals are confirmed by other forms of technical analysis. For example, a trader might look for a breakout from a chart pattern or a corroborating reading from an oscillator like the RSI.
10. Frequently asked questions about Directional Movement Indicator
11. The Bottom Line
The Directional Movement indicator (DMI) is an essential tool for any serious trend trader. Its unique ability to simultaneously identify both the direction and strength of a trend sets it apart from more basic indicators. When its signals are confirmed with other indicators like the RSI or MACD, it forms a complete and powerful system for trend-trading strategies.
The DMI is best suited for swing and trend traders who need a reliable method for filtering market noise and validating their trading decisions. To continue discovering new strategies and tools, follow Piprider and explore our technical indicators list for more in-depth trading knowledge.