
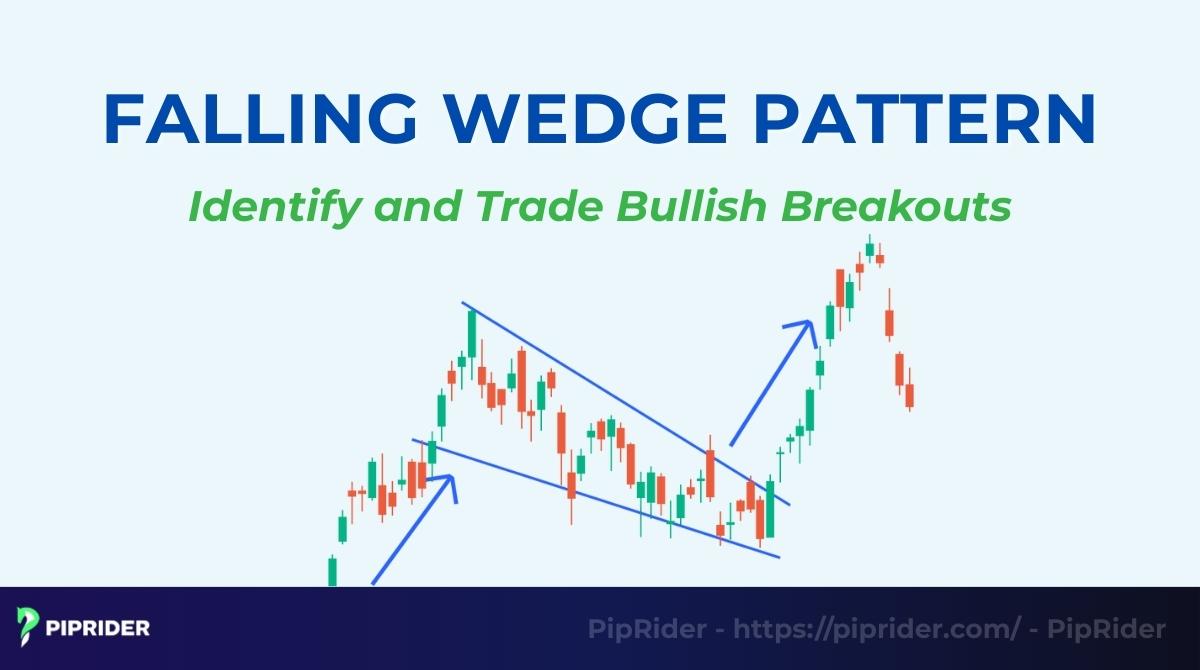
The Falling Wedge pattern is a powerful technical formation that signals a potential bullish breakout. Recognizing this structure allows traders to spot when selling pressure is fading and buyers are ready to take control.
This guide provides a complete roadmap to mastering the setup. You will learn how to filter out false signals, confirm the breakout with volume, and execute high-probability trades using our step-by-step strategy.
Key Takeaways
- The Falling Wedge is inherently bullish, signaling an upward price movement regardless of the prior trend.
- It features two converging trendlines sloping downward, connecting lower highs and lower lows.
- Volume typically decreases as the wedge forms and must spike significantly to confirm the breakout.
- It acts as a reversal pattern at the bottom of a downtrend and a continuation pattern during an uptrend pullback.
- The theoretical target is calculated by measuring the height of the widest part of the wedge.
1. What Is the Falling Wedge Pattern?
The Falling Wedge is a bullish technical pattern formed by two downward-sloping trend lines that converge (squeeze together). According to Investopedia, this formation is widely recognized as a bullish signal, indicating that selling pressure is weakening and a price rally is imminent (Scott, 2025).
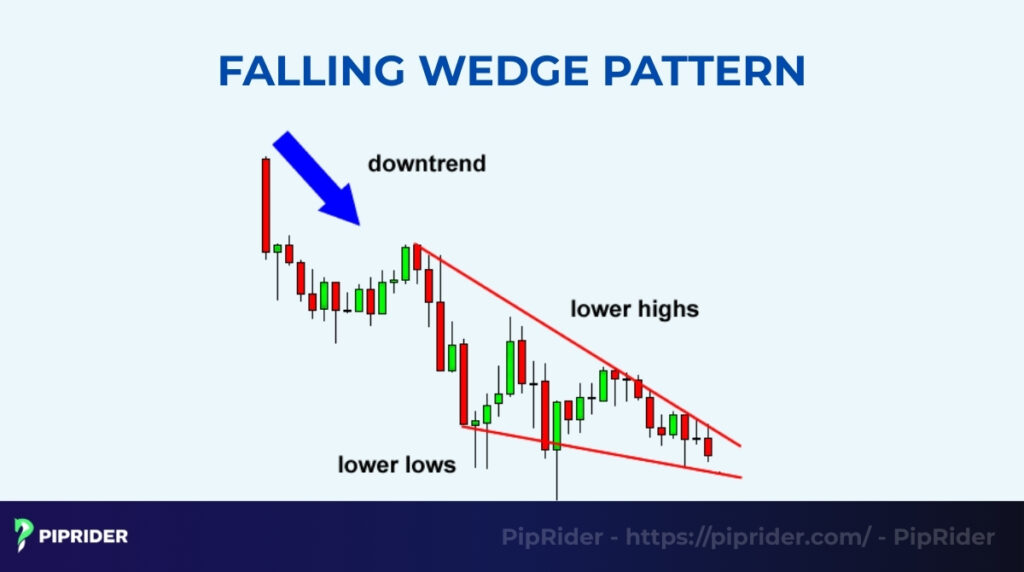
To identify a valid wedge, look for specific geometry where the price action is confined between two lines. The upper resistance line is steeper than the lower support line, causing the range to tighten over time. This structure creates a “price squeeze” with three key traits:
- Lower highs and lower lows: The market is dropping, but the range gets tighter.
- Volume contraction: Trading volume typically decreases as the pattern forms, confirming that sellers are losing interest.
- Bullish breakout: The pattern resolves when buyers absorb the remaining supply and push the price through the upper trendline.
This setup is universal, appearing frequently in forex trading, stocks, and crypto. It relies on a simple psychological shift called “seller exhaustion”. While bears try to push prices lower, each dip becomes shallower than the last, signaling they are running out of ammunition. The Falling Wedge can be found in two main contexts: at the bottom of a downtrend (reversal) or during a pullback in an uptrend (continuation). In either scenario, the pattern consistently signals that the price direction is about to shift in favor of the bulls.
2. How Does the Falling Wedge Structure Form?
A valid wedge is not just any triangle pointing down. It requires a specific “market geometry” where the price action contracts, signaling that the battle between bears and bulls is reaching a climax.
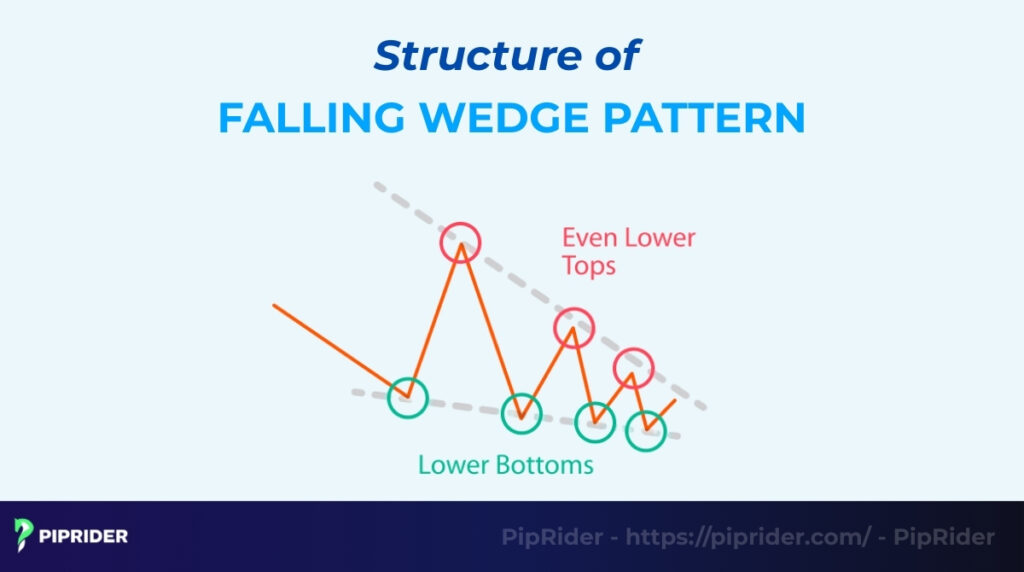
To confirm you are looking at a true Falling Wedge and not just a random downtrend, look for these three structural pillars:
- Decreasing slope (lower highs & lower lows): The market is technically still in a downtrend, but the selling is losing aggression. The price makes new lows, but they are shallow. This lack of depth proves that the price decline is fading.
- The “price squeeze” (convergence): Unlike a Parallel Channel, the two trend lines must point toward each other. The upper resistance line (connecting highs) slopes down steeply, while the lower support line (connecting lows) is flatter. They squeeze the price into a tight corner (the apex).
- The rule of 5 (validation): To filter out noise, a valid pattern typically needs at least five reversal points (e.g., 3 touches on the resistance line and 2 on the support line) to be mathematically defined.
3. What Are the Two Types of Falling Wedge Patterns?
The shape looks identical, but the strategy changes based on the market trend. Use this table to determine if you are catching a reversal or riding a trend.
| Type | Market Trend | The Signal | Reliability |
| Reversal | Downtrend | Trend Change (Bearish → Bullish) | Medium (Risky entry) |
| Continuation | Uptrend | Trend Resume (Pause → Bullish) | High (Best for newbies) |
3.1. Reversal Falling Wedge (The “Bottom Fisher”)
The reversal Falling Wedge is the classic reversal pattern that aggressive traders look for to catch market bottoms. It typically marks the final exhaustion point of a long-term bear market, offering a chance to enter at the very start of a new trend.
- The Setup: Price has been falling for weeks or months, but the downward momentum starts to stall.
- The Psychology: Sellers are exhausted and can no longer push the price down efficiently, allowing buyers to gradually take over.
- Risk Warning: Catching a falling knife is dangerous. If the breakout fails, the downtrend can resume violently. Always wait for a confirmed candle close above the upper line.
3.2. Continuation Falling Wedge (The “Trend Rider”)
In contrast, the continuation Falling Wedge appears in the middle of a strong uptrend, acting as a temporary pause or “breather” for the bulls. This setup is statistically safer because you are trading in the direction of the established momentum rather than trying to fight it.
- The Setup: The market rallies strongly, then rests briefly by drifting down in a tight, converging range.
- The Psychology: Early buyers are taking profits, but sellers are too weak to reverse the trend. Smart money uses this dip to accumulate more positions.
- Pro Tip: Focus on this variation if you are a beginner. It offers a higher probability of success since the “tide” is already rising in your favor.
4. What Defines a Valid Falling Wedge Setup?
A messy chart leads to messy results. To trade with confidence, ensure your pattern meets these four strict technical criteria before you even think about clicking “buy.”
4.1. Trendlines & Convergence (The Drawing Rules)
The accuracy of your drawing determines the quality of your trade. A valid wedge must show clear price compression, distinguishing it from a standard parallel channel.
- Correct Approach: Connect at least two lower highs for the upper line and two lower lows for the bottom line. Crucially, the trend lines must slope down and point toward each other (converge).
- Common Mistake: Drawing lines that are parallel. If the lines do not meet, you are looking at a Descending Channel, which requires a different trading strategy.
4.2. Volume Behavior (The Fuel)
Volume acts as the “lie detector” of the market. It confirms whether the price drop is genuine selling or just a lack of buying interest.
- During Formation: Volume should decay (decrease) as the price moves deeper into the wedge. This confirms that selling pressure is drying up.
- At Breakout: You need to see a massive volume spike when the price breaks the upper trendline. A breakout on low volume is often a “fakeout” or a trap.
4.3. Time Duration & Reliability
The amount of time a pattern takes to build directly affects its potential power. Quick, intraday wedges are often just noise, while longer structures build significant energy.
- The Rule: Generally, the longer the wedge takes to form, the more explosive the breakout will be.
- Timeframes: Wedges forming on 4-Hour (H4) or Daily (D1) charts are far more reliable than those on 5-minute charts, which are prone to random volatility.
4.4. Market Context (Location Matters)
Never trade a shape in isolation. The location of the wedge relative to the bigger picture is just as important as the shape itself.
- Confluence: A wedge forming exactly at a major support level or demand zone has a significantly higher win rate. This is because touching a long-term Moving Average (like the 200 EMA) at the same time provides strong confirmation, regardless of broader market trends.
- Avoid: A wedge “floating” in the middle of the chart with no historical support is risky.
5. How Do You Identify the Falling Wedge Pattern?
You identify the Falling Wedge Pattern by confirming four key elements: the convergence of its trendlines, a visible decrease in volume during its formation, structural symmetry, and the context of the prior trend. Use this checklist to validate the pattern before looking for an entry.
5.1. Step-by-Step Identification Checklist
Building a reliable trade requires a logical sequence of checks. Follow this systematic process to confirm the structural integrity of the wedge before making any trading decisions.
- Check the trend: Identify if you are trading a reversal (downtrend context) or a continuation (uptrend context).
- Draw Trendlines: Connect lower highs and lower lows. The lines must converge (point towards each other), not run parallel.
- Observe volume: Look for a steady decrease in volume as the price range tightens.
- Check pivot touches: You need a minimum of two clear touches on both the upper and lower trendlines.
- Confirm price action: Look for small candles and long wicks near the apex, indicating market indecision.
5.2. Indicators for Confirmation
Price action tells you what is happening, but these technical tools reveal why. Using them together creates a strong confluence of signals that drastically reduces false positives.
- RSI divergence: A Bullish Divergence (Price makes lower low, RSI makes higher low) is a strong sign of an incoming reversal.
- MACD bullish cross: A crossover above the signal line confirms momentum is shifting to buyers.
- Volume spike: The breakout candle must show a surge in volume to be valid.
- Moving Averages: A breakout that also clears the 50 EMA provides double bullish confirmation.
6. How to Trade the Falling Wedge Pattern
The Falling Wedge offers clear, objective rules for execution. Success depends on choosing the right entry method and strictly adhering to risk management principles.
6.1. Entry Strategies
Choosing the correct entry depends entirely on your risk tolerance. Traders typically choose between an aggressive immediate entry and a conservative confirmation entry.
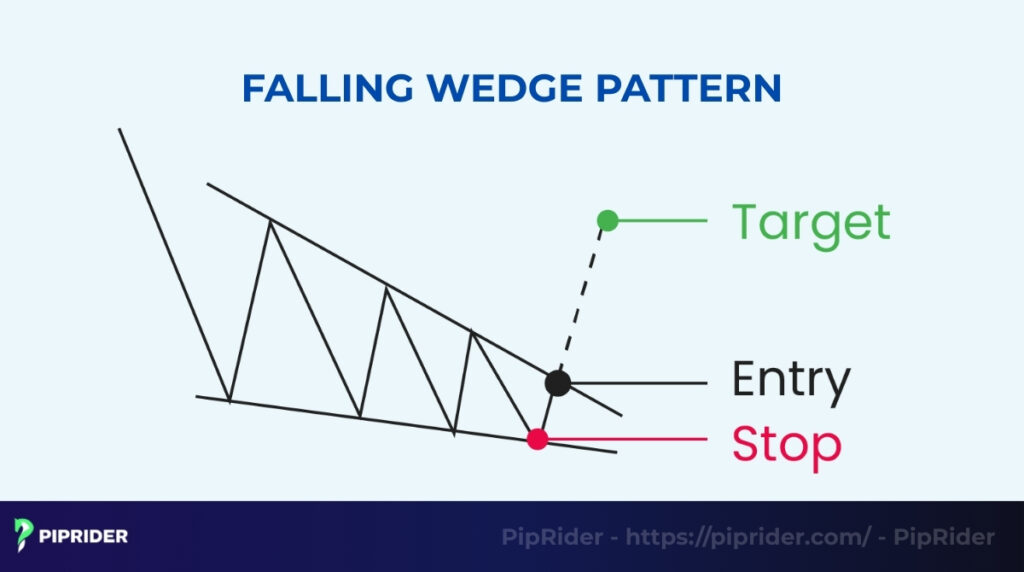
- Entry 1 (Aggressive Breakout): Open a long position immediately when the breakout candle closes above the upper trendline.
- Entry 2 (Conservative Retest): Wait for the price to pull back to the broken trendline. Enter when the price rejects the line (the old resistance becomes new support).
6.2. Optimal Stop-Loss Placement
Placing the stop loss is the foundation of risk management. The tight convergence of the wedge allows for a clear, low-risk placement.
- Below the nearest low: Place the stop loss just below the last swing low formed inside the wedge structure.
- Below Wedge support: Place the stop loss below the lower support trendline of the wedge.
- ATR-based stop: Use the ATR indicator (Average True Range) to set a stop that accounts for current volatility.
6.3. Profit Targets
The structure provides a clear, objective target, removing emotional guesswork. The most common method relies on measuring the height of the pattern.
- Measurement technique: Calculate the vertical height of the wedge at its widest point (the beginning).
- Projection: Project that measurement upward from the breakout point to determine your optimal exit point.
- Trailing stop: After hitting the first target, use a trailing stop to manage the remainder of the position and maximize potential gains from a strong trend continuation.
6.4. Avoiding False Breakouts
False breakouts are the biggest threat to profitability. Use these final filters as a mandatory checklist to validate the move before pulling the trigger.
- Volume filter: The breakout candle must be accompanied by a noticeable spike in volume.
- Candle close confirmation: The price must close cleanly outside the upper trendline, a wick poking through is not sufficient.
- Checklist before entry: Quickly confirm the RSI is not overbought and the overall market context is favorable.
6.5. Risk–Reward Ratios
The Falling Wedge naturally offers favorable risk-to-reward metrics. Its structure allows you to place a tight stop loss close to the entry point.
- Optimal R:R: Aim for a minimum 1:2 or 1:3 risk-to-reward ratio. The tight stop loss placement ensures that even a small target can justify the risk taken.
- When to avoid: Do not trade the pattern if the target price is closer than 1:1 R:R, or if a major resistance level sits directly above the breakout point.
7. How Does the Falling Wedge Pattern Look in Real Markets?
Theory meets reality. The Falling Wedge is a universal pattern. Understanding its unique characteristics in Forex, Stocks, and Crypto markets is key to successful execution.
| Market | Key Characteristic | Strategy Tip |
| Forex | High Liquidity | Best for “Textbook” patterns & retest entries. |
| Stocks | Gaps & Volume | Watch for gap downs and volume spikes. |
| Crypto | Extreme Volatility | Beware of long wicks. Wait for candle close. |
7.1. Forex Example (EUR/USD or GBP/JPY)
Forex markets are highly liquid, often resulting in the cleanest, textbook-perfect patterns for technical analysis. This high reliability makes currency pairs ideal for practicing the conservative retest entry strategy.
- Analysis: Look for the classic retest entry after the breakout. The clean liquidity often allows the price to break the upper trendline, pull back perfectly to test it as new support, and then resume the rally.
- Volume: Pay attention to volume patterns (which are often trickier to read in Forex). A spike in trading activity on the breakout candle provides the necessary validation.
7.2. Stock Example (US Stock / ETF)
Trading the pattern in the stock market requires keen attention to volume and gaps, as institutional activity is often concentrated around key reporting events and market open/close times.
- Analysis: Confirm the volume profile. The volume must dry up significantly during the formation of the wedge and then explode when the price breaks resistance. A breakout on weak volume is a high-risk setup and often leads to failure.
- Case study nuance: Watch for gap-ups after the breakout, which are common in stocks due to overnight news or earnings reports, accelerating the move immediately.
7.3. Crypto Example (BTC / ETH)
Due to its 24/7 nature and extreme volatility, the crypto market presents a higher risk of “stop hunting” and false breakouts. Patience is essential to avoid being trapped by mere price wicks.
- Case Study: Fast Breakout: Due to the 24/7 nature of crypto, breakouts are often sharp and swift, making the conservative retest entry less frequent.
- The Danger: Volatility creates long wicks, which can lead to false signals. Always wait for a candle close (Daily or 4-Hour) above the upper trendline to confirm the move and filter out volatility-induced traps.
7.4. Success Rate Discussion
The Falling Wedge is statistically reliable, but only when specific rules are followed.
- Why probability is high: The pattern works because it represents a forced reversal. The continued compression squeezes the bears into a corner, and once the upper line breaks, all remaining sellers are forced to cover their positions, fueling an explosive move upward.
- Statistical Data: According to technical analysis research, the Falling Wedge has a high success rate, often cited as 70% to 80% chance of breaking to the upside and reaching the pattern’s measured target (Bulkowski, 2021).
- Pattern failure analysis: The wedge fails when one of two things happens:
- Low volume breakout: The price breaks out but immediately stalls due to lack of buying interest, leading to a fakeout and re-entry into the wedge.
- Downward break: The price breaks below the lower support trendline. This invalidates the bullish thesis and signals that the downtrend is resuming with force.
8. How Can You Apply Advanced Techniques to the Falling Wedge?
Moving beyond basic identification, advanced traders combine the pattern with institutional concepts like Supply/Demand and Multi-Timeframe analysis to filter out noise and maximize their edge.
8.1. Multi-Timeframe Analysis (MTF)
MTF analysis filters noise and ensures you are trading with the primary market tide, not against minor fluctuations.
- The Rule: Always confirm the higher timeframe (Daily or Weekly) trend or structure before executing on the lower one (H4 or H1).
- Action: Check if your wedge apex aligns with a major support level or a Demand Zone visible on the Weekly chart. This confluence adds significant weight to the signal.
8.2. Supply–Demand Integration (S/D)
The wedge itself signals buyer dominance, but its location at a strong demand zone confirms institutional interest.
- The Setup: Look for the wedge formation to terminate (apex) precisely within a well-defined demand zone (an area where institutional buying pressure entered the market previously).
- Result: A breakout from a wedge that terminates in demand often results in a faster, more explosive rally.
8.3. Combining with Order Blocks (Advanced Pricing)
This technique is derived from Smart Money Concepts (SMC), using the wedge structure to validate a powerful entry at an institutional level.
- The Concept: Identify a large institutional order block below the wedge structure. The wedge’s price contraction should occur near or inside this area.
- Premium/Discount: Ensure the price is trading at a “Discount” (low price range) relative to the recent structure before the bullish breakout, confirming the asset is undervalued.
8.4. Using Screeners & Tools
Manually checking hundreds of charts is inefficient. Automated tools provide immediate alerts, ensuring you never miss a high-probability setup.
- TradingView/TrendSpider: These platforms allow you to set up alerts to notify you immediately when converging trendlines are detected across multiple assets.
- Efficiency: Use screeners to narrow your focus to only those assets that are currently setting up a wedge formation.
8.5. Quantitative / Backtesting Approach
Backtesting is essential for building confidence and verifying the pattern’s statistical edge on your specific assets and timeframes.
- The Process: Test the wedge’s success rate, risk placement, and target accuracy on 50–100 historical instances of your chosen asset (e.g., BTC/USD).
- Verification: Verify the pattern’s statistical accuracy under your own rules. This personal confidence is crucial for sticking to your plan during stressful trades.
9. What Are the Most Common Mistakes Traders Make?
Avoiding these five critical errors is essential for protecting your capital and turning technical analysis into profitable trades. Recognizing these pitfalls turns a flawed setup into a powerful learning experience.
- Confusing the geometry (The drawing error): Confusing a descending channel (parallel lines) with a wedge means ignoring the essential convergence that signals impending buyer control. Always ensure the lines converge and the upper resistance line is visibly steeper.
- Trading before the breakout (The anticipation trap): Entering the trade prematurely out of fear of missing the move (FOMO). Patience is non-negotiable; entering before a full candle close above resistance is the leading cause of pattern failure.
- Ignoring volume confirmation (The false signal): Executing a trade when the breakout occurs on low or average volume. A move that is not supported by a volume spike is a significant red flag and is often designed to trap impatient traders.
- Skipping market context (The location error): Trading a wedge that is “floating” in the middle of a chart, away from any significant price history. A valid pattern must form near a major key support level or demand zone for structural reliability.
- Poor risk management (The capital killer): Failing to use a strict ATR-based stop loss or trading with an oversized position. Neglecting basic risk management can turn a high-probability setup into a major loss.
10. How Does the Falling Wedge Compare to Other Chart Patterns?
Confusing the Falling Wedge with a triangle or a channel is a critical mistake. Use this quick comparison guide to differentiate the trading patterns based on their essential geometry.
| Pattern | Key Feature (The Tell) | Signal Direction |
| Falling Wedge | Converging (Both lines slope down) | Bullish Reversal/Continuation |
| Descending Triangle | Flat Support / Sloping Resistance | Bearish Continuation (Usually) |
| Bull Flag | Parallel Lines (Sloping down) | Bullish Continuation |
| Bullish Channel | Parallel Lines (Sloping up) | Bullish Continuation |
10.1. Falling Wedge vs Descending Triangle
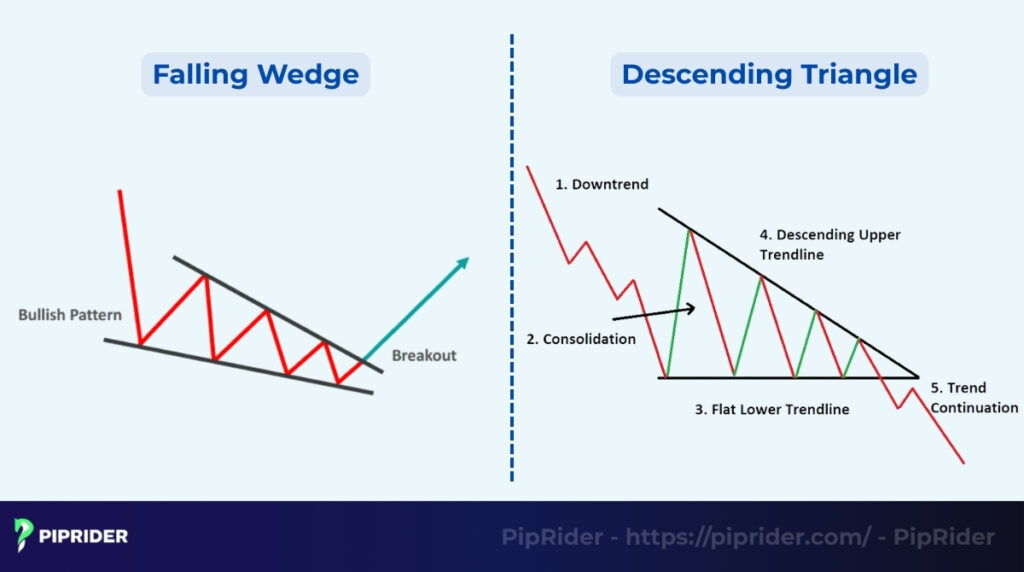
This is a critical distinction because the two patterns often have opposite trade outcomes.
- The Difference: The Descending Triangle has a flat, horizontal support line, indicating that the buyers are holding a fixed price floor. The Falling Wedge has a sloped support line, meaning the price floor is consistently moving lower.
- The Signal: The Triangle usually resolves downward (bearish continuation), while the Wedge almost always resolves upward (bullish reversal).
10.2. Falling Wedge vs Bull Flag
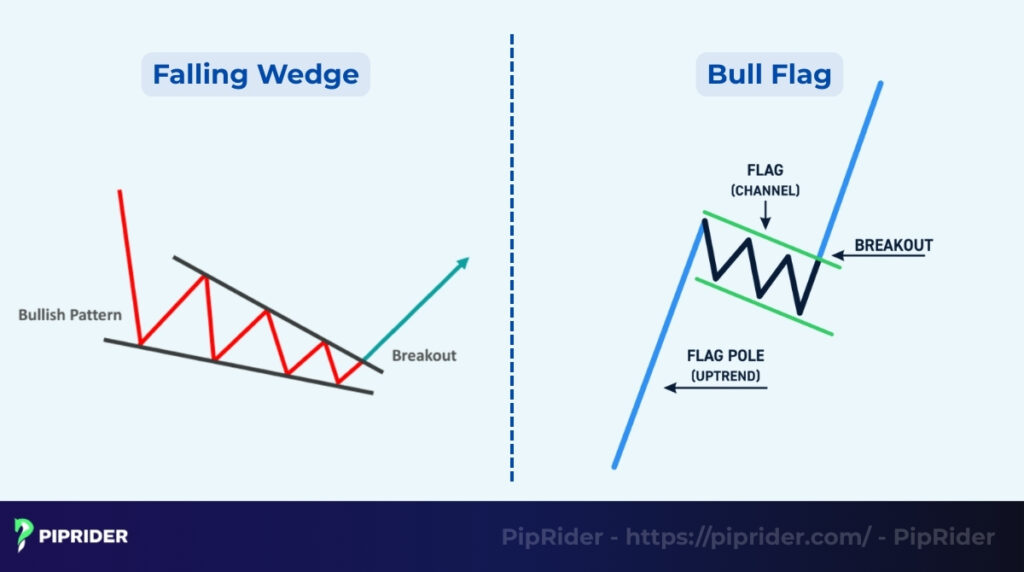
Both patterns are common bullish continuation signals, but they differ in their internal structure and subsequent potential volatility.
- The Difference: A Bull Flag (or Bear Flag) is defined by its parallel support and resistance lines. The Wedge, however, is defined by convergence.
- The Logic: Because the Wedge squeezes the price more tightly, it builds more energy, often leading to a more explosive breakout than a standard Bull Flag.
10.3. Falling Wedge vs Bullish Channel
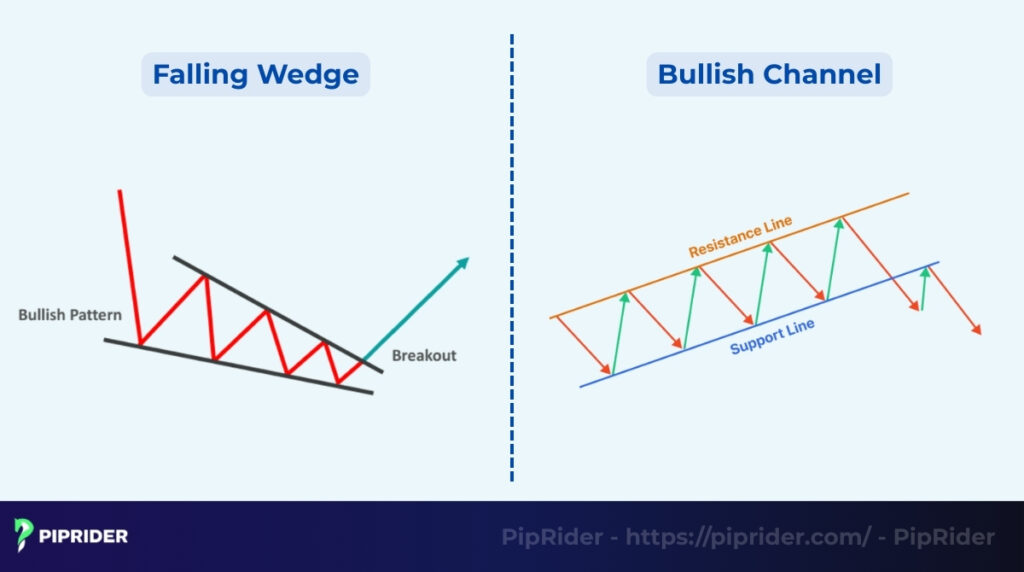
These two patterns are never confused visually, but they represent different phases of a trend.
- The Difference: A Bullish Channel slopes upward and shows a controlled, ongoing rally. The Falling Wedge has trend lines sloping downward and shows a necessary pause or correction.
- The Role: The Wedge is a consolidation phase that precedes the major move. The Channel is the actual trending move itself.
11. What Are the Limitations of the Falling Wedge Pattern?
While highly reliable, the Falling Wedge is not perfect. Successful traders must be aware of its three primary failure points.
- Fails in choppy markets (lack of context): The pattern requires a clear, defined prior trend (uptrend or downtrend) to reverse or continue. It does not work well in wide sideways markets or choppy ranges, where it often generates false signals due to lack of momentum.
- The volume trap (false breakouts): This is the leading cause of pattern failure. A breakout above resistance is invalid unless accompanied by a significant volume spike. If volume is absent, the move is a fakeout designed to trap early buyers.
Fundamental risk (news events): Large, unforeseen economic news (such as central bank decisions or inflation reports) can instantly destroy the technical structure. These events inject randomness into the market, causing price volatility that renders the pattern useless.
12. Frequently asked questions about Falling Wedge Pattern
13. Summary: Key Takeaways & Final Checklist
The Falling Wedge pattern is one of the most reliable bullish patterns in technical analysis, signaling that selling pressure is exhausted and a powerful rally is imminent. Success hinges on disciplined validation of the pattern’s geometry and volume.
Five Core Rules for Trading the Wedge
- Bullish signal & Context: Confirm the bullish signal forms at a key support level (Reversal or Continuation).
- Geometry is mandatory: The pattern is defined by two converging trendlines that both slope downward (Not parallel).
- The volume filter: Demand a volume spike on Breakout. Breakouts lacking volume are high-risk fakeouts.
- Execution strategy: Prioritize the retest entry after a confirmed candle close above resistance.
- Risk discipline: Always set a tight stop loss (Below the nearest swing low) and ensure a minimum 1:2 Risk-to-Reward Ratio.
Ready to master advanced chart patterns?
Don’t trade alone. Follow Piprider today for daily market insights and professional analysis to improve your trading decisions. Access our complete library of advanced trading strategies now.


