The Head and Shoulders pattern is a trusted tool for predicting trend reversals. Mastering this setup helps you exit winning trades before a crash and enter new positions with confidence. This guide teaches you to identify valid patterns, filter out false signals, and set accurate profit targets for consistent results.
Key Takeaways
- The Head and Shoulders is a bearish reversal pattern that forms after an uptrend.
- It consists of a left shoulder, a higher head, a lower right shoulder, and a neckline.
- The signal is strongest when accompanied by decreasing volume and a confirmed breakout below the neckline.
- The profit target is equal to the vertical distance from the head to the neckline.
- The Inverse Head and Shoulders is the bullish variation used to trade bottoms.
1. What Is the Head and Shoulders Pattern?
The Head and Shoulders is a technical chart pattern that appears at the end of an uptrend. It signals that the bullish trend is over and a bearish reversal is starting.
1.1. Basic Definition in Technical Analysis
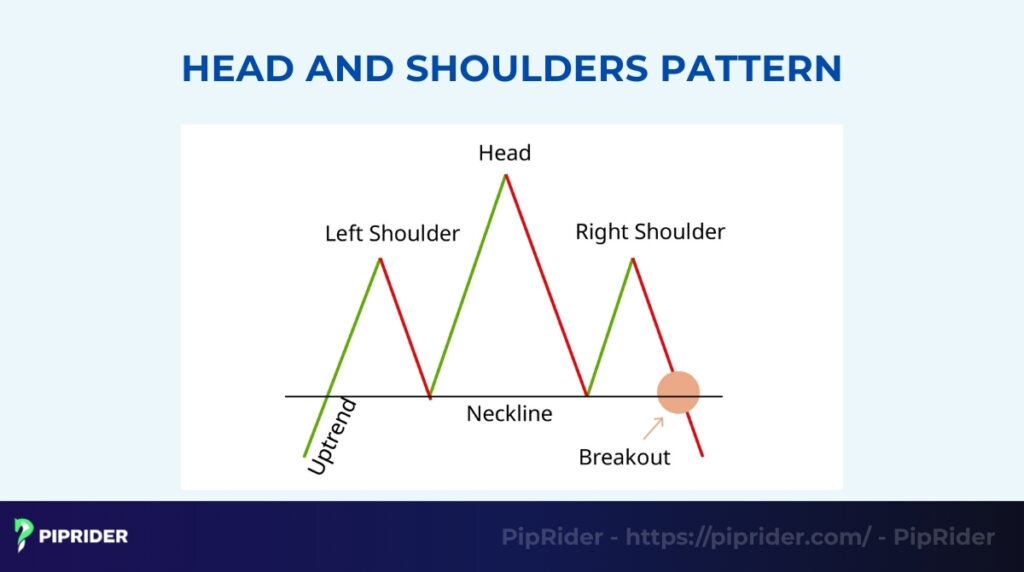
The Head and Shoulders pattern is a specific formation on a price chart used to predict a trend reversal. As the name suggests, the pattern looks like a human head with two shoulders. It consists of three distinct components:
- Left Shoulder: A peak formed after a strong price rise.
- Head: A higher peak situated between the two shoulders.
- Right Shoulder: A lower peak that fails to reach the height of the head.
- Neckline: A support line connecting the lows of the two shoulders.
When the price breaks below the neckline, the pattern is complete. This confirms that the uptrend has officially reversed into a bearish trend.
1.2. Why It’s Considered a High-Probability Reversal Pattern
Both financial educators and statistical data confirm this pattern’s reliability. Investopedia highlights it as a trusted indicator for signaling trend changes (Mitchell, 2024).
Furthermore, the research by Thomas Bulkowski (2021) in the Encyclopedia of Chart Patterns shows that the Head and Shoulders Top has a break-even failure rate of less than 10% in bull markets, making it statistically one of the safest setups to trade.
This high probability comes from the underlying mechanics. The pattern shows a visible transition in power:
- The head shows buyers can still push prices higher.
- The right shoulder shows buyers are exhausted and cannot push the price back to the previous high.
- The break of the neckline confirms that sellers have officially taken control.
1.3. Head and Shoulders vs. Double Top
Both patterns are bearish reversal signals that appear at the top of an uptrend, but they have key differences in structure.
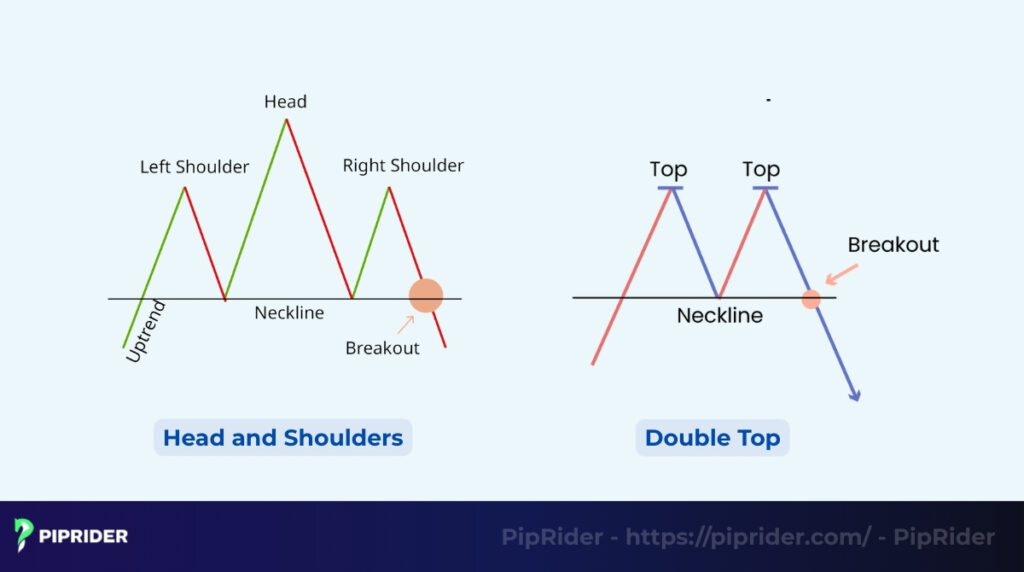
- Head and Shoulders: Has three peaks. The middle peak (Head) is the highest.
- Double Top: Has two peaks of roughly equal height. It looks like the letter “M”.
While both signal a potential sell-off, the Head and Shoulders pattern is often considered to provide a clearer warning sign due to the formation of the lower high (Right Shoulder).
2. Anatomy of the Head and Shoulders Formation
To trade this pattern effectively, you must identify its four distinct components on the chart. A valid setup requires specific relationships between the shoulders, the head, and the neckline.
2.1. Left Shoulder – Initial Peak
The pattern begins during a strong uptrend. Buyers push the price up to form a high, which then retraces slightly down to a support level.
- Appearance: It looks like a standard higher high in a bullish trend.
- Volume: Typically, volume is high during the rise of the left shoulder. This indicates the trend is still healthy.
2.2. Head – Highest High Formed by Buyers’ Exhaustion
After the left shoulder forms, buyers make a final push to create a new swing high, exceeding the peak of the left shoulder.
- Appearance: This is the highest point of the entire pattern. It stands out above the left and right shoulders.
- Warning Sign: Despite the higher price, buying momentum often starts to fade here. Volume may decrease compared to the left shoulder.
2.3. Right Shoulder – Lower High Showing Weakness
Price falls back from the head and bounces slightly. However, buyers cannot push it back to the previous high.
- Appearance: The peak of the right shoulder is lower than the head. Ideally, it is roughly the same height as the left shoulder.
- Meaning: This lower high is the crucial signal. It shows that the uptrend market structure (higher highs) is broken and sellers are gaining strength.
2.4. Neckline – Key Breakout Level (Horizontal / Sloping)
The neckline is the trigger line for the trade. It is drawn by connecting the swing low after the left shoulder and the low point after the head.
- Horizontal: A flat neckline is the most reliable and easiest to trade.
- Sloping: The line can slope up or down. A downward-sloping neckline is considered more bearish because it shows sellers are aggressive, often accelerating the subsequent bearish trend.
3. Market Psychology: Why Does This Pattern Work?
The Head and Shoulders isn’t just a shape; it tells a story of mass panic. It reveals the exact moment market sentiment shifts from greed to fear.
- Momentum dies (the right shoulder): In a bull market, traders expect higher highs. The right shoulder is the first time buyers fail to push the price back to the peak. These market movements signal that the “easy money” phase is over and “Smart Money” has stopped buying.
- The “bull trap” at the head: Traders who bought at the absolute top (Head) are now trapped in losing positions. As the price rallies slightly to form the right shoulder, these trapped buyers panic and sell to “get out alive.” This selling pressure stops the rally dead in its tracks.
- Panic selling at the neckline: The neckline is the last line of defense. When it breaks, two things happen instantly: old buyers give up (Stop Losses hit), and new bears jump in. This “double dose” of selling creates the violent drop that follows.
4. Types of Head and Shoulders Patterns
While the classic shape is famous, the pattern has key variations depending on the market trend. Use this quick comparison table to identify exactly which setup you are trading.
| Pattern Type | Trend Context | Signal | Key Feature |
| Standard H&S | Uptrend | Sell (Bearish) | Head is the highest peak. |
| Inverse H&S | Downtrend | Buy (Bullish) | Head is the lowest trough. |
| Complex H&S | Any | Weaker Signal | Multiple left/right shoulders. |
4.1. Standard Head and Shoulders (Bearish)
The Standard Head and Shoulders pattern is the most widely recognized variation in technical analysis. It typically appears at the exhaustion point of a strong bull market, signaling that the upward momentum is finally over and sellers are taking control.
- Context: Forms exclusively at the peak of an uptrend.
- Appearance: Three peaks (High → Higher High → Lower High).
- The Signal: Traders look to SELL (Short) when the price closes below the neckline support.
4.2. Inverse Head and Shoulders (Bullish Reversal)
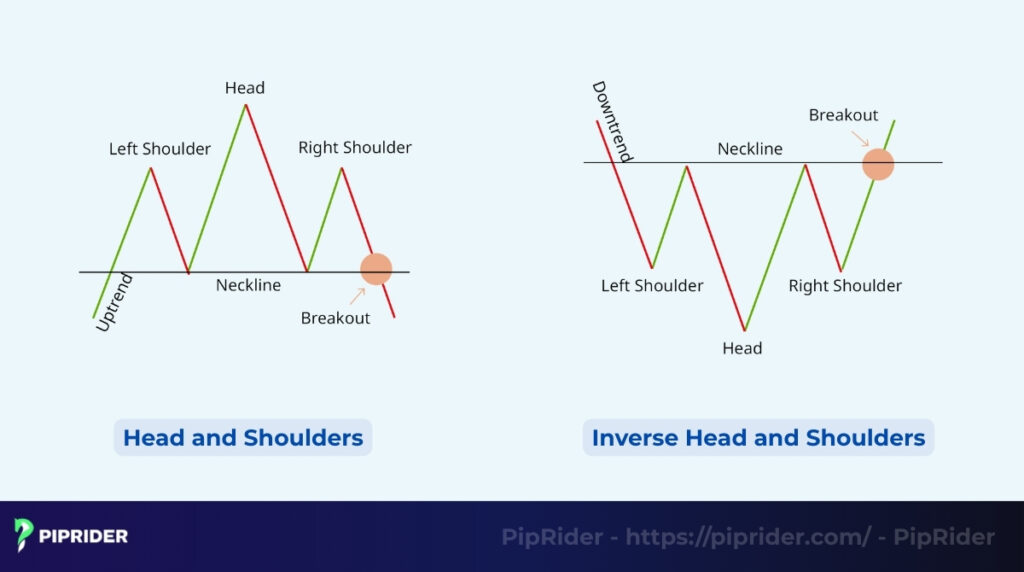
The Inverse Head and Shoulders (or “Head and Shoulders Bottom”) is the mirror image of the standard pattern. Instead of marking a top, this formation helps traders identify the exact moment a downtrend is reversing into a new rally.
- Context: Forms exclusively at the bottom of a downtrend.
- Appearance: Three troughs (Low → Lower Low → Higher Low).
- The Signal: Traders look to BUY (Long) when the price breaks above the neckline resistance.
4.3. Complex Head and Shoulders (Multiple Shoulders)
Real markets are rarely perfect. Sometimes you will see a “messy” pattern with, for example, two left shoulders and one right shoulder.
- Trade with caution: These patterns are harder to identify. Symmetry is key. If the pattern looks too chaotic, it is often safer to wait for a clearer setup to avoid false signals.
4.4. Sloping Neckline Variations
The neckline is rarely perfectly horizontal. The angle provides a hidden clue about the strength of the move:
- Upward Slope: In a bearish pattern, this acts as rising support, making it harder for sellers to break through.
- Downward Slope: This is the ideal scenario for bears. A downward slope shows sellers are aggressive even before the breakdown, increasing the probability of a successful crash.
5. How Do You Identify a Valid Head and Shoulders Pattern?
Not every three-peak formation is a tradable signal. To filter out false patterns and increase your win rate, you must verify 4 strict criteria: a clear prior uptrend, a specific volume profile, structural symmetry, and a decisive neckline break.
5.1. Clear Prior Uptrend Required
Since this is a reversal pattern, it logically requires an existing uptrend to reverse. Without this context, the pattern has no predictive value.
- The Rule: Look for a series of higher highs leading directly into the left shoulder.
- The Mistake: Ignore this shape if it appears during a sideways range or choppy market.
5.2. Volume Pattern Confirmation
Volume reveals the hidden strength of buyers and sellers. A high-probability setup typically exhibits a specific sequence confirming that momentum is draining.
- Left Shoulder (High Volume): Buyers are aggressive and confident.
- Head (Decreasing Volume): Price makes a new high, but participation drops (divergence).
- Right Shoulder (Low Volume): Buying interest evaporates; the bulls are exhausted.
- Breakout (Spike): A surge in volume confirms sellers have taken control.
5.3. Symmetry Between Shoulders (Optional but Ideal)
Although markets are rarely perfect, aesthetic symmetry suggests a more stable pattern. Balanced shoulders indicate an orderly transfer of power from bulls to bears.
- Height: Left and Right Shoulders should peak at roughly the same level.
- Width: The time taken to form both shoulders should be similar.
- Note: If the pattern looks chaotic or lopsided, wait for further confirmation.
5.4. Neckline Strength & Retest Behavior
The neckline is the definitive “line in the sand” for the trade. How price interacts with this level determines your entry timing.
- The Break: A valid trigger requires a candle close below the neckline, not just a wick.
- The Retest: Price often rallies back to “kiss” the neckline. A rejection here confirms resistance and offers the safest entry.
6. How Do You Trade the Head and Shoulders Pattern?
Identifying the pattern is only the first step. To make money, you need a precise execution plan. You can choose between an aggressive entry to catch the full move or a conservative entry to minimize false signals.
6.1. Entry Strategy 1: Neckline Breakout Entry (Aggressive)
Traders fearful of missing a sharp drop often choose the instant breakout entry. It secures a position early but carries a higher risk of entering a false breakdown.
- The Trigger: Open a short position immediately when a candle closes decisively below the neckline.
- The Rule: Avoid entering while the candle is still moving. A long wick rejection could turn the breakdown into a bear trap.
6.2. Entry Strategy 2: Retest Neckline (Conservative & More Reliable)
Waiting for a pullback provides a second chance to enter at a better price. Professional traders favor this method, as it confirms the neckline has flipped from support to resistance.
- The Process: Allow the initial breakout to happen, then wait for the price to rally back up to the neckline.
- The Trigger: Enter short only when a bearish rejection candle (like a Pin Bar or Engulfing pattern) forms at the retest level.
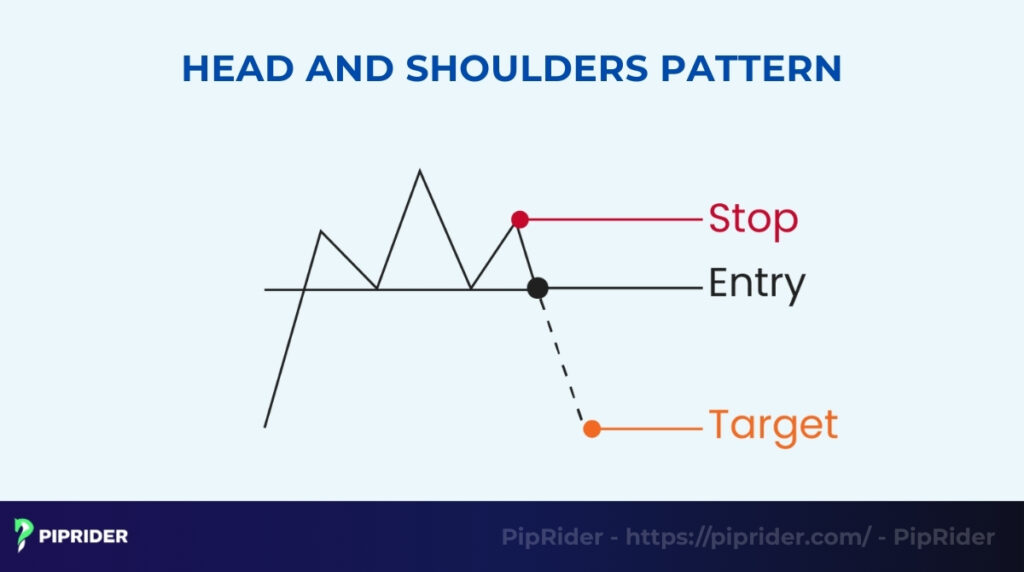
6.3. Stop Loss Placement (Head, Shoulder, ATR)
Risk management determines long-term survival. Your stop loss location depends entirely on your personal risk tolerance and the asset’s current volatility.
- Aggressive (Above Right Shoulder): Place the Stop Loss slightly above the high of the Right Shoulder for a tighter risk-to-reward ratio.
- Conservative (Above Head): Placing the Stop Loss above the Head is safer but requires a smaller position size to maintain proper risk control.
- Dynamic (ATR): Using the Average True Range – ATR indicator helps set a stop that accounts for market noise (e.g., 1.5x ATR above the breakout candle).
6.4. Take Profit Target Using Measured Move Technique
The Head and Shoulders pattern structure offers a precise mathematical target. Traders project the pattern’s height downward to define precise exit points.
- Measurement: Calculate the vertical distance (pips or points) from the peak of the head down to the neckline.
- Projection: Subtract this distance from the breakout point.
- Formula: Take Profit = Neckline Price – (Head High – Neckline Low)
7. What Are Common Traps and False Signals?
Even experienced traders lose money when they force a trade on a bad setup. Recognizing these four common “bear traps” will save you from unnecessary losses and improve your overall strike rate.
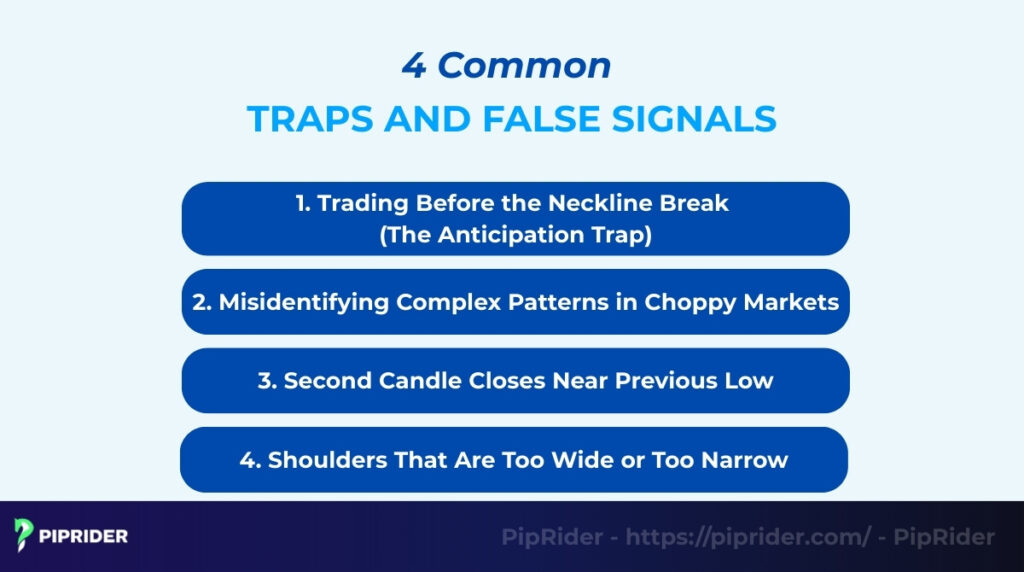
7.1. Trading Before the Neckline Break (The Anticipation Trap)
Novice traders often enter a short position while the Right Shoulder is still forming, hoping to catch the exact top. This is dangerous because the pattern is not confirmed until support breaks.
- Why this is dangerous: The price often hits the neckline and bounces strongly. If support holds, the setup can morph into a continuation pattern, leaving you trapped in a losing short.
- Smart approach: Exercise patience. Never pull the trigger until a daily or 4-hour candle closes decisively below the neckline.
7.2. Misidentifying Complex Patterns in Choppy Markets
The human brain loves to find patterns in random noise. Traders often “hallucinate” a Head and Shoulders in the middle of a messy, sideways consolidation where no clear trend exists.
- The Reality: Without a prior trend to reverse, the formation has no predictive power. Trading here is essentially gambling on noise.
- The Fix: Zoom out. If you cannot see a clear uptrend on the left side of the chart, delete the drawing and move on.
7.3. False Breakout When Volume Is Weak
A breakdown without momentum is a major red flag. If the price slips below the neckline but volume remains low or average, it suggests “Smart Money” is not participating in the sell-off.
- Red Flag: This is often a classic bear trap. Institutional buyers absorb the weak selling pressure below the neckline and then push the price aggressively higher to hunt stop losses.
- Confirmation Rule: Look for a noticeable volume spike on the breakout candle. No volume, no trade.
7.4. Shoulders That Are Too Wide or Too Narrow
Proportionality affects the pattern’s reliability. A setup that looks “stretched” out or tightly “squashed” typically indicates market indecision rather than a clear reversal structure.
- The Problem: If the Right Shoulder takes three times longer to form than the Left Shoulder, the bearish momentum has likely dissipated, making a reversal less likely.
- Solution: Look for symmetry. Ideally, the time duration of the Left and Right Shoulders should be roughly similar for a high-probability trade.
8. Which Indicators Best Confirm the Head and Shoulders Pattern?
Never rely on price action alone. Use this checklist to filter out false signals by combining the Head and Shoulders pattern with technical indicators.
| Indicator | What to Look For | The Signal |
| RSI | Lower High vs Price Higher High | Bearish Divergence |
| MACD | Histogram dropping / Crossing 0 | Momentum Shift |
| Volume | Spike on Breakout | Institutional Selling |
| EMA | Price closing below 20/50 EMA | Structural Trend Break |
To increase your win rate, look for at least two of the following confirmations before pulling the trigger:
- RSI divergence at the head: As the price pushes up to make the highest peak (Head), look at your RSI. If the RSI makes a lower high, it creates a “Bearish Divergence.” This proves the trend is running on fumes.
- MACD momentum shift: Watch the MACD histogram as the Right Shoulder forms. It should be shrinking or flipping below zero. A bearish crossover (Signal line crossing below MACD line) is a strong confirmation.
- Volume spike confirmation: Treat volume as a strict filter. If the price breaks the neckline but volume is low, stay out. You need to see a significant spike in sell volume to confirm that institutions are dumping positions to validate the new bearish trend.
- EMA breakdown: Exponential Moving Averages (like the 50-EMA) often act as dynamic support. A high-probability trade usually sees the neckline break coinciding with a candle closing below the 50-EMA.
9. How Does the Pattern Look in Real Markets?
Theory is useless without application. While the psychology remains the same, each market has unique characteristics. Use this table to adjust your strategy based on the asset class.
| Market | Key Characteristic | Strategy Tip |
| Forex | High Liquidity | Best for “Textbook” Patterns & Retest Entries. |
| Stocks | Gaps & Volume | Watch for Gap Downs and Volume Spikes. |
| Crypto | Extreme Volatility | Beware of long wicks. Wait for Candle Close. |
9.1. Forex Chart Example (EUR/USD)
The Forex market is highly liquid, often creating the cleanest patterns on higher timeframes like the 4-Hour (H4) or Daily.
- The Setup: EUR/USD rallies for three weeks, hitting a resistance zone at 1.1000.
- The Pattern: A clear Left Shoulder forms, followed by a slightly higher Head, and a symmetrical Right Shoulder.
- Execution: Conservative traders wait for the price to break the neckline and tap it from below (Retest). This confirms the reversal with minimal risk.
9.2. Stock Market Example (AAPL – Apple Inc.)
In stocks, volume is the primary confirmation tool. Unlike Forex, stocks often “gap” through price levels.
- The Setup: AAPL hits an all-time high, but volume starts drying up (divergence).
- The Nuance: The neckline often breaks with a Gap Down (opening significantly lower than the previous close).
- Execution: Gaps represent aggressive institutional selling. Traders often enter immediately at the market open, placing a stop loss above the gap.
9.3. Crypto Example (Bitcoin – BTC/USD)
Crypto markets are famous for “fakeouts” and stop hunts.
- The Setup: BTC pumps to a new high, but the RSI shows a massive bearish divergence.
- The Danger: During the Right Shoulder formation, price often spikes up violently to trigger stop losses before crashing.
- Execution: Never trade the wick. A wick poking below the neckline is often a trap. Only a confirmed daily candle close below support validates the short entry.
10. How Does the Head and Shoulders Differ From Other Reversal Patterns?
Confusion leads to bad trades. While many patterns signal a reversal, they have different structures and reliability levels. Use this comparison guide to ensure you are trading the correct setup.
| Pattern | Structure | Key Difference |
| Head & Shoulders | 3 Peaks (Middle is highest) | Right Shoulder is a Lower High. |
| Double Top | 2 Peaks (Equal height) | Looks like the letter “M”. |
| Rising Wedge | Higher Highs + Higher Lows | Price compresses into a narrow cone. |
10.1. Head and Shoulders vs Double Top
These are the two most common bearish reversals, but they tell different stories about buyer exhaustion.
- The Structure: A Double Top consists of two peaks at roughly the same price level. In contrast, a Head and Shoulders must have a middle peak (Head) that is significantly higher than the surrounding shoulders.
- Reliability: The Head and Shoulders is often considered safer. The formation of the Right Shoulder (Lower High) provides an early confirmation that the trend structure is broken before the neckline even breaks.
10.2. Head and Shoulders vs Rising Wedge
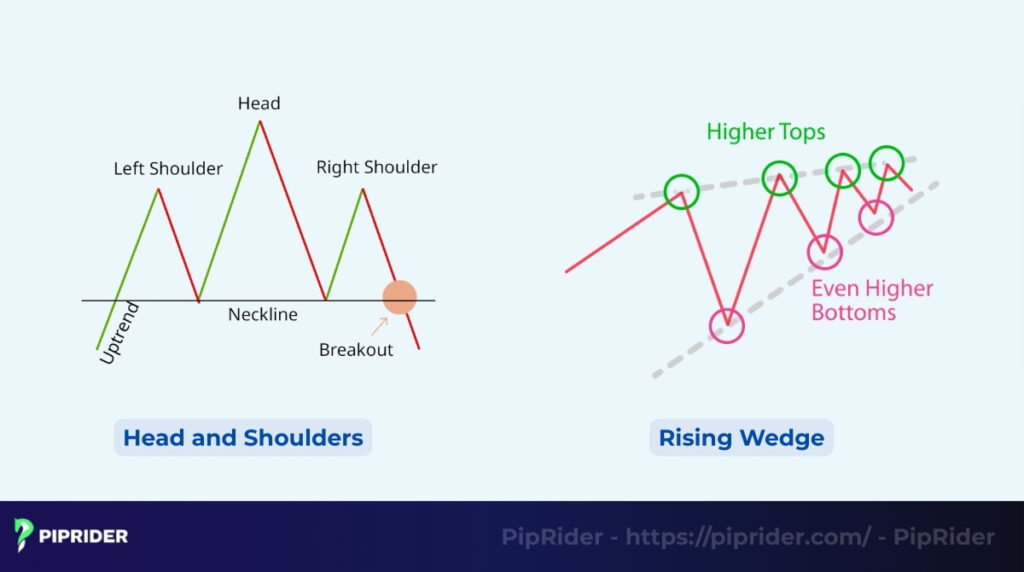
Both patterns appear at the end of uptrends, but their geometry is completely different.
- The Geometry: A Head and Shoulders pattern typically implies a horizontal breakdown. A Rising Wedge is a diagonal pattern where price continues to make higher highs and higher lows, but the range gets tighter (lines converge).
- The Logic: H&S indicates a failed attempt to make a higher high. A Wedge indicates that while prices are rising, the buying pressure is weakening significantly.
10.3. Head and Shoulders vs M-Pattern
The “M-Pattern” is essentially the visual description of a Double Top, but traders often confuse it with a complex Head and Shoulders.
- Visual Check: An M-Pattern has sharp, equal peaks resembling the letter “M”.
- The Trap: If you see a Head and Shoulders where the Right Shoulder rises as high as the Head, the pattern has failed. It has morphed into a Double Top. Do not trade it as an H&S; you must adjust your entry triggers to the Double Top support level.
11. Which Tools Can Automatically Detect the Pattern?
Manual detection takes practice. Save time by using these verified scanners to alert you immediately when a pattern forms.
- TradingView Auto Pattern Recognition: A built-in indicator (“All Chart Patterns”) that highlights Head and Shoulders patterns automatically. Best for beginners to learn visual recognition without complex setup.
- TrendSpider Pattern Scanner: A professional tool that scans multiple time frames simultaneously. It allows you to adjust sensitivity to filter out “messy” patterns and find only high-quality setups.
- MT4/MT5 Pattern Indicators: Plugins like Pattern Graphix or ZUP (available on the MQL5 market) draw necklines and project profit targets directly on your Forex terminal.
AI Chart Pattern Detectors: Advanced platforms like Tickeron or AutoChartist use Machine Learning to not only detect the pattern but also calculate a “Confidence Score” based on historical success rates.
12. Frequently asked questions about Head and Shoulders Pattern
Quick, direct answers to the most common questions regarding the Head and Shoulders pattern.
13. Conclusion
The Head and Shoulders pattern is a reliable reversal signal, but only when traded with discipline. A valid setup requires a decisive neckline breakout confirmed by a volume spike, ensuring that sellers have truly taken control of the market.
To maximize success, filter your trades using RSI divergence or wait for a neckline retest to avoid bear traps. Ready to master the markets? Follow Piprider today for professional insights to stay ahead of market movements. Visit our blog to refine your complete trading strategies.