

Learning how to identify trend in stock market is the most critical skill for a trader. It stops you from buying against the market’s momentum. The easiest way is to use Price Action (looking for “Higher Highs and Higher Lows”) and then confirm the trend with tools like Trendlines and Moving Averages. This guide provides a full, step-by-step plan for mastering trend analysis and finding high-probability setups. While this guide focuses on equities, these trend principles apply across stocks, forex, and indices; only volume characteristics differ by market.
Key Takeaways
- A trend is the primary, overall direction of a stock’s price (Uptrend, Downtrend, or Sideways).
- The main way to identify a trend is with Market Structure (a series of higher highs and higher lows means an uptrend).
- Moving Averages (MAs) and trendlines are the most common tools used to visually confirm the trend’s direction and strength.
- A core pro-tip is multi-timeframe analysis: always check the higher timeframe (HTF) trend (e.g., Daily) before trading on a Lower Timeframe (e.g., H1).
- Identifying the trend is the foundation for all trading strategies, risk management, and finding high-probability setups.
1. The 4 Pillars of Mastering Market Trends: A Strategic Roadmap
To trade with high probability, you must look beyond a single line on a chart. Mastering trend identification requires a holistic approach built on four essential pillars. This roadmap ensures you verify the trend’s direction, strength, and validity before risking capital.
- Pillar 1: Market structure (The foundation): Use price action to identify the sequence of peaks and troughs. This is the “eye test” to confirm if the market is making Higher Highs (HH) or Lower Lows (LL).
- Pillar 2: Technical tools (The confirmation): Apply technical indicators like Moving Averages, Trendlines, and the ADX to filter out noise and confirm the visual trend seen in Pillar 1.
- Pillar 3: Multi-timeframe analysis (The big picture): Ensure the short-term move aligns with the long-term “dominant flow.” Never trade a 1-hour uptrend that is crashing into a daily downtrend.
- Pillar 4: Participation & Strength (The fuel): Use Volume and Breadth to see if professional money is supporting the move. A trend without volume is a “fakeout” waiting to happen.
2. What Is a Trend in the Stock Market?
A market trend refers to the general direction in which the price of a stock or asset is moving over time, which is visually identified by connecting a series of price peaks and troughs. Price movements rarely move in a straight line; instead, they move in zig-zags, like waves in the ocean.
According to Investopedia (2025), identifying market trends via accurate trend analysis is the first step in technical analysis. It helps investors assess potential movements and trade with the market momentum rather than against it.
2.1. The Three Types of Trends
Markets can only move in three directions. Recognizing which state the market is in will dictate your strategy.
- Uptrend (bullish): The price is making a series of higher highs and higher lows. Demand is stronger than supply, pushing prices up.
- Downtrend (bearish): The price is making a series of lower highs and lower lows. Supply exceeds demand, pushing prices down.
- Sideways (consolidation): The price moves horizontally within a specific range. This sideways trend means there is no clear winner between buyers and sellers, and the price is often “stuck” between support and resistance.
2.2. Trend Lengths (Dow Theory)
Effective trend analysis requires recognizing that trends exist on multiple timeframes simultaneously. Dow Theory classifies trends into three main categories (Hayes, 2025):
- Short-term trend: Lasts from a few days to a few weeks. Day traders focus here.
- Intermediate trend: Lasts from several weeks to a few months. Swing traders usually operate in this zone.
- Long-term trend (Secular): Lasts for months or even years. This is the primary focus for investors.
Application tip: Match your primary analysis timeframe to your trading goal. Swing traders should focus on the Daily (D1) or 4-hour (H4) charts to identify the intermediate trend, while long-term investors should prioritize Weekly (W1) or Daily (D1) charts to stay aligned with the secular trend.
2.3. Trend vs. Market Noise
It is vital to distinguish between a true trend and market noise. A trend is a sustained, directional move. Traders often use statistical measures to filter out the random, daily price fluctuations caused by minor news or volatility. Focusing too much on short-term noise can lead to false signals and poor decisions.
3. Why Does Identifying the Trend Matter?
Identifying the market trend is not just a technical skill; it is a survival mechanism. Proper trend analysis acts as a primary filter, allowing you to ignore low-quality setups. This ensures you focus only on opportunities where the market momentum is on your side, significantly reducing investment risks.
- Helps you buy at the right time: Trend analysis solves the problem of timing. Instead of guessing, you learn to buy the “dip” (pullback) in an uptrend and sell the “rally” in a downtrend.
- Avoids trading against market direction: Fighting the market is the fastest way to lose capital. Recognizing the trend stops you from trying to catch the bottom of a falling stock (“catching a falling knife”) and keeps you aligned with the dominant money flow.
- Improves risk management: Knowing the trend structure gives you a logical place to put your stop-loss. If you are in an uptrend, your stop-loss simply goes below the previous “Higher Low”.
- Increases probability of profit: Trading with the current flow puts the statistical odds in your favor. Successful trading strategies based on trend-following require less precision to work and are more likely to hit profit targets than counter-trend gambles, which is why many professionals apply a trend-following approach to indices to capture broad market moves.
4. How to Identify Trend In Stock Market Using Price Action
The most accurate way to perform trend analysis is by observing the market structure directly on the chart. This “Eye Test” method requires no indicators, only the ability to spot the peaks and valleys of price movements.
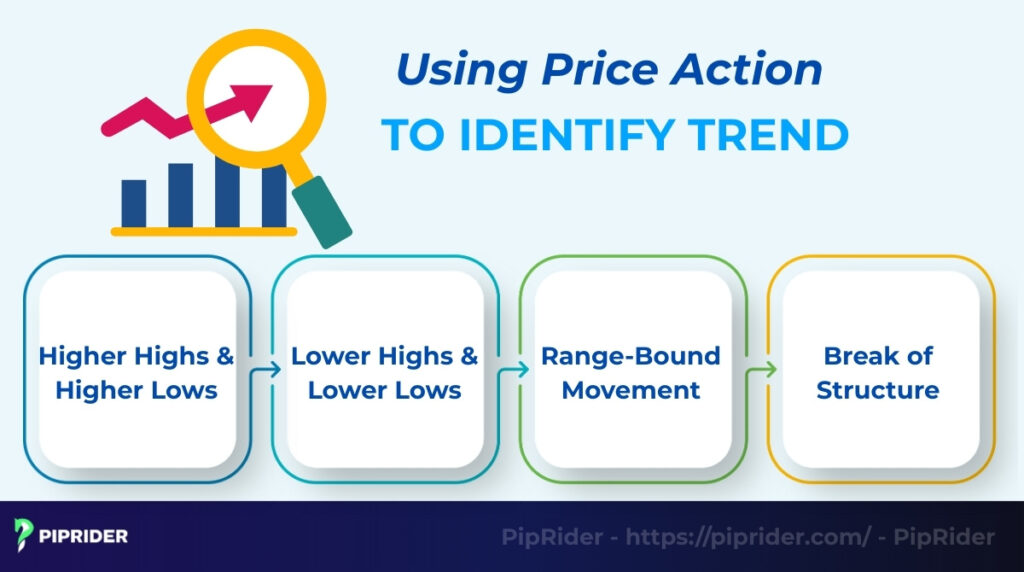
4.1. Higher Highs & Higher Lows (Uptrend Structure)
An uptrend is defined by a specific pattern where buyers are consistently willing to pay higher prices.
- Higher high (HH): Each new peak reached is higher than the previous one.
- Higher low (HL): Each pullback (the “trough”) stops at a price higher than the previous pullback. As long as the price continues to form higher lows, the uptrend is considered intact.
4.2. Lower Highs & Lower Lows (Downtrend Structure)
A downtrend is the inverse, signaling a series of falling steps where sellers are in control.
- Lower low (LL): Each new drop in price goes deeper than the previous one.
- Lower high (LH): Each rally (minor price increase) fails to reach the height of the previous peak.
4.3. Range-Bound Movement (Sideways Market)
When the market stops making clear higher highs or lower lows, it enters a sideways trend or consolidation.
- The price bounces between a clear resistance level (the ceiling) and a support level (the floor).
- In this phase, there is no clear trend. The highs and lows are roughly equal, signaling a balance between buyers and sellers.
4.4. Break of Structure (When Trend Changes)
Identifying when a trend is ending is as important as finding its start. You look for a Break of Structure (BOS).
- Uptrend reversal: The price fails to make a new higher high and subsequently breaks below the previous higher low.
- Downtrend reversal: The price stops making new lower lows and breaks above the previous lower high. This break is often the first major warning signal that the dominant direction is changing.
5. How to Identify Trend In Stock Market Using Technical Indicators
While Price Action is subjective, technical indicators offer objective statistical measures to confirm your perspective. They process price data to help reveal the underlying direction of the market, acting as a secondary filter for your trend analysis.
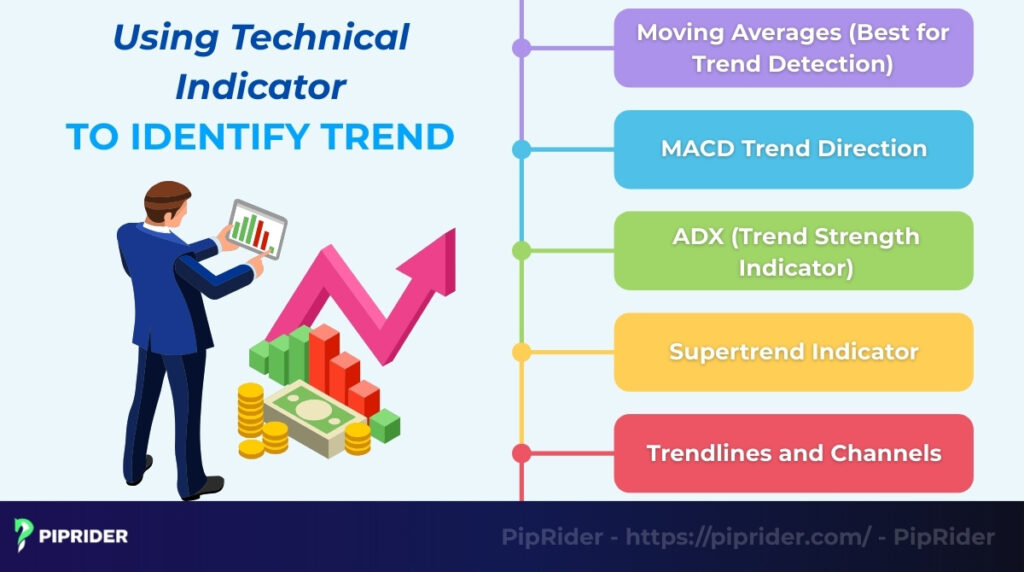
5.1. Moving Averages (Best for Trend Detection)
Moving Averages (MA) are among the most popular tools for identifying trends. They smooth out price fluctuations to show the average price over a specific period:
- 20-period MA: Often used to track short-term momentum.
- 50-period MA: Generally used to track the medium-term trend.
- 200-period MA: Widely regarded as the indicator for the long-term or “secular” trend.
- Crossovers: A strong buy signal, known as the golden cross as a trend signal, occurs when a shorter-term MA (like the 50) crosses above a longer-term MA (like the 200), suggesting a bullish shift. Conversely, a “Death Cross” occurs when the shorter MA crosses below the longer MA, indicating a bearish shift.
5.2. MACD Trend Direction
The MACD (Moving Average Convergence Divergence) is a momentum-following trend indicator. It helps traders assess the strength and speed of a price move.
- Signal Line Crossovers: When the MACD line crosses above its signal line, it suggests bullish momentum.
- Zero-Line Cross: When the MACD lines move above the zero line, it generally confirms that the broader trend has shifted from bearish to bullish territory.
5.3. ADX (Trend Strength Indicator)
The Average Directional Index (ADX) is unique because it measures the strength of a trend regardless of its direction.
- ADX > 25: Suggests a strong, established trend is present.
- ADX < 20: Suggests a weak trend or a market in consolidation. Trend-following strategies typically perform better when the ADX is rising above 25.
5.4. Supertrend Indicator
The Supertrend is a popular visual indicator that overlays a trend line directly on the price chart. It changes color based on the current trend direction:
- Green Line: Generally indicates the price is in an uptrend.
- Red Line: Generally indicates the price is in a downtrend.
5.5. Trendlines and Channels
These manual tools help define the boundaries of price movement:
- Trendlines: Connect a series of higher lows (in an uptrend) or lower highs (in a downtrend) with a straight line, as drawing trend lines to define the trend is a fundamental skill for any technical analyst. A sustained break below an uptrend line or above a downtrend line can indicate a potential reversal.
- Channels: Created by drawing a parallel line to the trendline. Channels define a corridor for price action, helping traders identify logical support and resistance zones within an active trend.
6. How to Confirm Trend with Multi-Timeframe Analysis
Analyzing a single timeframe can lead to a narrow perspective. Multi-timeframe analysis involves looking at the same asset across different time horizons to ensure the short-term direction aligns with the long-term trend.
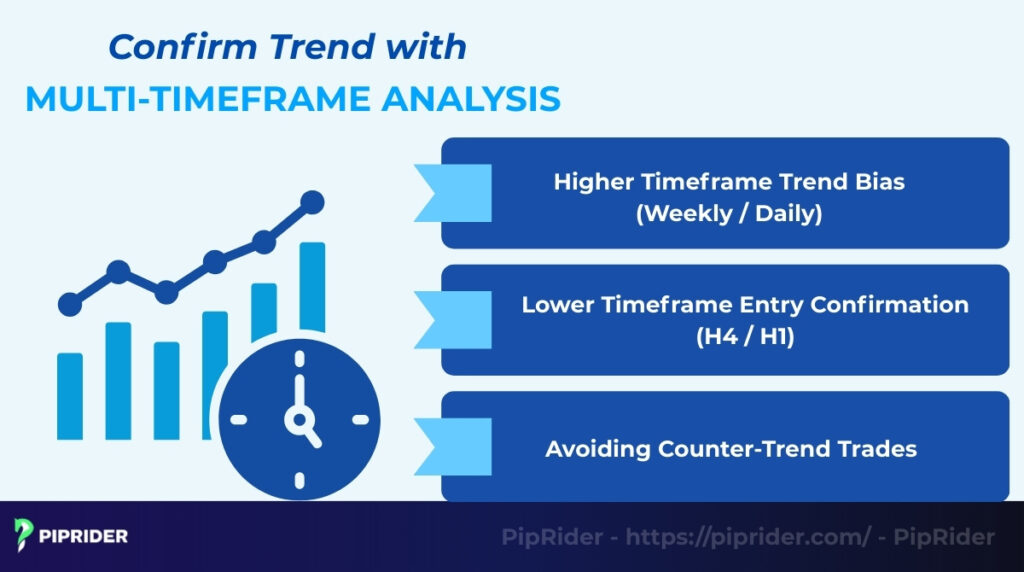
6.1. Higher Timeframe Trend Bias (Weekly / Daily)
Always begin your analysis on a higher timeframe (HTF), such as the weekly or daily chart. This establishes the “dominant flow” of the market.
- If the daily chart shows a clear uptrend, your primary bias should be bullish.
- The goal at this stage is to determine the general direction, not to find a specific entry point.
6.2. Lower Timeframe Entry Confirmation (H4 / H1)
Once the HTF bias is established, zoom into a lower timeframe (LTF), like the 4-hour or 1-hour chart, to find high-probability entries.
- Optimal entries often occur when the LTF trend aligns with the HTF trend.
- For example, if the Daily trend is bullish, a trader might wait for a temporary pullback on the 1-hour chart to conclude and for the 1-hour price action to turn bullish again before entering.
6.3. Avoiding Counter-Trend Trades
This hierarchical approach is a key risk management tool. It prevents traders from entering positions that are fighting the larger market momentum.
- A bullish pattern on a 5-minute chart may seem attractive, but if the Daily and Weekly charts are in a severe downtrend, that short-term signal is statistically more likely to fail.
- Aligning your trades with the higher timeframe helps you stay on the side of the major market participants.
7. How Does Volume Confirm a Trend?
Price tells you what is happening, but volume reveals the level of participation behind the move. According to StockCharts.com (2024), performing volume analysis acts as a “fuel gauge” for your trend analysis. Without sufficient participation, a price move is often at higher risk of being a “fakeout”.
- Confirmation (Increasing volume): In a healthy trend, volume typically moves in alignment with the price trend. In an uptrend, higher volume on upward price days suggests stronger participation in the direction of the trend. This indicates that the current move is supported by a broad range of market participants.
- Warning sign (Decreasing volume): If the price continues to make new highs but volume is declining, it serves as a warning. It suggests that demand may be drying up and fewer participants are willing to buy at higher prices, which often precedes a trend exhaustion or reversal.
- Volume divergence (Fakeouts): Divergence occurs when price action and volume levels disagree. For example, if the price breaks out to a new high on very low volume, it suggests the move lacks conviction. Low volume on a breakout serves as a warning sign of weak participation, increasing the probability that the breakout is false.
8. Advanced Trend Identification (Pro-Level Techniques)
Once you master the basics, you can use advanced methods to see deeper into the market’s mechanics. These techniques help you understand why the trend is happening and where the big money is going, allowing you to anticipate market conditions and assess probability.
8.1. Market Phases (Wyckoff Method)
The Wyckoff methodology focuses on the cycle of accumulation and distribution driven by large operators. As detailed by Wyckoff Analytics (2024), recognizing which of the four distinct phases the market is in – Accumulation, Markup, Distribution, or Markdown, helps traders align with the long-term cycle before a trend becomes obvious to the retail public.
8.2. Market Sentiment Indicators
Sentiment indicators measure the psychological state of market participants to identify potential trend exhaustion. Common tools include the Fear & Greed Index, the Put/Call ratio for options activity, and Breadth indicators like the advance-decline line, which confirms if a majority of stocks are supporting a price move.
8.3. Institutional Order Flow (Smart Money Concepts)
Smart Money Concepts (SMC) focus on tracking institutional footprints through price action “anomalies”. Key elements include identifying the Change of Character (CHoCH) for potential reversals, using Fair Value Gaps (FVG) as price magnets, and locating Premium or Discount zones to ensure entries align with institutional value.
9. What Are Common Mistakes When Identifying Trends?
Even with the right tools, identifying a trend in real-time is challenging. Many traders lose money not because they lack the tools, but because they fall into psychological and technical traps.
- Analysis paralysis (Too many indicators): Cluttering your chart with five different indicators often leads to conflicting signals. If two indicators say “buy” and three say “wait,” you miss the move. Keep your chart clean to see price action clearly.
- Subjective charting: A common mistake is forcing a trendline to fit your personal bias by connecting random price wicks. Trendlines should follow strict rules, connecting major swing points to be valid.
- Recency bias (Small timeframes): Zooming in too close on a 1-minute or 5-minute chart can create the illusion of a trend that doesn’t exist. Ignoring the “Big Picture” (Higher Timeframes) leads to getting caught in market noise.
- Chasing the move (FOMO): Buying after the trend has already moved significantly increases your risk. Entering late usually means buying at the exact moment professional traders are taking profits.
- Ignoring confirmation: Anticipating a trend change before it happens is effectively gambling. Never assume a trend is over until you see a clear Break of Structure (BOS) or a trendline violation.
10. What Do Real Trend Examples Look Like on Stock Charts?
Applying trend analysis to real historical data helps clarify theory. The following examples show how professional traders analyze the market using concrete data points.
10.1. Example 1: The Uptrend (AAPL)
- Timeframe: Daily Chart
- Date Range: May 2024 – July 2024
- Context: After a period of consolidation, Apple (AAPL) broke out following positive earnings sentiment, initiating a classic uptrend.
- Structure: Price consistently formed Higher Highs and Higher Lows while staying above a rising 50-day EMA.
- Sample Setup (Illustrative):
- Entry: ~$192.00 (Breakout retest of previous resistance).
- Stop-Loss (SL): ~$182.00 (Placed below the most recent Higher Low).
- Take-Profit (TP): ~$225.00 (Trailing stop based on the 50-day EMA).
10.2. Example 2: The Downtrend (TSLA)
- Timeframe: Daily Chart
- Date Range: January 2024 – April 2024
- Context: Tesla (TSLA) experienced a sustained bearish phase characterized by selling pressure and negative delivery outlooks.
- Structure: A series of Lower Lows and Lower Highs developed, with the 200-day Moving Average acting as a “ceiling” that price could not break.
- Sample Setup (Illustrative):
- Entry: ~$210.00 (Rejection at the downward-sloping 50-day EMA).
- Stop-Loss (SL): ~$225.00 (Placed above the recent Lower High).
- Take-Profit (TP): ~$150.00 (Targeting major historical support levels).
10.3. Example 3: The Sideways Market (NVDA)
- Timeframe: Daily Chart
- Date Range: March 2024 – May 2024 (Post-Split Adjusted)
- Context: Before its massive pre-split rally, Nvidia (NVDA) spent several weeks in a horizontal “Base” or consolidation range.
- Structure: Price oscillated between a clear resistance level (~$95.00) and support level (~$76.00). Momentum indicators like the MACD remained flat.
- Sample Setup (Illustrative):
- Entry: Buy at ~$78.00 (Bottom of the range) or wait for a breakout above ~$96.00.
- Stop-Loss (SL): ~$73.00 (Placed just outside the range boundary).
- Take-Profit (TP): ~$94.00 (Targeting the top of the resistance zone).
11. What Are the Best Tools to Identify Trend in Stocks?
While experienced traders can identify trends with the “eye test,” modern software offers speed and objective confirmation. Below are the top tools used by industry professionals for efficient trend analysis:
- TradingView (Best for comprehensive charting): The industry standard for technical analysis. It allows you to create custom scanners, draw trendlines, and overlay automated indicators like Moving Averages or MACD to confirm direction across any asset class.
- MarketSmith (Best for institutional growth ratings): Created by Investor’s Business Daily, this tool is geared toward growth investors. It provides proprietary “Trend Ratings” and relative strength rankings, helping you quickly identify stocks in healthy long-term uptrends backed by institutional buying.
- TrendSpider (Best for automated analysis): Ideal for traders who want to remove subjectivity. TrendSpider uses AI to automatically detect trendlines, identify support/resistance zones, and alert you to “Break of Structure” events based on historical data.
- Finviz (Best for high-speed screening): A powerful, web-based screener used to filter thousands of stocks instantly. You can easily find “Stocks above the 200-day Moving Average” or stocks with specific “Golden Cross” setups, making it essential for spotting emerging sector trends.
12. Frequently asked questions about identifying trends in stock market
12. Conclusion
The trend is the foundation of all successful trading. Learning how to identify trend in stock market is the first step to becoming a profitable trader.
By filtering out market noise and aligning your decisions with dominant momentum, you significantly tilt the odds in your favor. Remember the two-step confirmation process: start with the “Eye Test” (Market Structure), then verify using objective tools like Moving Averages and Volume. Always respect the Higher Timeframe bias to ensure you are trading with the “Smart Money.”
Ready to refine your strategy and start analyzing charts like a professional? Explore the free guides and trading strategies at Piprider to sharpen your skills today.


