
Learning how to trade the Dow Index involves speculating on the price movement of 30 major US blue-chip companies. This guide breaks down what the Dow is and the key factors that move its price. Piprider will explore the different ways to trade it (like CFDs, futures, and ETFs), and cover simple strategies combined with the critical risk management rules every trader must know.
Key Takeaways
- The Dow Jones (DJIA/US30) is a stock index tracking 30 large US blue-chip companies.
- It offers high liquidity and volatility, making it popular for day traders, especially during the US session.
- Price is driven by US economic data (Fed, CPI, NFP) and the earnings of its major components.
- Common ways to trade it include CFDs (US30), ETFs (DIA), and futures contracts.
- Strict risk management (stop-losses, position sizing) is essential due to the index’s high volatility.
1. What Is the Dow Jones Industrial Average (DJIA)?
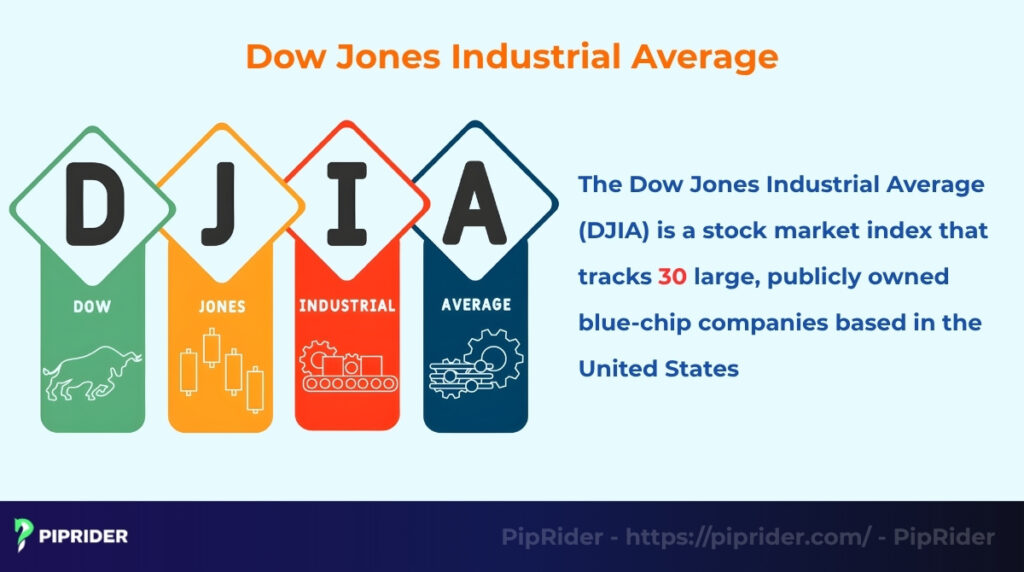
The Dow Jones Industrial Average (DJIA), often called simply “the Dow,” is a stock market index that tracks 30 large, publicly-owned blue-chip companies based in the United States (S&P Dow Jones Indices, n.d.). It is one of the oldest and most-watched indexes, acting as a key barometer for the health of the U.S. economy and overall global market sentiment.
The index includes companies from major sectors like technology, finance, healthcare, and consumer goods. A key feature of the Dow is its price-weighted structure. As a price-weighted index, this means stocks with higher share prices have a greater impact on the index’s movement.
For example, a $10 move in a high-priced stock like UnitedHealth Group will move the index far more than a $10 move in a lower-priced stock like Walgreens.
2. Why Do Traders Trade the Dow Index?
Traders are drawn to the Dow Index because it offers a powerful combination of liquidity, volatility, and accessibility.
- High liquidity: The Dow is one of the most heavily traded indexes globally. Traders can (in most conditions) enter and exit positions easily with tighter spreads, especially when trading CFDs (US30) or futures.
- Volatility & opportunity: The index is known for its strong price movements, particularly during the US market session, which creates short-term opportunities for day traders and swing traders.
- Diversified exposure: Trading a single Dow position provides instant exposure to 30 of the largest US companies. This allows you to trade the overall market sentiment rather than risking exposure to a single stock.
- Wide availability: The index is accessible to nearly everyone. You can trade it through various instruments, including CFDs (US30), ETFs (like DIA), futures contracts (YM), and options.
3. What Moves the Dow Jones Index?
The DJIA moves based on a mix of major macroeconomic factors, company performance, and overall market sentiment.
- Economic data releases: The index is highly sensitive to key US economic reports. This includes inflation data (CPI), GDP growth, Non-Farm Payrolls (NFP) employment numbers, and especially the Fed’s interest rate decisions.
- Earnings season: Since the Dow is price-weighted, strong or weak earnings reports from its most expensive component stocks (by price, not market capitalization) can heavily influence the entire index.
- Global sentiment: The Dow is a barometer for global risk appetite. Major geopolitical factors or international market volatility often trigger risk on risk off (bullish or bearish) behavior that directly impacts the index.
- U.S. Dollar strength: There is often an inverse relationship between the Dow and the US Dollar. A stronger dollar can sometimes hurt the profits of large multinational US companies (which make up the Dow), potentially putting pressure on the index.
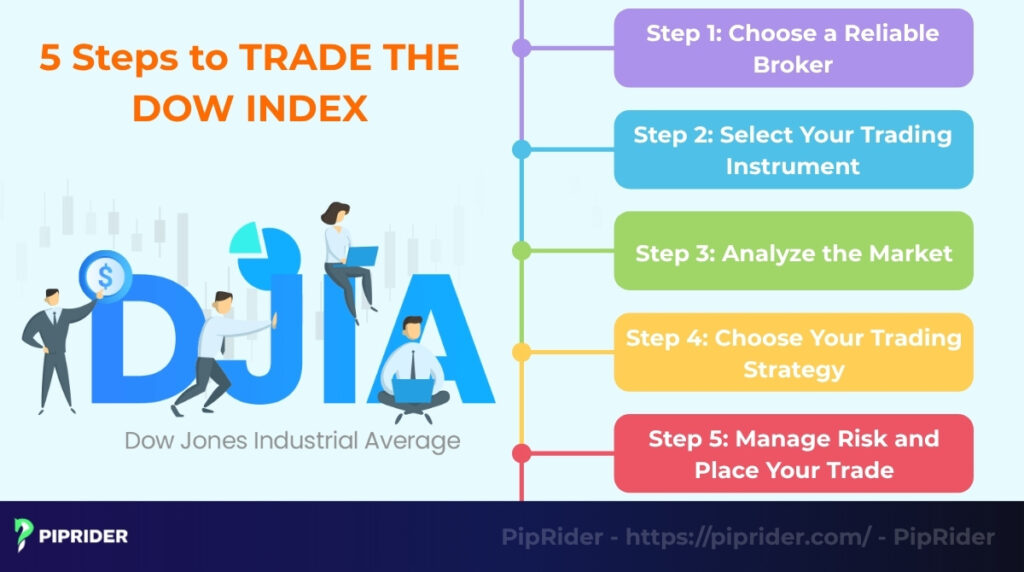
4. How to Trade the Dow Index: A Step-by-Step Guide
To start learning how to trade the dow index, you first need to choose a reliable broker, select your trading instrument (like CFDs, futures, or ETFs), analyze the market, pick a strategy, and finally, manage your risk by placing the trade with a stop-loss.
4.1. Step 1: Choose a Reliable Broker
Your broker is your gateway to the market, so this step is critical. Look for a well-regulated broker that has a strong reputation and a stable trading platform. When trading the Dow, prioritize brokers that offer low spreads, reasonable leverage, and clear support for the index, often under the symbol US30 or DJ30 CFD.
4.2. Step 2: Select Your Trading Instrument
After choosing a broker, you must decide how you will trade the Dow. There are several financial instruments available, and each one is designed for a different trading style, timeframe, and capital level.
- Dow Jones Futures (YM): These are large, standardized contracts traded on an exchange, typically favored by professional, high-volume traders.
- Dow Jones ETFs (DIA): An Exchange-Traded Fund (like the DIA) is a specialized investment vehicle that holds all 30 stocks in the index, offering one of the most stable ETF alternatives to trading the Dow directly for long-term investors. This is best suited for long-term investing, which often involves investment strategies like a protective put or covered call, rather than active, short-term trading or short selling.
- Dow CFDs (US30): Contracts for Difference (CFDs) are popular derivatives and the most popular instrument for retail day traders. They allow you to speculate on the price (long or short) with smaller contract sizes and flexible leverage.
4.3. Step 3: Analyze the Market
Successful trading is not about guessing; it’s about building a thesis. A solid trade setup combines both fundamental and technical analysis to get a complete picture of what the market is doing and why.
- Technical Analysis: Use chart tools like trendlines, moving averages (EMAs/SMAs), and oscillators like the RSI or MACD to identify the current trend, momentum, and potential entry/exit levels.
- Fundamental Analysis: Stay aware of the factors that move the index, such as Fed news, inflation reports (CPI), and major earnings announcements from Dow components.
4.4. Step 4: Choose Your Trading Strategy
Your analysis will inform your strategy. Decide on a timeframe that fits your goals and schedule. Common strategies include:
- Scalping: Making many small trades on tiny price moves within minutes.
- Day Trading: Opening and closing trades within the same day, often holding for hours.
- Swing Trading: Holding trades for several days or weeks to capture a larger “swing” in the price.
- Long-Term Investing: Primarily done by buying and holding ETFs like the DIA.
4.5. Step 5: Manage Risk and Place Your Trade
This is the most important step for long-term success. Before you enter a trade, you must know your exit plan.
Define your entry price, your stop-loss (the price at which you will cut your loss), and your take-profit target. A core rule of risk management is to keep your risk per trade to 1-2% (or less) of your total trading capital.
5. What Are Popular Dow Jones Trading Strategies?
Part of learning how to trade the dow index involves using simple, repeatable strategies that align with your trading style. These can range from following the main trend to trading short-term news reactions, or even incorporating intermediate index trading strategies to refine your market entries.
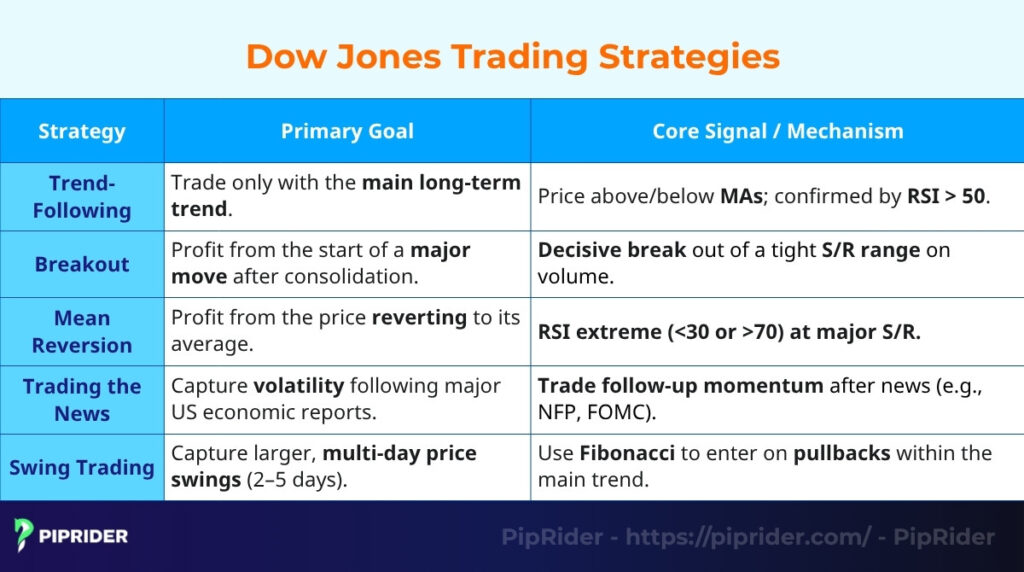
5.1. The Trend-Following Strategy
A trend-following strategy is one of the most common approaches. The goal is to identify the dominant daily or hourly trend and only trade in that direction.
- Buy Signal: The price is trading above the 50-period and 200-period EMAs (Exponential Moving Averages), and the RSI is above 50, signaling bullish momentum.
- Sell Signal: The price breaks below a key rising trendline, or the RSI drops below 50, suggesting the upward momentum is fading.
5.2. The Breakout Strategy
A breakout strategy involves identifying a consolidation range (a “box”) or a key support/resistance level and placing a trade when the price “breaks out.”
You wait for the Dow to trade in a tight range and then buy or sell as it breaks decisively out of that range. The most reliable breakouts are confirmed by a sudden increase in trading volume.
5.3. The Mean Reversion (Rebound) Strategy
Working on the opposite principle of trend-following, mean reversion assumes that when the price moves too far, too fast, it will eventually “revert” back to its average (or “mean”).
- Buy Signal: Look to buy when the Dow falls sharply to a major support level or the RSI drops below 30 (oversold).
- Sell Signal: Look to sell (or take profit) when the price rallies to strong resistance or the RSI moves above 70 (overbought).
5.4. Trading the News
The Dow reacts strongly to major US economic news. A news-trading strategy involves capturing the volatility after these reports are released.
Key events to watch include the FOMC (Fed interest rate decisions), CPI (inflation), and NFP (Non-Farm Payrolls). A common tip is to avoid placing trades seconds before the news, as spreads can widen significantly. It is often safer to wait for the initial spike and then trade the follow-up momentum.
5.5. Swing Trading the Dow
Swing trading is ideal for traders who prefer to hold positions for 2-5 days to capture a larger “swing” in the price.
A popular technique for swing traders is to identify the primary trend (e.g., a daily uptrend) and then use a tool like Fibonacci retracement to find entry points on “pullbacks” or dips within that trend.
6. What Is the Best Time to Trade the Dow Jones?
The best time to trade the Dow Jones is when the market has the highest volatility and volume, which primarily occurs during the U.S. and London trading sessions.
- The U.S. Session (20:30 – 03:00 GMT+7): This is the most active and volatile period. It includes the New York Stock Exchange opening, major news releases, and maximum participation from U.S. traders.
- The London Session (14:00 – 18:00 GMT+7): This session leads into the U.S. open. Volume begins to pick up, and traders often see the market “prepare” or signal its potential direction for the main U.S. session.
- Quiet Hours (Approx. 03:00 – 13:00 GMT+7): It is generally best to avoid trading during these times. After the U.S. market closes and before the European session begins, liquidity is very low, which can lead to wide spreads and unpredictable price spikes.
7. What Are the Most Useful Technical Indicators for Dow Trading?
While countless indicators exist, Dow traders often rely on a core set to identify trends, measure momentum, and gauge volatility.
- Moving Averages (EMA20, EMA50, EMA200) are primarily used to identify the main trend. When the price is above the 50-period and 200-period EMAs, the long-term trend is considered bullish. The shorter-term 20-period EMA is often used by day traders as a dynamic support or resistance level.
- MACD & RSI are momentum oscillators used to find potential reversal points. The RSI (Relative Strength Index) identifies overbought (above 70) and oversold (below 30) conditions. The MACD (Moving Average Convergence Divergence) helps spot changes in the strength and direction of a trend.
- Bollinger Bands are placed above and below a moving average. When the bands tighten (a “squeeze”), it signals low volatility and a potential for a future breakout. When the price touches or breaks outside the bands, it can signal an overextended move.
- ATR (Average True Range): The ATR indicator is a pure volatility indicator. It doesn’t show direction but is critical for risk management. It shows the average price range of the Dow over a set time, which is essential for setting a reasonable stop-loss that won’t get triggered by normal market noise.
8. How Do You Manage Risk When Trading the Dow?
Due to its high volatility, managing risk is critical when trading the Dow. A key part of how to trade the dow index safely is protecting your capital by focusing on position sizing, stop-loss placement, and avoiding overtrading.
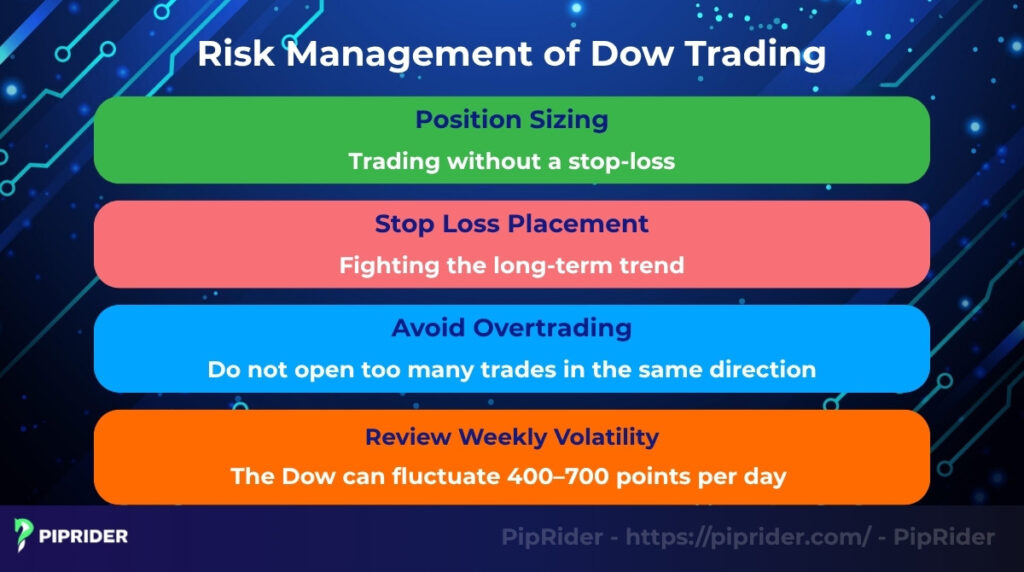
8.1. Position Sizing
Your goal is to calculate your position size (like lot size in CFDs) so that a single loss only costs you 1-2% of your total trading capital. This rule ensures that a single bad trade, even on a volatile day, cannot wipe out your account.
8.2. Stop-Loss Placement
Never trade the Dow without a stop-loss. A well-placed stop-loss is based on the market’s structure, not a random number.
- Place your stop just below the nearest support zone (for a long trade) or above the nearest resistance (for a short trade).
- Alternatively, use the ATR (Average True Range) indicator. A common method is to set your stop at 1.5 times the ATR value away from your entry price.
8.3. Avoid Overtrading
It’s easy to get caught up in the Dow’s fast movements. Avoid overtrading by sticking to your plan. This also means not opening too many positions in the same direction (e.g., five different “buy” trades). If the market reverses, all your positions will lose at once.
8.4. Review Weekly Volatility
The Dow’s volatility changes. On a quiet day, it might move 200 points; on a news day, it can easily move 400-700 points or more. You must adjust your position size to account for this. On high-volatility days, your position size should be smaller to keep your dollar risk at the 1-2% level.
9. What Does an Example Dow (US30 CFD) Trade Setup Look Like?
Seeing a hypothetical trade setup can help tie all these concepts together. This example uses a breakout strategy on the 1-Hour (1H) chart for the US30 CFD.
- Instrument: US30 CFD
- Timeframe: 1-Hour Chart
- Strategy: Technical Breakout
- Confirmation: The RSI is above 50 (showing bullish momentum) AND the 20-period EMA has just crossed above the 50-period EMA (a bullish “golden cross” signal).
- Entry: Place a Buy order at 34,000 as the price breaks a key resistance level.
- Stop Loss: Place the stop-loss at 33,850 (a 150-point risk).
- Take Profit: Place the take-profit target at 34,300 (a 300-point reward).
This setup provides a clear 1:2 Risk-to-Reward (R:R) ratio, meaning the potential profit is twice the potential loss. The trade is only taken because multiple indicators (RSI, EMA cross, and a resistance break) confirm the bullish signal.
10. What Are the Most Common Mistakes When Trading the Dow?
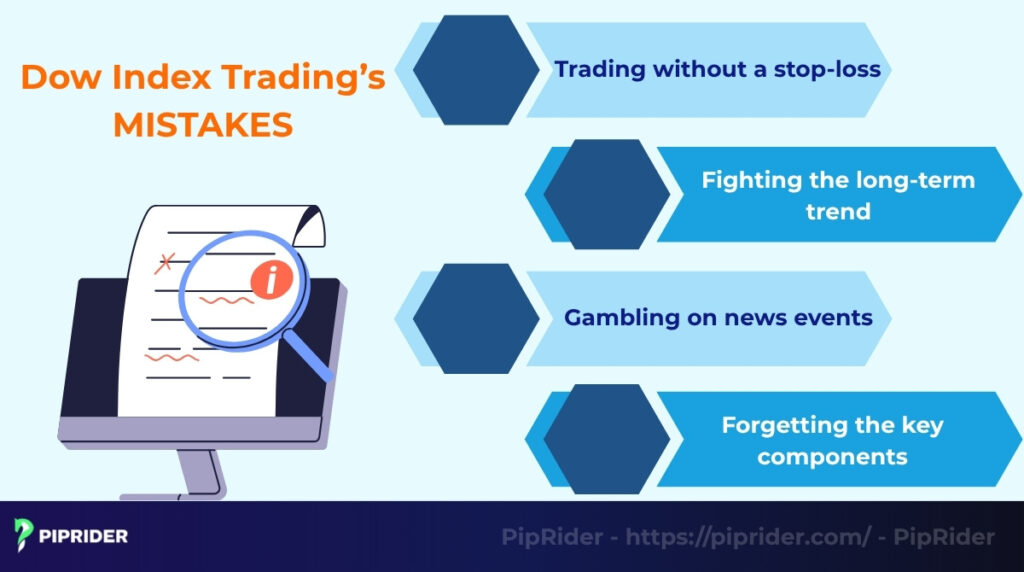
The most common mistakes DJIA traders make are failing to use a stop-loss, trading against the dominant long-term trend, gambling on news events without a plan, and ignoring the influence of the Dow’s key component stocks.
- Trading without a stop-loss: This is the fastest way to lose significant capital. The Dow can move hundreds of points in minutes, especially on news days. A single unexpected spike can blow up an account if there is no stop-loss to protect it.
- Fighting the long-term trend: Day traders often get caught trying to short a powerful, long-term bull market (or buy a bear market). It’s much easier to trade with the dominant daily or weekly trend than to try and catch the exact top or bottom.
- Gambling on news events: Entering a large position seconds before a major CPI or FOMC announcement is a gamble, not a strategy. The volatility is extreme, spreads widen, and the price can gap instantly in either direction.
- Forgetting the key components: The Dow is a price-weighted index. A massive price move in a high-priced stock like Apple (AAPL), Microsoft (MSFT), JPMorgan (JPM), or Johnson & Johnson (JNJ) can move the entire index on its own.
11. Frequently asked questions about Trading The Dow Index
12. Conclusion
The Dow Jones Industrial Average is a cornerstone of global trading, offering the high volatility, deep liquidity, and significant opportunities that traders seek.
By combining a solid technical strategy, disciplined risk management, and a clear understanding of the US market, you can learn how to trade the Dow Index effectively and sustainably.
For more trading guides and market analysis, be sure to follow Piprider. Do you have a question about this guide or a favorite Dow strategy you want to share? Leave a comment below and join the discussion!


