
Pivot Point constitutes a fundamental yet powerful technical analysis tool designed to identify potential support and resistance levels in the market. By utilizing the high, low, and closing prices of the preceding trading session, Pivot Points furnish critical reference markers that help traders determine the trend bias and systematically plan their trades.
This comprehensive guide will show you how to master the formulas, choose the right variation for your style, and implement three high-probability strategies to set confident stop-loss and take-profit targets.
Key Takeaways
- Pivot points are calculated in advance to identify potential support and resistance areas in stock, and other markets.
- From day trading to swing trading, this tool remains a core element in many strategies.
- Popular variations include Classic, Woodie, Camarilla, and Fibonacci, each with unique calculation methods and market applications.
- The indicator for MT4 comes as a built-in or custom tool, making it easy to add to charts without manual calculations.
- In stock market trading, they help traders plan entries, exits, and stop-losses with greater precision than subjective resistance drawing.
1. What is the pivot point in trading?
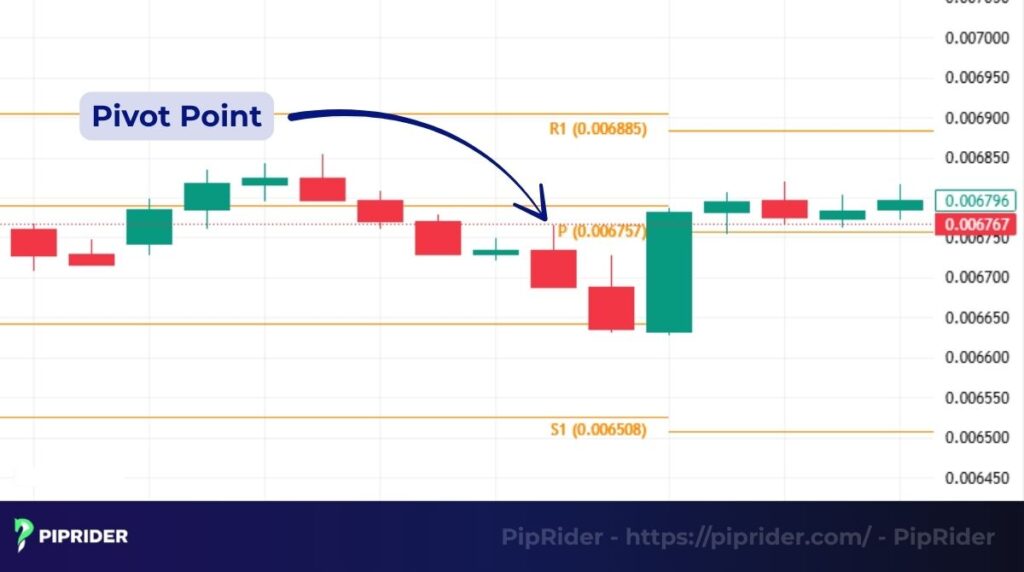
A pivot point is a key technical analysis indicator that helps identify the overall market trend across various time frames. It is calculated by averaging the previous session’s high, low, and close, then projecting these levels into the current session to highlight possible support and resistance areas (Investopedia, 2024).
1.1. How they started in trading
Pivot points originated on the trading floors of stock exchanges, where floor traders needed a quick way to identify price levels of interest without using complex charts. Over time, this method evolved into a reliable technical tool for futures, and stock markets.
1.2. Why traders use them today
Today, pivot points serve two main purposes:
- Market bias identification: A price above the main level typically indicates bullish sentiment, while a price below suggests bearish sentiment.
- Trade planning: They provide predefined levels for entries, exits, and stop-loss placement.
Market prices often show strong reactions near the R1 and S1 levels. However, reaching R1 (Resistance 1) is not a guaranteed reversal signal. Effective trading requires waiting for clear confirmation from price action, such as a bearish engulfing candle at R1—before taking a position. Combining Pivot Points with supporting price action patterns is crucial for a reliable technical approach.
2. Pivot Points calculation: Formula and Step-by-Step example
Knowing how pivot points are calculated is a key step before incorporating them into your trading strategy. The classic method is the most widely used and forms the basis for most pivot indicators.
Critical Note: Choosing the Right “Previous Period”
Pivot points are always calculated based on the prior timeframe’s High, Low, and Close. Your choice depends on your trading style:
- Day Trading: Uses Previous Day’s data to project levels for today.
- Swing Trading: Uses Previous Week’s or Month’s data (like the example below) to project longer-term levels.
- For Forex Traders: Since the FX market runs 24 hours, there is no official market close. However, the industry standard, used by most institutions and algorithms, is the New York Close (5:00 PM EST). Using this time ensures your charts align with the rest of the global market.
2.1. Classic formula
The classic method is the most widely used because it is simple, quick to calculate, and works across different markets. The process begins with the main pivot (PP), serving as the central reference for the day trading. From this point, three resistance levels (R1, R2, R3) are calculated above it, and three support levels (S1, S2, S3) are calculated below for the current trading period.
| Pivot Point (PP) = (Close + Low + High) ÷ 3 |
This is the central guide for the day: Above the PP often suggests upward price action, while below it signals potential downward pressure.
| R1 = (2 × PP) − Low |
First resistance level. Often the first upside target in a bullish move or the first barrier to a higher high price.
| S1 = (2 × PP) − High |
First support level. Often the first downside target is a bearish move or the first floor to prevent a lower low price.
| R2 = PP + (High − Low) |
Second resistance level. This usually signals stronger bullish price action if price breaks above R1 and reaches here.
| S2 = PP − (High − Low) |
Second support level. Breaking below this may show that sellers are in stronger control.
| R3 = High + 2 × (PP − Low) |
Third resistance level. A rare target reached only on strong trending days.
| S3 = Low − 2 × (High − PP) |
Third support level. This is often hit during high volatility sell-offs.
Piprider’s tip: We rarely aim for R3 or S3 in intraday trading unless there’s strong news or market momentum. Most profitable trades for us happen between S1–R1 or S2–R2, as these levels get tested more often.
2.2. Step-by-step example for beginners
Let’s say last month’s market data for USD/CAD was:
- High = 1.37981
- Low = 1.35399
- Close = 1.36074
Step 1 – Main pivot:
| PP = (1.37981 + 1.35399 + 1.36074) ÷ 3 = 1.36485 |
Step 2 – First support and resistance:
| R1 = (2 × 1.36485) − 1.35399 = 1.37571 S1 = (2 × 1.36485) − 1.37981 = 1.34989 |
Step 3 – Second support and resistance:
| R2 = 1.36485 + (1.37981 − 1.35399) = 1.39067 S2 = 1.36485 − (1.37981 − 1.35399) = 1.33903 |
Step 4 – Third support and resistance:
| R3 = 1.37981 + 2 × (1.36485 − 1.35399) = 1.39153 S3 = 1.35399 − 2 × (1.37981 − 1.36485) = 1.32417 |
In this USD/CAD example, the PP (1.36485) defines the market’s monthly bias: price above PP is bullish, below is bearish. R1 (1.37571) and S1 (1.34989) are the primary reaction zones for trade planning (entry/stops/targets). R2/S2 and R3/S3 offer extended targets for stronger trending movements.
3. Types of Pivot Points: Which Works Best for Your Trading
Not all calculation methods are the same. Over time, traders have created various formulas to match different market conditions and trading approaches. While the classic version is the most popular, other versions such as Woodie, Camarilla, and Fibonacci offer distinct perspectives on price action (Babypips, n.d.; Forex Training Group, 2018).
Below, Piprider’ll explain each type in simple terms, with real-life style examples so you can quickly grasp how they work in practice.
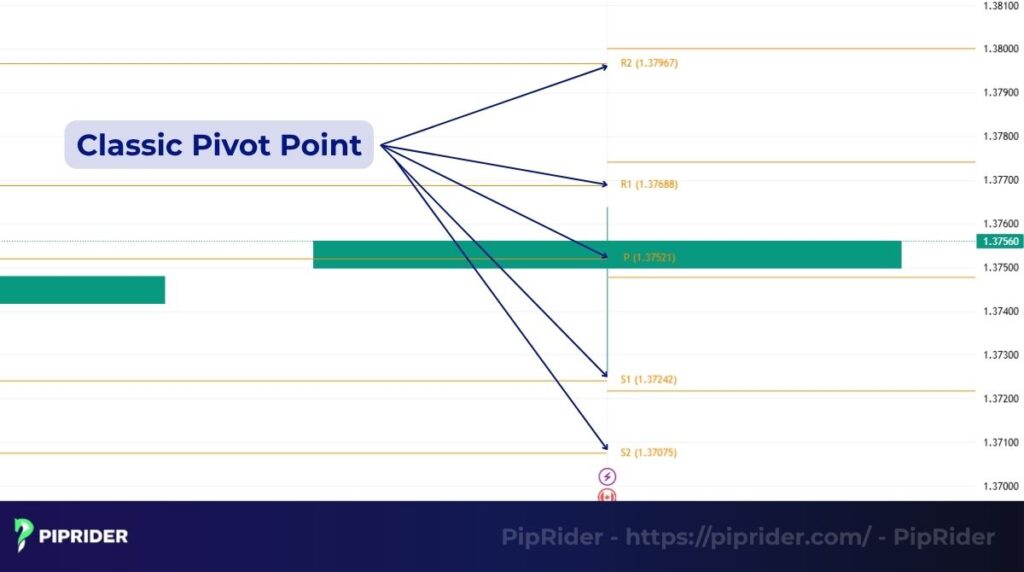
3.1. Classic (standard) pivot points
Originally developed by floor traders, this formula finds the main pivot (PP) by averaging the prior session’s high, low, and close, and uses the price range to establish support and resistance levels.
Formula:
| PP = (High + Low + Close) ÷ 3 R1 = (2 × PP) − LowS1 = (2 × PP) − High R2 = PP + (High − Low) S2 = PP − (High − Low) R3 = High + 2 × (PP − Low) S3 = Low − 2 × (High − PP) |
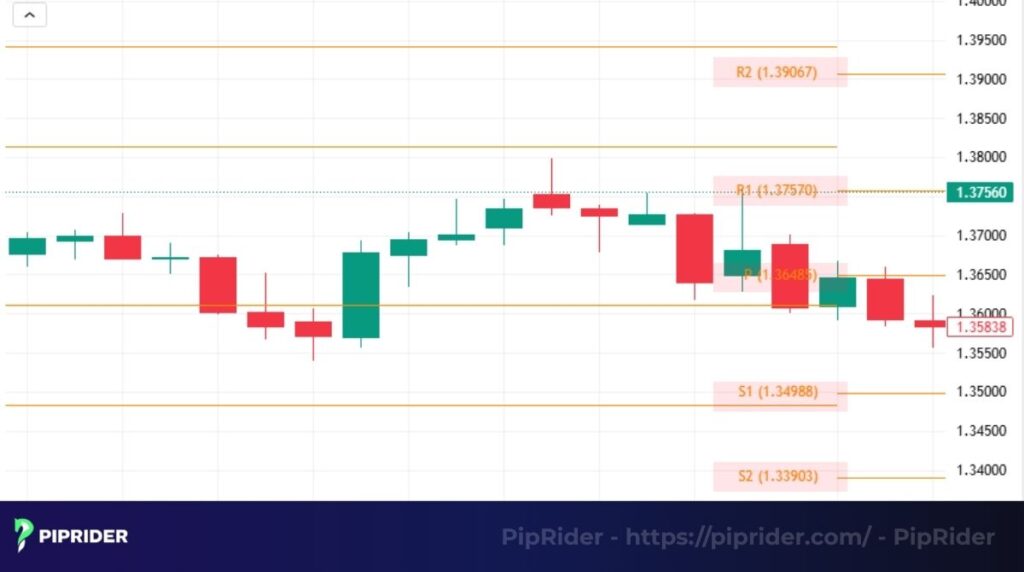
Example:
Yesterday’s USD/CAD: High (H) = 1.37800, Low (L) = 1.37354, Close (C) = 1.37409
| PP = (H + L + C) ÷ 3 = (1.37800 + 1.37354 + 1.37409) ÷ 3 = 1.37521 R1 = (2 × PP) − L = (2 × 1.37521) − 1.37354 = 1.37688 S1 = (2 × PP) − H = (2 × 1.37521) − 1.37800 = 1.37242 R2 = PP + (H − L) = 1.37521 + (1.37800 − 1.37354) = 1.37967 S2 = PP − (H − L) = 1.37521 − (1.37800 − 1.37354) = 1.37075 R3 = H + 2 × (PP − L) = 1.37800 + 2 × (1.37521 − 1.37354) = 1.38134 S3 = L − 2 × (H − PP) = 1.37354 − 2 × (1.37800 − 1.37521) = 1.36887 |
If today’s price opens above PP and heads towards R1 at 1.37688, you could look for a breakout trade toward R2 at 1.37967.
Best for: Beginners and day traders who want a simple and widely accepted approach.
Traders use classic pivots most often because they work well in both trending and ranging markets.
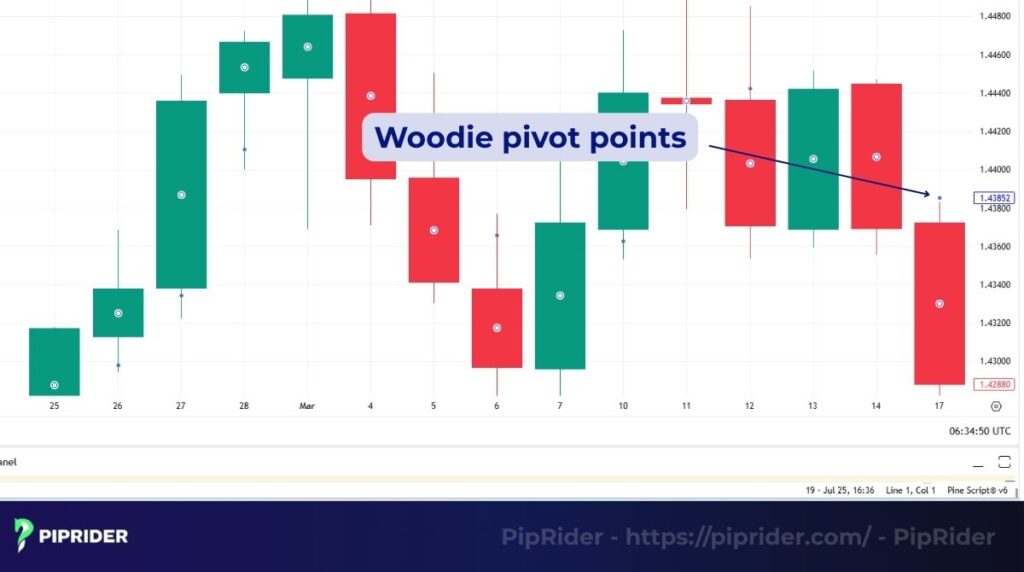
3.2. Woodie pivot points
Woodie pivots give greater emphasis to the closing price, making them more sensitive to recent price changes. This is particularly useful when the close strongly mirrors the day’s market sentiment.
Formula:
| PP = (High + Low + 2 × Close) ÷ 4 R1 = (2 × PP) − Low S1 = (2 × PP) − High R2 = PP + (High − Low) S2 = PP − (High − Low) R3 = High + 2 × (PP − Low) S3 = Low − 2 × (High − PP) |
Example:
USD/CAD closed yesterday at 1.43692, with a high of 1.44470 and a low of 1.43556:
| PP = (1.44470 + 1.43556 + 2 × 1.43692) ÷ 4 = 1.43852 R1 = (2 × 1.43852) − 1.43556 = 1.44149 S1 = (2 × 1.43852) − 1.44470 = 1.43235 R2 = 1.43852 + (1.44470 − 1.43556) = 1.44767 S2 = 1.43852 − (1.44470 − 1.43556) = 1.42938 R3 = 1.44470 + 2 × (1.43852 − 1.43556) = 1.45063 S3 = 1.43556 − 2 × (1.44470 − 1.43852) = 1.42321 |
Because the close was closer to the low than the high, the pivot levels and price barriers are slightly lower, hinting at mild bearish bias from the previous session.
Best for: Short-term traders who want pivots that adjust quickly to market sentiment.
Woodie pivots (Close-based) particularly useful when the prior day’s close sharply influences the next day’s momentum, especially in pairs that react to short-term news.
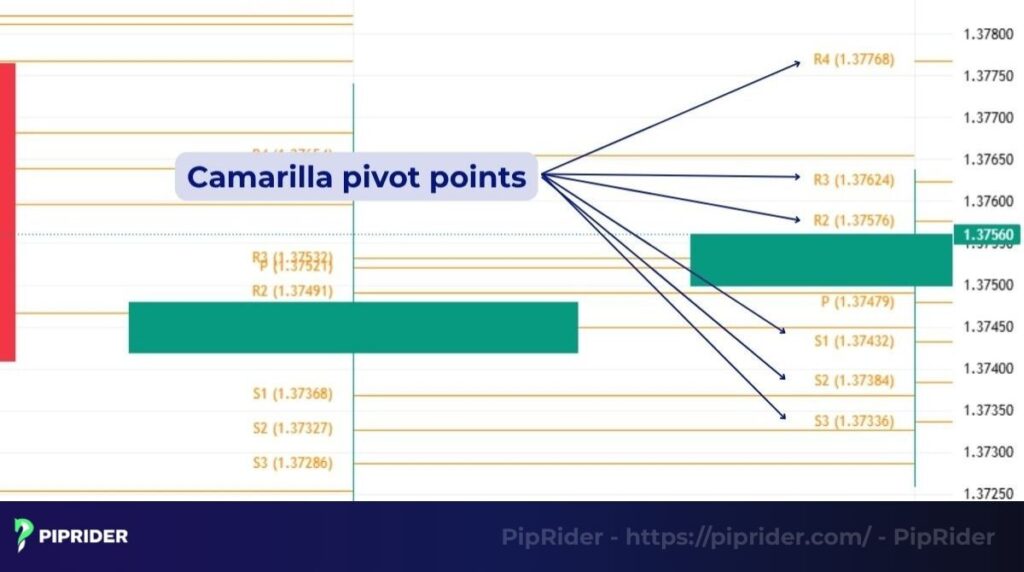
3.3. Camarilla pivot points
Camarilla pivots create support and resistance zones closer to the current price than other versions, making them particularly effective for intraday reversals.
In the traditional method, Camarilla does not use a central PP. Instead, it takes the previous day’s closing price as the reference, then adds or subtracts a fixed multiplier of the previous day’s range (Range = High − Low) to determine support and resistance levels.
Note: The 1.1 multiplier in the formulas below is a common variant, but some sources and platforms use different values (e.g., 1.0833), which will produce slightly different levels. Also, some trading platforms add a central PP to the Camarilla set for reference, even though it is not part of the original method.
Formula (1.1 multiplier variant):
Let Range = High − Low
| R1 = Close + (Range × 1.1 ÷ 12) R2 = Close + (Range × 1.1 ÷ 6) R3 = Close + (Range × 1.1 ÷ 4) R4 = Close + (Range × 1.1 ÷ 2) S1 = Close − (Range × 1.1 ÷ 12) S2 = Close − (Range × 1.1 ÷ 6) S3 = Close − (Range × 1.1 ÷ 4) S4 = Close − (Range × 1.1 ÷ 2) |
Example:
If USD/CAD had a high of 1.37740, a low of 1.37217, and a close of 1.37480:
| Range = 1.37740 − 1.37217 = 0.00523 (523 pips) R1 = 1.37480 + (0.00523 × 1.1 ÷ 12) = 1.37528 R2 = 1.37480 + (0.00523 × 1.1 ÷ 6) = 1.37577 R3 = 1.37480 + (0.00523 × 1.1 ÷ 4) = 1.37624 R4 = 1.37480 + (0.00523 × 1.1 ÷ 2) = 1.37768 S1 = 1.37480 − (0.00523 × 1.1 ÷ 12) = 1.37432 S2 = 1.37480 − (0.00523 × 1.1 ÷ 6) = 1.37383 S3 = 1.37480 − (0.00523 × 1.1 ÷ 4) = 1.37336 S4 = 1.37480 − (0.00523 × 1.1 ÷ 2) = 1.37192 |
In this USD/CAD example, the Camarilla R1 and R2 levels are less than 5 pips apart, indicating a tight range. If price touches R2 but fails to break higher, it could be a shorting opportunity with a target at S1.
Best for: Scalpers and intraday traders looking for quick bounce setups.
Traders often use Camarilla pivots as a secondary confirmation when expecting fast intraday reversals.
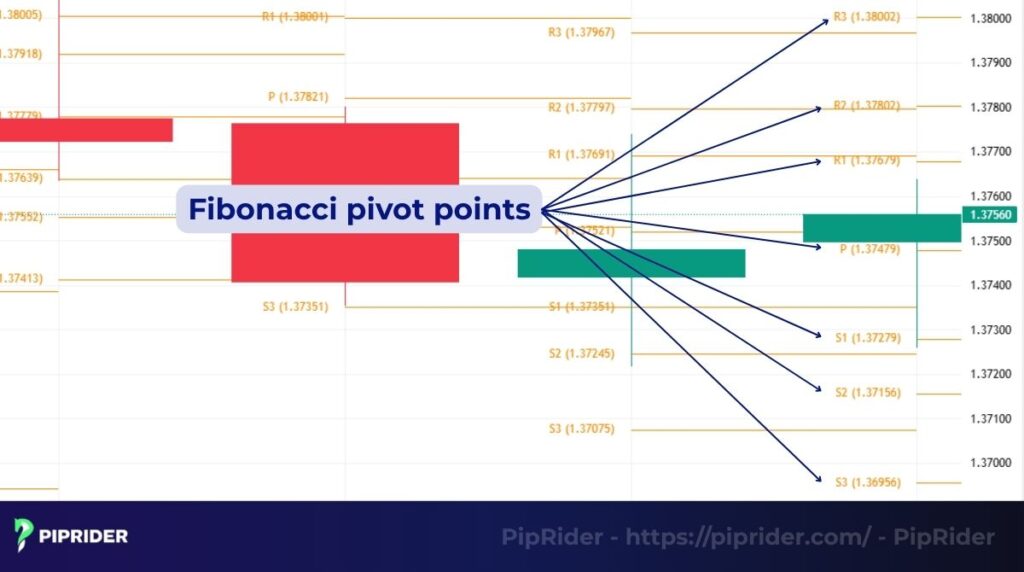
3.4. Fibonacci pivot points
This method combines the classic formula with Fibonacci ratios to find potential support and resistance. It starts by calculating the main pivot (PP) for the current trading period in the same way as the classic method, then applies Fibonacci percentages (38.2%, 61.8%, 100%) to the previous session’s price range.
Formula:
| PP = (High + Low + Close) ÷ 3 Range = High − Low R1 = PP + (Range × 0.382) R2 = PP + (Range × 0.618) R3 = PP + (Range × 1.000) S1 = PP − (Range × 0.382) S2 = PP − (Range × 0.618) S3 = PP − (Range × 1.000) |
Example:
If USD/CAD high was 1.37740, low was 1.37217, and close was 1.37480:
| PP = (1.37740 + 1.37217 + 1.37480) ÷ 3 = 1.37479 Range = 1.37740 − 1.37217 = 0.00523 R1 = 1.37479 + (0.00523 × 0.382) = 1.37679 R2 = 1.37479 + (0.00523 × 0.618) = 1.37802 R3 = 1.37479 + (0.00523 × 1.000) = 1.38002 S1 = 1.37479 − (0.00523 × 0.382) = 1.37279 S2 = 1.37479 − (0.00523 × 0.618) = 1.37156 S3 = 1.37479 − (0.00523 × 1.000) = 1.36956 |
If price stalls at R1, it often aligns with a 38.2% Fibonacci retracement zone, increasing the chance of a reversal.
Best for: Traders who already use Fibonacci tools. It is especially powerful when a Fibonacci level aligns with a standard pivot, creating a strong confluence zone that can improve trading accuracy.
3.5. Comparison table
Now that you understand each type and how it works, here’s a side-by-side comparison to help you quickly decide which method fits your trading style. This table sums up their main focus, best use cases, and a simple real-market example for easy reference.
| Type | Main Focus | Best for | Example in practice |
|---|---|---|---|
| Classic | Equal weight on High, Low, Close | All markets, all timeframes | EUR/USD breakout from PP to R1 aiming for R2 |
| Woodie | Heavier weight on Closing Price | Intraday, volatile markets | GBP/JPY bullish bias after strong close |
| Camarilla | Tight reversal / breakout zones | Scalping, sideways trading | USD/CAD reversal from R3 back to S1 |
| Fibonacci | Fibonacci ratios + pivot formula | Fibonacci traders, swing setups | Gold stalling at R1 near 38.2% retracement |
The Classic Pivot provides a general market overview. A strong strategy is to layer Classic with Fibonacci Pivots. When a Classic level (e.g., R1) aligns with a Fibonacci ratio, it forms a confluence zone. This zone signals a high probability of reversal or reaction, making it an ideal point for entry planning.
4. How to plot Pivot Points on TradingView & MT4
Gone are the days of manual calculations on spreadsheets. Modern trading platforms automate this entire process. Here is how to set up the indicator on the two most popular platforms.
4.1. On TradingView (Built-in)
TradingView offers the most flexible built-in tool, allowing you to switch between Classic, Woodie, and others instantly (TradingView, n.d.).
- Open Indicators: Click the “Indicators” tab on the top toolbar.
- Search: Type “Pivot Points Standard” in the search bar and select it.
- Configure: Once added, click the Settings (gear icon) next to the indicator name:
- Type: Change from “Traditional” (Classic) to Fibonacci, Woodie, or Camarilla depending on your preference.
- Pivots Timeframe: Crucial Step. Change this from “Auto” to “Daily” if you are day trading. Leaving it on “Auto” can cause levels to shift confusingly when you zoom in or out.
4.2. On MetaTrader 4 / 5 (MT4/MT5)
Unlike TradingView, the standard version of MT4/MT5 does not typically include a “Pivot Point” tool in the main toolbar.
- Check Built-in List: Open the Navigator panel (Press Ctrl+N). Look under “Indicators” > “Examples”. Some brokers include a custom tool here.
- If Not Found (Custom Install):
- You will need to download a free Pivot Point.ex4 (or .mq4) file from the MQL5 Market or a trusted forum.
- To Install: Go to File > Open Data Folder > MQL4 > Indicators. Paste the downloaded file there and restart MT4.
- Apply to Chart: Drag the indicator from the Navigator panel onto your chart. Ensure “Allow DLL imports” is checked in the settings tab if prompted.
5. How to use pivot points in trading
Pivot points are more than just numbers on a chart; they are a pre-planned roadmap that helps form objective trading decisions.
In simple terms:
- If the price is above the main pivot (PP), market sentiment is generally bullish.
- When the price trades below the PP, it’s generally viewed as bearish.
- Support levels (S1, S2, S3) often highlight areas where traders may look for buying opportunities.
- Resistance levels (R1, R2, R3) often indicate zones where selling opportunities could arise.
To trade with pivot points effectively, follow a simple daily routine. Here is a step-by-step process for using them that work on MT4, TradingView, or any charting platform.
- Identify the main pivot (PP) before the trading session begins.
- Mark the support (S1–S3) and resistance (R1–R3) levels on your chart.
- Check the opening price relative to the PP for bullish or bearish bias.
- Watch for price action patterns forming near pivot levels before making your entry.
- Set your stop-loss and take-profit using the next levels as guides.
When trading EUR/USD on MT4, start by checking the daily pivots before the London session. When a pair starts the session above the PP and drives up toward R1 with solid price action, wait for a minor retracement before going long. Place the stop-loss just below the PP, with the first target at R2. This structured approach helps avoid impulsive trades by ensuring there is a clear plan before the session starts.
6. 3 High-Probability Pivot Point Strategies
Once you have the lines on your chart, you need a strict plan. PipRider have refined three specific strategies into actionable checklists. Do not take a trade unless all 5 conditions in the checklist are met.
6.1. Strategy 1: The “Range Bounce” (Best for Sideways Markets)
This strategy works best when the market lacks a clear trend, bouncing between known levels like a ping-pong ball.
The Execution Rules:
- Market Condition: Ranging/Sideways. Identify this when the ADX is below 25 or price is moving flat between bands.
- Entry Trigger: Price touches a Pivot level (e.g., S1 or R1) AND prints a Reversal Candle (Hammer, Shooting Star, or Engulfing). Wait for the candle close.
- Stop-Loss Rule: Place SL 5-10 pips (or 1x ATR) beyond the pivot level to avoid stop hunts.
- Take-Profit Rule: Target 1: The central Pivot Point (PP). Target 2: The opposite level (e.g., buy at S1, exit at R1).
- Invalidation (No Go): Cancel the trade if a strong candle closes beyond the level (indicating a breakout, not a bounce).
6.2. Strategy 2: The “Momentum Breakout” (Best for News/Openings)
Instead of fading the move, this strategy rides the wave when price shatters a level with force. This typically happens during the London/New York open.
The Execution Rules:
- Market Condition: High Volatility. Look for major news releases or market session opens.
- Entry Trigger: A strong candle CLOSES decisively beyond a level (e.g., R1). Caution: Do not enter on a wick/touch. Confirmation: Volume or RSI should be rising.
- Stop-Loss Rule: Place SL just inside the broken level (the previous resistance becomes your protective floor).
- Take-Profit Rule: Target: The next logical Pivot level (e.g., Break R1 -> Target R2).
- Invalidation (No Go): Avoid trading during the first 5 minutes of major news (NFP/CPI) due to widened spreads. Also, abort if the breakout candle immediately reverses (Fakeout).
6.3. Strategy 3: The “Trend Pullback” (Best for Sustained Moves)
In a healthy trend, price rarely moves in a straight line. It moves, pulls back, and resumes. Pivot points act as the “floor” for these pullbacks.
The Execution Rules:
- Invalidation (No Go): Do not enter if the pullback turns into a reversal (price closes firmly below the 50 EMA).
- Market Condition: Trending. Price is clearly above the 50 EMA and ADX > 25.
- Entry Trigger: Price pulls back to the central Pivot (PP) or S1/R1 AND gets rejected. Look for a wick touching the line followed by a continuation candle.
- Stop-Loss Rule: Place SL below the recent Swing Low formed during the pullback.
- Take-Profit Rule: Target 1: The recent high. Target 2: The next expansion level (e.g., R2 or R3).
7. Pros and cons of pivot points
Like any trading tool, pivot points calculated levels have strengths and weaknesses. Knowing both helps you use them effectively and avoid common traps.
7.1. Pros
Pivot points offer several advantages, especially for traders who like structure and pre-planned levels:
- Clear market framework: You start each day with a predefined map of support and resistance levels, helping you analyze market trends and reduce guesswork.
- Works across markets: Useful in stocks, commodities, and indices.
- Fast decision-making: Simple to calculate and easy to interpret on the chart.
- Helps with trade planning: Levels make it easy to set entry, stop-loss, and target prices.
- Combines well with other tools: Can be used with oscillators like the relative strength index (RSI) for extra confirmation.
7.2. Cons
There are also limitations you need to be aware of:
- Not predictive on their own: They mark potential zones, but you still need confirmation from price action or other indicators.
- Less effective in low market volatility: Price may hover around levels without reacting clearly.
- Different types can cause confusion: Classic, Woodie, Camarilla, and Fibonacci can give slightly different levels.
- Short-term relevance: Daily pivots are most useful for intraday trading; they lose accuracy over longer timeframes.
Remember never rely on pivot points alone in your technical analysis. Combining them with trend analysis and volatility filters has saved you from many false signals.
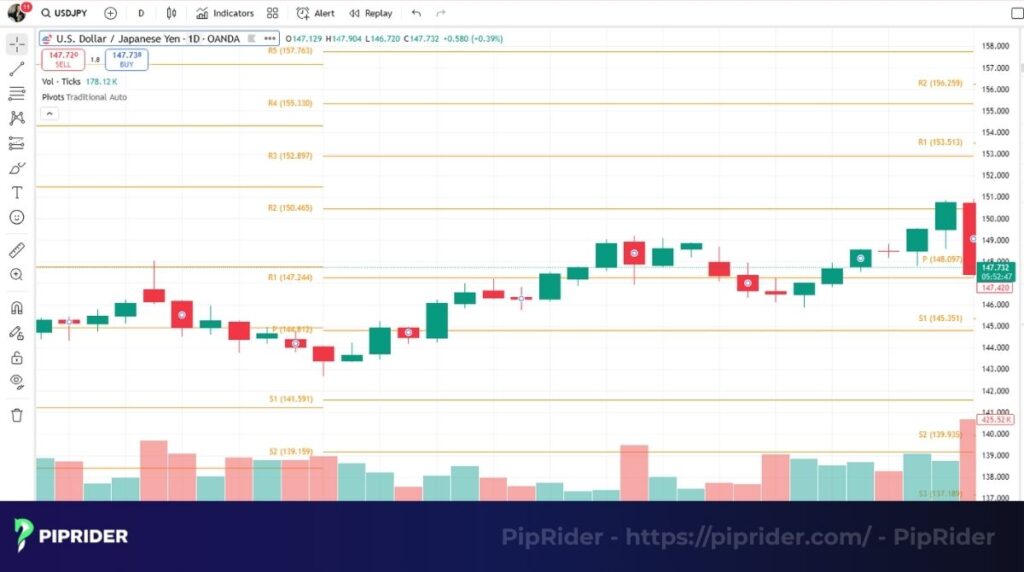
8. Real-World Example
To demonstrate how to identify trade setups, let’s analyze a real-world USD/JPY daily chart on TradingView using the Standard Daily Pivot Points indicator.
Chart Settings Note:
- Timeframe: Daily Chart (D1).
- Indicator Setting: Daily Pivots (Calculated based on the previous day’s High, Low, and Close).
- Levels displayed: P (Pivot), R1 (Resistance 1), S1 (Support 1).
8.1. What happened on the chart
The price action during this period reveals a classic “Breakout and Retest” pattern:
- The Breakout: Earlier, USD/JPY broke decisively above the old resistance level (Old R1 at 147.24), signaling that buyers were taking control.
- The Retest (The Setup): After the breakout, the price pulled back gently to the 147.20 – 147.30 area. This “Old Resistance” now acted as “New Support” (Polarity Principle).
- The Bounce: From this support zone, buyers stepped in, pushing the price higher toward the new central Pivot Point (P at 148.09).
8.2. How to apply pivot points in this situation
You can execute this specific trade using a structured 4-step plan:
- Identify the trend: The price is trading above the moving averages and has just cleared a key resistance level → Short-term bias is Bullish.
- Look for a buy entry: The 147.24 zone is the ideal “value area” to enter. It aligns the Pivot level with market structure.
- Place your stop-loss: Place it below the recent swing low, around 146.70, to protect against a false breakout (fakeout).
- Plan your targets:
- Target 1 (Conservative): The central Pivot Point (P) at 148.09.
- Target 2 (Extended): If the price breaks above P with strong volume, aim for the next daily resistance, R1 at 148.85. (Note: Do not aim for weekly targets like 153.00 on an intraday trade).
8.3. Why this is useful for beginners
Adopting this pivot-based approach offers specific advantages over guessing:
- Structured market view: You are not randomly entering; you are waiting for the price to come to a mathematically defined level (147.24).
- Logical Risk/Reward: You are risking ~50 pips (Stop at 146.70) to gain ~85 pips (Target P) or ~160 pips (Target R1).
- Emotional discipline: This methodology encourages traders to wait patiently for the setup, significantly reducing impulsive “FOMO” trading.
9. FAQ on Pivot Point
Before you start trading with pivot points, here are quick answers to the most common beginner questions.
10. Summary
Pivot point remains one of the most practical tools for traders who want a clear structure in their decision-making. Whether you trade stocks, or commodities, they provide predefined support and resistance levels that can guide entries, exits, and stop-loss placement.
If you’re ready to deepen your skills with this type of trading, explore further guides on combining them with indicators like ATR, Bollinger Bands, or ADX to refine your strategy.
To take your learning further, join us at Piprider and browse our best technical indicators category for in-depth resources, trading strategies, and real-world examples to elevate your trading performance.


