The rising wedge pattern is one of the most dangerous bearish reversal signals in trading. Even though the price keeps making higher lows, the true buying momentum is actually fading. Understanding the rising wedge allows traders to spot this weakness early and profit from the aggressive breakdown that usually follows.
In this guide, you will learn how to filter out false signals, time your entries precisely, and turn a potential market crash into a profitable opportunity.
Key Takeaways
- A rising wedge is a bearish chart pattern, regardless of whether it appears in an uptrend or a downtrend.
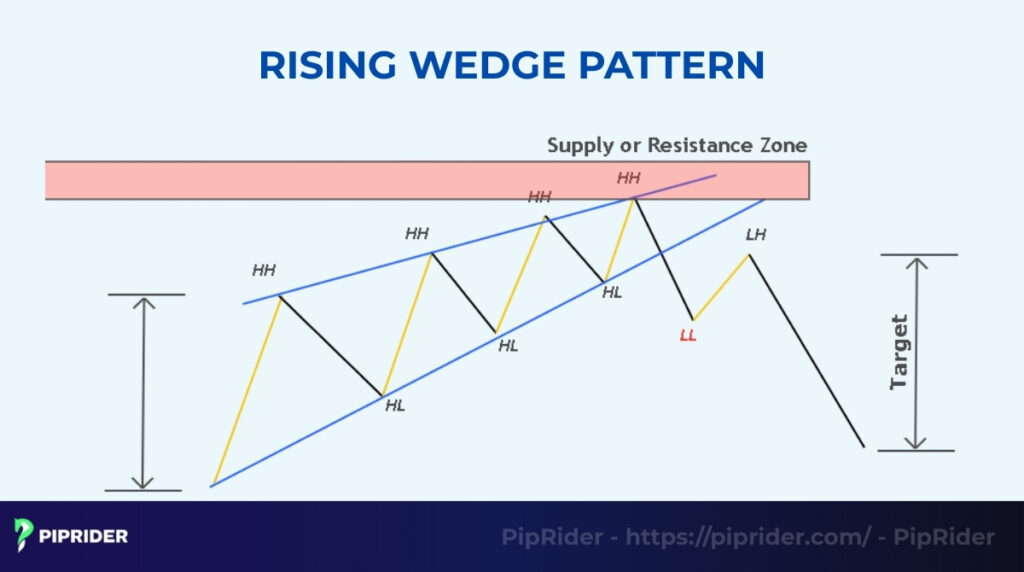
- Structure: Two trendlines slope upward, but the lower support line is steeper than the upper resistance line, indicating weakening momentum.
- Volume: Trading volume typically declines as the pattern forms, warning that buyers are losing power.
- The Signal: A valid sell signal occurs when the price breaks below the lower trendline.
- Target: The profit target is calculated by measuring the vertical height of the widest part of the wedge.
1. What Is a Rising Wedge Pattern?
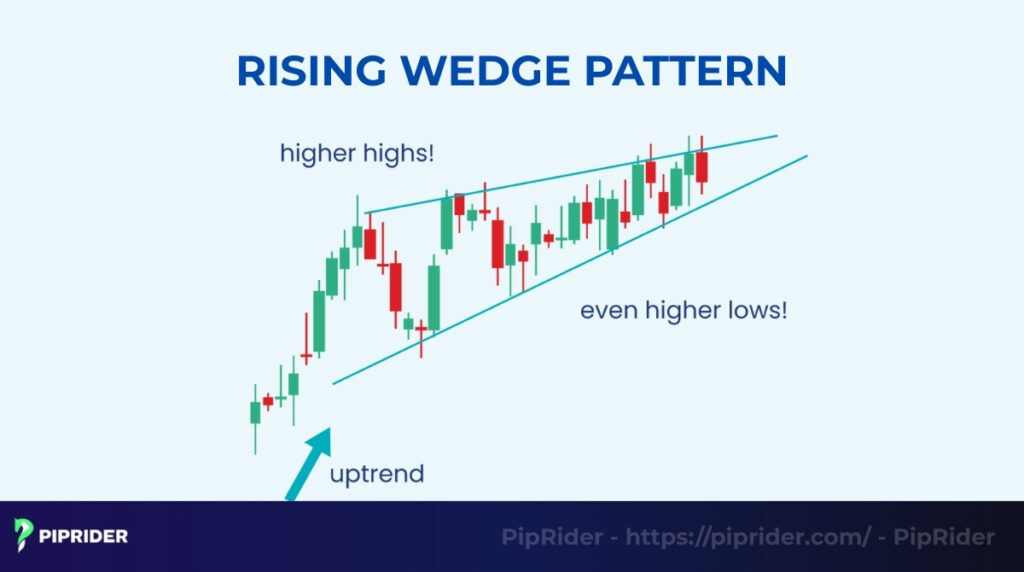
The rising wedge pattern (also known as an “ascending wedge”) is a bearish technical analysis chart formation that signals potential market reversals or the continuation of a downtrend. It is created when price movements push upward but within a narrowing range, forming two converging upward-sloping trend lines.
The pattern is confirmed when the price loses momentum and breaks decisively below the lower trendline, typically on increasing volume.
In technical analysis, a valid rising wedge pattern has three specific characteristics:
- Converging lines: Both the support (bottom) and resistance (top) lines slope upward.
- Steeper support: The lower support line rises steeper than the upper resistance line. This means buyers are pushing harder to hold the lows, but sellers are preventing significant new highs.
- Declining volume: As the price range tightens, trading volume usually decreases, indicating that the bullish conviction is fading.
1.1. Why the Rising Wedge is Considered a Bearish Pattern
According to Investopedia (2024), the rising wedge pattern is a major bearish signal because it represents failed momentum. Even though the price is making higher highs, the distance between the highs is shrinking. This shows that the buyers are exhausted and struggling to push the price up, while sellers are slowly gaining control. When the support line finally breaks, the built-up selling pressure usually causes a sharp drop.
1.2. Appearance in Uptrend vs. Downtrend
The rising wedge is unique because it is bearish in both market contexts:
- In an uptrend (Reversal): It appears at the top of a rally. It signals that the uptrend is losing steam and a reversal to the downside is likely.
- In a downtrend (Continuation): It appears as a temporary pause or “correction” during a price drop. It signals that the brief rally is over, and the downtrend will continue.
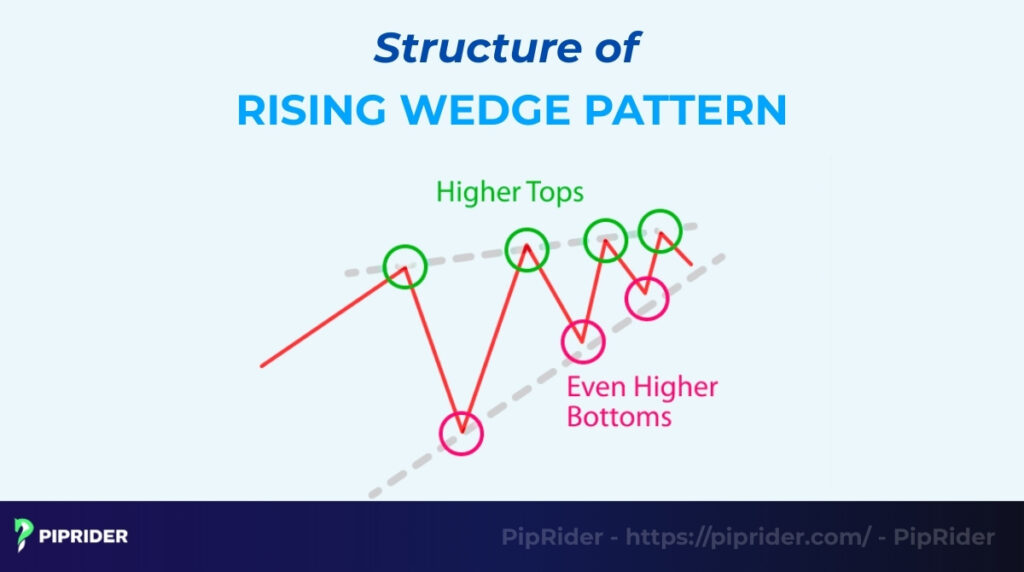
2. What Is the Structure of a Valid Rising Wedge?
A valid rising wedge structure requires four essential elements: converging trendlines that define the shape, a steeper lower trendline that confirms weakness, declining volume during formation, and a compression zone signaling the imminent breakout.
2.1. Converging Trendlines (Higher Highs + Higher Lows)
The formation begins by connecting the swing points using upward-sloping trend lines. The upper trendline connects at least two higher highs, and the lower trendline connects at least two higher lows. Both lines must slope upwards and be clearly heading toward an intersection point (the Apex).
2.2. Steeper Lower Trendline = Weakening Momentum
This is the most critical element. The lower trendline (support) rises steeper than the upper trendline (resistance). This imbalance proves that even though the price is rising, buyers are forced to step in earlier and earlier just to maintain the upward momentum, indicating exhaustion.
2.3. Declining Volume Throughout the Pattern
Volume acts as the fuel gauge. As the pattern forms, trading volume should visibly decline. This reduction in volume confirms that conviction is fading and that the upward moves are being driven by a lack of selling pressure rather than aggressive buying.
2.4. Tightening Price Action / Compression Zone
As the trendlines converge, the price movements enter a tight consolidation phase. This compression zone is where the pattern’s energy builds. The market is squeezed into a small area, setting the stage for a strong, decisive breakout (usually downward) once the support trendline is finally breached.
3. What Is the Market Psychology Behind a rising wedge ?
The rising wedge pattern is the visual result of a psychological struggle where market sentiment shifts and the effort put in by buyers yields diminishing returns. This indicates the market is moving on pure hope rather than true conviction.
3.1. Buyer Exhaustion as Price Climbs With Weak Strength
Buyers are struggling. They are unable to maintain the previous momentum, even though the price is technically making higher highs. The visible shrinking of the price range shows that the same buying effort is resulting in smaller gains. This exhaustion is the primary signal that the bullish momentum is fading and the rally is unsustainable.
3.2. Increasing Seller Pressure Near Resistance Zones
Sellers are starting to gain confidence. They recognize the buying weakness and are willing to step in earlier and earlier to defend the resistance zone. This aggressive selling keeps the market contained, preventing significant new highs, and pushes the price down faster than the buyers can rally it.
3.3. Breakout Trap Dynamics & Why Drops Are Aggressive
When the lower support line finally breaks, the drop is aggressive because of trapped buyers. All the traders who bought inside the wedge place their stop loss orders just below the lower trendline. When the price hits this level, the resulting panic selling triggers those stops, which instantly convert to sell orders, fueling a massive, aggressive collapse of the price.
4. How Does the Rising Wedge Compare to Similar Patterns?
It is easy to confuse the rising wedge pattern with other formations that also slope upward. However, recognizing the subtle differences is critical because they signal opposite market intentions (continuation vs. reversal).
Here is a quick guide to distinguishing them:
| Pattern | Shape (Slope) | Volatility | Primary Signal |
| Rising Wedge | Converging Up | Decreasing | Bearish Reversal/Continuation |
| Ascending Channel | Parallel Up | Stable | Bullish Continuation |
| Bearish Flag | Parallel Down/Flat (Short) | Stable/Pausing | Bearish Continuation |
| Ascending Triangle | Converging (Flat Top) | Decreasing | Bullish Continuation |
| Broadening Pattern | Diverging (Expanding) | Increasing | Bearish Reversal |
4.1. Rising Wedge vs. Ascending Channel
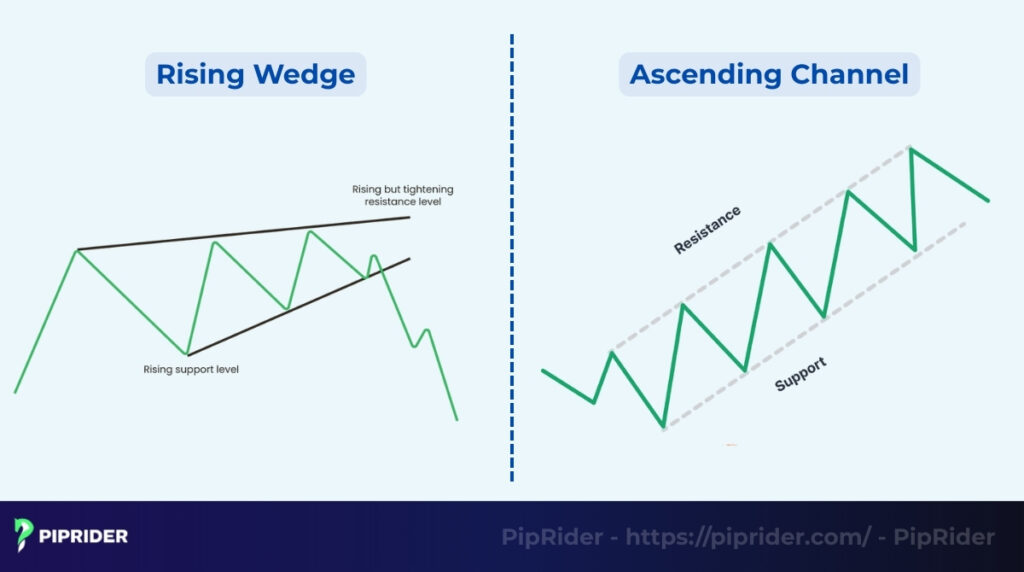
The key difference lies in the rate of convergence. The ascending channel indicates a sustainable, stable bullish trend where buyers and sellers are balanced, whereas the rising wedge suggests the rally is losing strength and becoming unsustainable.
- Ascending Channel: Has two parallel trendlines (support and resistance) that slope up.
- Rising Wedge: Has two converging trendlines. The lines are squeezing the price, signaling an uptrend that is failing due to a lack of conviction.
4.2. Rising Wedge vs. Ascending Triangle
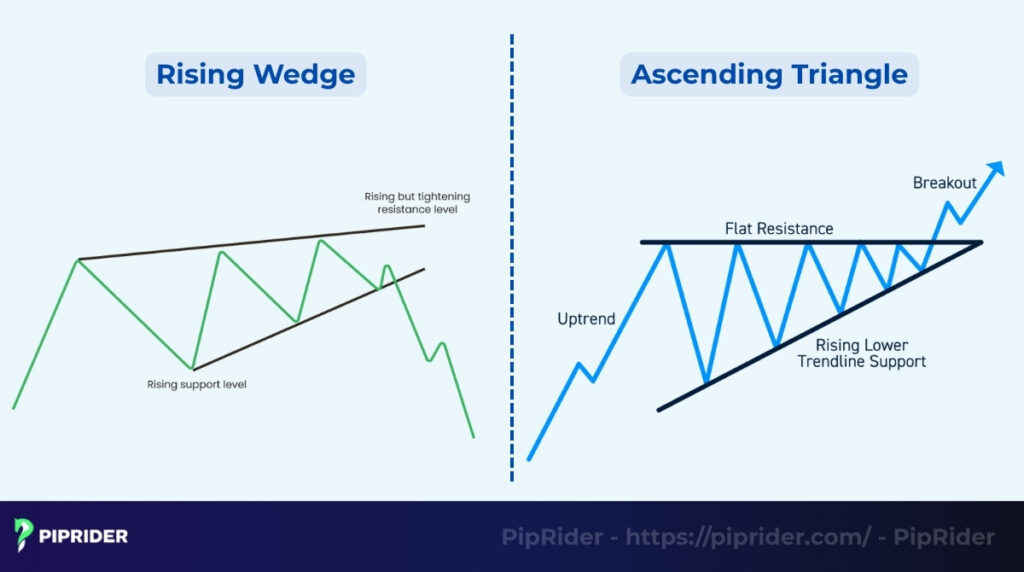
Both patterns signal decreasing volatility, but they carry fundamentally opposite biases. This difference is determined by whether the resistance line is flat (triangle, bullish) or sloping up (wedge, bearish).
- Ascending Triangle: Features a clear flat horizontal resistance line. This strong ceiling shows buyers are focused on breaking a specific price level, making the pattern inherently bullish.
- Rising Wedge: Both lines slope up. There is no single target for buyers to focus on, proving the market is indecisive and unstable.
4.3. Rising Wedge vs. Bearish Flag
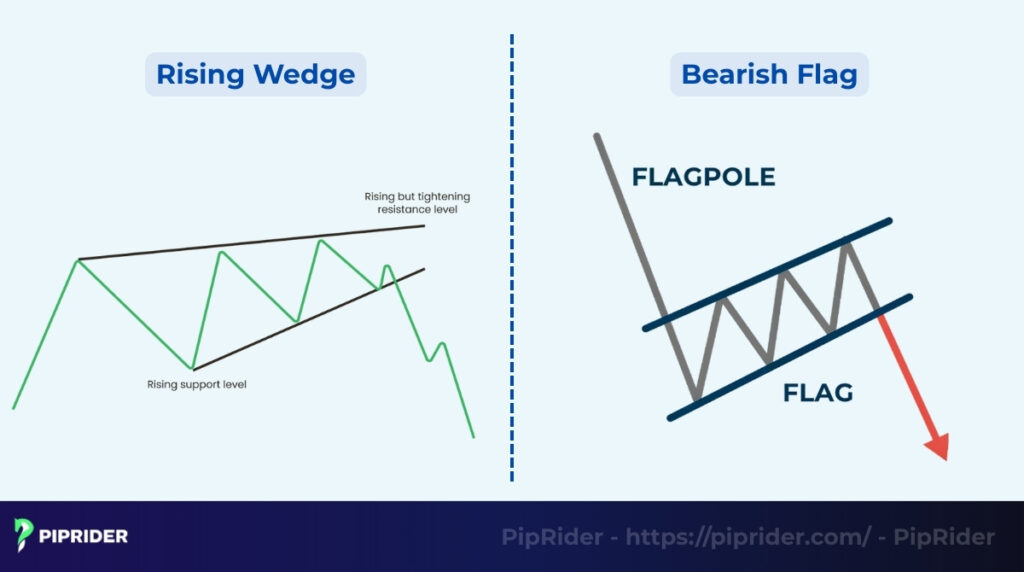
Both formations are often seen as continuation candlestick patterns within a downtrend, but they differ significantly in shape and psychological meaning. The bearish flag signals a brief, controlled rest, whereas the rising wedge implies genuine exhaustion.
- Bearish Flag: A short-term, tight, parallel box that slopes slightly against the trend. It represents a brief, controlled rest stop for sellers.
- Rising Wedge: A medium-term, converging pattern. The squeeze implies a psychological breakdown and exhaustion of buyers in that brief recovery.
4.4. Rising Wedge vs. Broadening Pattern
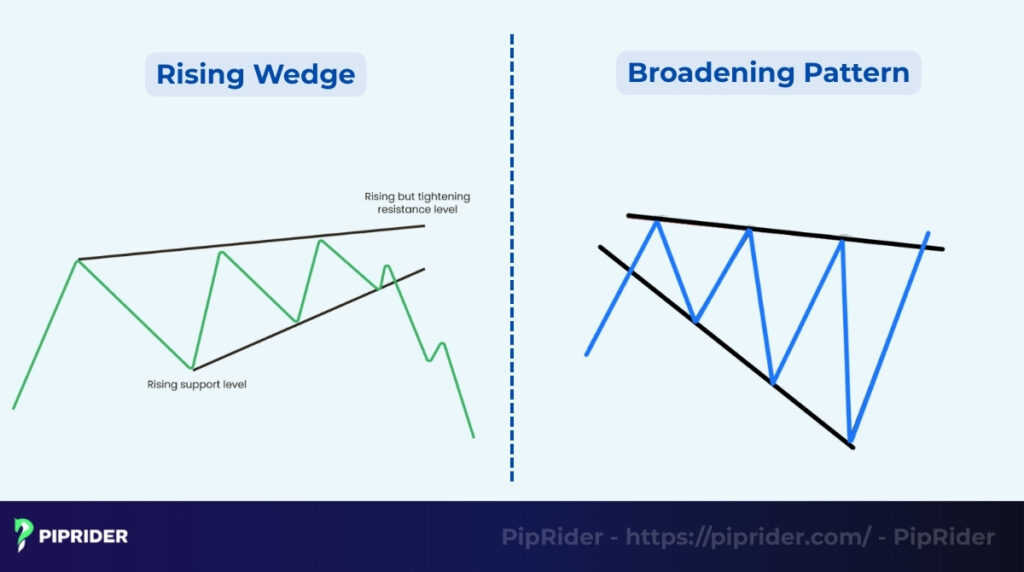
These two are structural opposites, which makes them easy to distinguish based on volatility dynamics. The rising wedge involves the price range contracting (volatility decreasing), while the broadening pattern involves the range expanding (volatility increasing), representing opposite psychological states regarding future price trends.
- Rising Wedge: The lines converge (price range gets smaller). Volatility decreases.
- Broadening Pattern (Megaphone): The lines diverge (price range gets wider). Volatility increases. They represent opposite psychological states (calm anticipation vs. fear/chaos).
5. What Are the Different Types of Rising Wedge Breakdowns?
The rising wedge pattern has three distinct outcomes. Recognizing the context (the trend before the wedge) and identifying the difference between a genuine signal and a trap are essential for trading them correctly.
5.1. Bearish Reversal Wedge (The Classic Top)
The most common scenario occurs when the wedge forms at the peak of a strong uptrend. It signals bullish exhaustion, indicating that buyers can no longer sustain the higher prices.
- Context: Price rallies but begins to coil tightly at the highs.
- Action: A breakdown below the lower trendline confirms the end of the rally, signaling a major bearish reversal to the downside.
5.2. Bearish Continuation Wedge (The Bear Flag)
When found within an existing downtrend, the wedge acts as a temporary consolidation or correction against the primary move, similar to a “bear flag” pattern.
- Context: The trend is already down. The wedge forms when price attempts a weak recovery rally against the main flow.
- Action: The subsequent breakdown confirms that the brief rally is over, signaling the continuation of the main bearish trend.
5.3. False Breakout (The Bull Trap)
Designed to capture liquidity, the false breakout is the most dangerous scenario.
- The Trap: Price briefly breaks above the upper resistance trendline, tricking bullish traders into buying the “breakout.”
- Action: Price immediately collapses back into the wedge and breaks below the lower trendline. This move liquidates the trapped buyers and signals that the downtrend is now highly aggressive. The best defense is to only trade the downward breakdown.
6. How to Trade the Rising Wedge Pattern
Once you have identified a valid rising wedge pattern with converging lines and declining volume, you need a concrete plan to execute the trade. Traders generally choose between two entry methods depending on their risk tolerance.
Here is a quick guide to choosing your entry style:
| Strategy | Entry Timing | Risk Level | Best For |
| 1. Breakout | On the break candle | High | Catching fast moves |
| 2. Retest | After the pullback | Low | Precision / Safety |
6.1. Entry Strategy 1: Breakout Entry Below Support (Aggressive)
Momentum traders often prefer this method to ensure they catch the move immediately if the price drops quickly. This approach sacrifices price precision for speed.
- The Action: Enter a “Sell” (Short) position as soon as a candle closes decisively below the lower support trendline.
- The Requirement: To filter out fakeouts, you must see a spike in selling volume on the breakdown candle. If the price breaks on low volume, it is risky and prone to reversal.
6.2. Entry Strategy 2: Retest Entry (Most Reliable)
Conservative traders often wait for the price to return to the “scene of the crime.” This method has a higher win rate because it confirms the breakdown, but it risks missing the trade if the price collapses immediately without looking back.
- The Action: After the initial breakdown, wait for the price to rally back up and touch the broken support line (which now acts as resistance).
- The Trigger: Enter a short position only when the price rejects this level, giving you a better entry point. Watch for a bearish candlestick pattern like a bearish shooting star or engulfing bar.
6.3. Stop Loss Placement (Above Swing High / Trendline)
Defining your risk is critical because wedges can sometimes turn into channels or complex corrections. Good risk management requires you to place your stop-loss at a level where the bearish setup is proven wrong.
- Conservative Stop: Place the stop-loss just above the most recent swing high inside the wedge. If buyers push the price back above this high, the reversal logic has failed.
- Aggressive Stop: Place the stop just above the breakdown candle. This offers a better risk-to-reward ratio but is more likely to be hit by normal market noise.
6.4. Profit Target Using Measured Move
To set a logical exit point, traders use the pattern’s own geometry. The classic target for a rising wedge is calculated using the “Measured Move” technique.
- Calculation: Measure the vertical distance of the wedge’s widest part (the back of the pattern). Project that distance downward from the breakout point. For example, if a wedge is $10 wide at its start, your technical price target is $10 below the breakdown.
6.5. Additional TP Using Fibo Retracement or Demand Zone
Real markets don’t always follow perfect geometry, so professional traders use confluence to set realistic targets that align with market structure.
- Demand Zones: Look left on the chart to find the next major support or demand zone. This is often where the price will stop falling, regardless of the measured move.
- Fibonacci: If the wedge formed as a pullback in a downtrend, use Fibonacci extensions. If it formed as a reversal, target the 61.8% Fibonacci retracement level of the entire previous uptrend.
7. Which Indicators Improve Rising Wedge Accuracy?
A rising wedge pattern is a powerful visual formation, but trading it based on shape alone can lead to false signals. To filter out low-quality setups, professional traders use confluence for confirmation.
Here is a quick confirmation cheat sheet:
| Indicator | What to Look For | Signal Meaning |
| Volume | Decreasing then Spiking | Weak rally → Strong selling pressure. |
| RSI | Bearish Divergence | Price makes Higher High, RSI makes Lower High. |
| MACD | Bearish Crossover | Momentum is shifting down before price breaks. |
| EMA | Break below 20/50 EMA | Loss of dynamic support. |
- Volume breakdown confirmation: Volume acts as a “lie detector.” While volume should decrease during formation, a valid breakdown requires a sharp spike in selling volume. A low-volume breakdown is often a trap.
- RSI bearish divergence: Look for disagreement between price and momentum using oscillators like RSI. If the price makes a higher high but the RSI makes a lower high, it confirms internal weakness and a high probability of reversal.
- MACD bearish crossover: Confirm the trend shift with MACD. Ideally, the MACD lines should cross downwards or the histogram should flip below zero before or exactly when the price breaks support.
- EMA breakdown: Moving averages provide dynamic confirmation. A high-probability short signal occurs when the price breaks both the wedge support and the 20 or 50-period EMA simultaneously, signaling a total trend failure.
8. What Do Real Rising Wedge Examples Look Like?
Theory is helpful, but seeing the pattern in live markets is where the real learning happens. Here are three case studies across different asset classes showing how the rising wedge pattern creates high-value trading opportunities.
8.1. Forex Example (GBP/USD)
The GBP/USD pair is in a long-term downtrend on the 4-hour chart. Price rallies for a few days, forming a tight channel where the lows are rising faster than the highs. This is a classic bearish continuation setup.
- The Trade: As the price approaches the apex, volume drops. Suddenly, a strong red candle breaks below the support line. Traders enter a short position immediately, riding the momentum as the pair crashes to a new monthly low.
8.2. Crypto Example (Bitcoin/BTC)
Bitcoin rallies aggressively to $60,000 but starts to struggle. On the daily chart, it forms a rising wedge with diverging RSI (price up, RSI down). Buying volume is drying up despite the new highs.
- The Trade: The price breaks the lower trendline at $58,000. Smart money recognizes the exhaustion and sells. The breakdown triggers a cascade of stop-losses, causing a rapid $5,000 drop in just two days.
8.3. Stocks Example (Nvidia/NVDA)
After a massive 6-month rally, Nvidia stock begins to chop upwards. It is making Higher Highs, but they are barely edging past previous peaks. This forms a bearish reversal wedge.
- The Trade: The stock gaps down below the wedge support on an earnings report or bad news. Traders treat this as a major trend change signal and initiate short positions or buy Put options, profiting as the stock enters a multi-week correction towards a lower price target.
9. What Are Common Mistakes Traders Make With Rising Wedges?
Even experienced traders can lose money if they rush into a trade without following the rules. Most losses come from impatience or misidentifying the market structure. Avoiding these four traps will significantly improve your success rate.
- Trading before the breakout: Impatience is an account killer. Entering a short position while the price is still bouncing inside the wedge is dangerous, as it can easily rally one last time. Always wait for a candle close below the support line.
- Confusing channels with wedges: Geometry matters. A rising wedge must have converging lines. If the support and resistance lines are parallel, it is an Ascending Channel, which often signals a healthy uptrend, not a reversal.
- Ignoring divergence & volume signals: Shape alone isn’t enough. A valid rising wedge needs evidence of dying momentum. Shorting a wedge where volume is increasing or RSI is making new highs is risky; you must see declining volume and RSI bearish divergence.
- Using wedge alone without trend context: No pattern works in isolation. A small wedge on a 5-minute chart is meaningless against a massive Daily uptrend. Always zoom out and ensure the wedge aligns with a major resistance level or higher timeframe trend.
10. Which Tools Can Help You Spot Rising Wedges?
Identifying converging lines manually can be subjective and time-consuming. Modern trading platforms offer automated tools and scanners to detect these formations instantly.
- TradingView (Built-in Scanner): You don’t need custom code. Go to the “Indicators” tab, select “Technicals” > “Chart Patterns,” and choose “Rising Wedge”. The platform will automatically highlight valid patterns on your chart in real-time.
- TrendSpider (AI Recognition): This platform is built for automated technical analysis, using AI to scan thousands of charts instantly. Its “Market Scanner” uses AI to search through thousands of stocks or crypto pairs to find specific geometric shapes, including the rising wedge , saving you hours of manual analysis.
- MT4/MT5 (Custom Indicators): MetaTrader does not have this feature by default. You can download custom tools like “Wedge Pattern Scanner” from the MQL5 Market. These indicators draw the trendlines for you and send alerts when the price nears the breakdown point.
- AI Detection Tools (LuxAlgo & Finviz): LuxAlgo is a premium TradingView script that uses smart algorithms to detect patterns and project breakout targets. Finviz is a free web screener where you can filter stocks specifically by “Wedge” patterns under the Technical tab.
11. Frequently asked questions about the Rising Wedge Pattern
13. Conclusion
The rising wedge pattern is a severe warning sign that a strong reversal or deeper downtrend is imminent. While the price may look bullish as it grinds higher, the narrowing range and fading volume reveal that the buyers are exhausted and a crash is likely.
To trade this pattern successfully, never guess the top. Wait for the confirmed breakdown of the lower trendline and look for volume confirmation before entering. By combining technical signals with multi-timeframe analysis, you can turn this dangerous pattern into a high-probability selling opportunity.
Ready to spot the next big reversal? Explore the comprehensive trading strategies at Piprider today.