Successful market analysis requires a clear understanding of price architecture. At the core of this framework is swing high swing low trading, the systematic identification of pivotal turning points that define market structure. These peaks and valleys are not merely price fluctuations; they serve as objective markers for trend direction, supply/demand zones, and potential reversals. This guide provides a professional approach to mapping these structural pivots to improve trade execution and risk management.
Key Takeaways
- Swing highs and lows are the peaks and valleys that form the market’s structure and define trends.
- A series of higher highs and higher lows signals an uptrend, while lower highs and lower lows indicate a downtrend.
- These swing points act as natural levels of support and resistance, providing clear areas to plan entries, exits, and stop-losses.
- A swing high is a candle with two lower highs on each side; a swing low has two higher lows on each side.
- The most reliable swing points are confirmed by other factors like high volume or rejection candles at key levels.
1. What Are Swing Highs and Swing Lows in Trading?
Swing highs and swing lows is far more than just temporary peaks and valleys on a chart; they are the fundamental building blocks of market structure. These pivotal price movements are not random; they reveal the ongoing battle between buyers and sellers.
In modern price action trading, identifying valid swing points goes beyond finding local highs and lows. They serve three critical structural purposes: defining the overarching trend, mapping logical zones of support and resistance, and identifying a break of structure (BOS) when market momentum shifts.
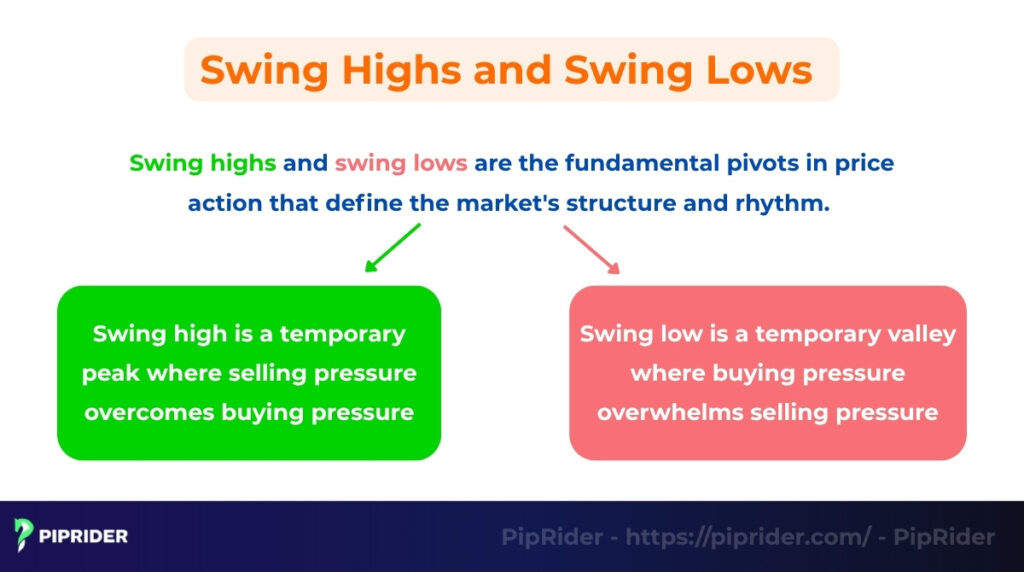
What is a swing high?
A swing high is a structural peak where selling pressure temporarily overcomes buying pressure, causing the price to turn down and often leaving behind a zone of resistance. For example, if EUR/USD rallies to 1.0950 and then falls back to 1.0920, the 1.0950 level marks a valid swing high.
What is a swing low?
A swing low is a structural valley where buying pressure overwhelms selling pressure, causing the price to turn up and potentially establishing a new support level. For instance, if EUR/USD drops to 1.0800 and then rallies back to 1.0830, the 1.0800 level marks a swing low.
The continuous sequence of these turning points creates the market’s underlying architecture. Understanding this sequence is the clearest way to read the true flow of price and identify where institutional liquidity might reside.
2. Why Swing Highs and Lows Matter: Decoding Market Structure
Understanding swing points is more than just a technical exercise; it is a core foundation of professional price action trading. Instead of relying solely on lagging indicators, many traders use these pivots to read the raw data of the market. Here is why they are critical:
Defining the Trend (Trend Identification):
The sequence of swing highs and lows provides a highly objective method for identifying the current market trend. This framework is rooted in Dow Theory, the bedrock of technical analysis, which defines a trend by its structural progression of higher peaks and troughs.
- Uptrend: The market is in a bullish phase when it prints a clear series of Higher Highs (HH) and Higher Lows (HL). As long as the price continues to break previous resistance (forming a new HH) and respects previous support (forming a new HL), the uptrend is generally considered structurally intact.
- Downtrend: The market is in a bearish phase when it prints a series of Lower Highs (LH) and Lower Lows (LL). As long as the price continues to break previous support (forming a new LL) and respects previous resistance (forming a new LH), the sellers remain in control.
- Ranging Market: When the price moves sideways, creating relatively equal highs and equal lows without a clear HH/HL or LH/LL sequence, the market is in consolidation.
Signaling Trend Changes (Break of Structure):
An early objective sign that a trend might be ending is a structural failure. This occurs when an uptrend fails to make a new higher high and breaks below its recent higher low (often referred to as a Break of Structure or BOS), or conversely, when a downtrend fails to make a new lower low and breaks above its recent lower high.
Creating High-Probability Support and Resistance:
Previous swing highs naturally transition into resistance zones, while previous swing lows become logical support zones. These are specific areas where institutional liquidity is often clustered, making them logical areas to observe for potential entries and to structure stop-loss orders.
3. Steps to Identify Swing Highs and Lows
Identifying swing points accurately requires a systematic, rule-based approach. While this becomes second nature with practice, following these steps helps traders start correctly.
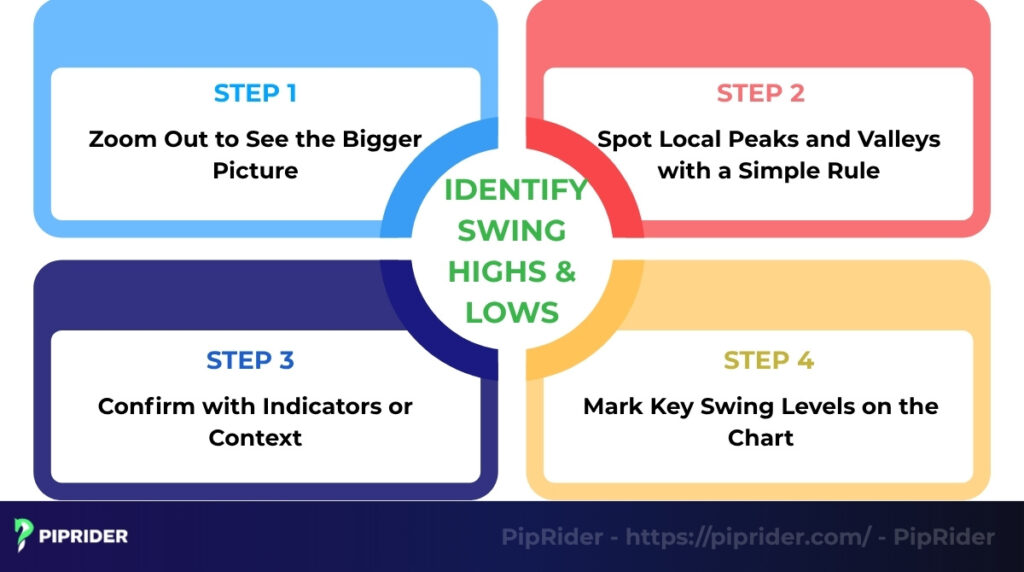
3.1. Step 1: Zoom Out to See the Bigger Picture
Before looking for individual swings, a trader should zoom out or move to a higher timeframe (like the H4 or Daily chart). This allows for a view of the major, significant turning points and helps filter out the minor, less important price fluctuations, often called “market noise.”
3.2. Step 2: Spot Local Peaks and Valleys with a Simple Rule
The most common mechanical rule for identifying a swing point is the “three-candle rule” (though some traders use a five-candle rule for stronger confirmation):
- A Swing High is a candle that has a higher high than the candles immediately to its left and right.
- A Swing Low is a candle that has a lower low than the candles immediately to its left and right.
3.3. Step 3: Confirm with Indicators or Context
While the candle rule is a great start, the most reliable swing points have additional confirmation:
- Fractals Indicator: Many trading platforms have a “Fractals” indicator that automatically marks these three or five-candle swing points.
- Volume: A swing low that forms on a spike in volume is more significant, as it suggests strong buying interest at that level.
- Rejection Candles: Swings that form with powerful rejection candles (like pin bars or hammers) are more reliable, as these price patterns indicate a strong shift in momentum.
3.4. Step 4: Mark Key Swing Levels on the Chart
Once a significant swing high or low has been identified, a horizontal line should be drawn at that price level. These marked levels become objective support and resistance zones for planning future trades, drawing trendlines, and identifying breakouts.
4. Practical Applications: How to Use Swing Points in Trading
Once a trader can accurately identify the market structure, swing points transition from theoretical concepts into practical tools. They form the core mechanics of trade execution, specifically for pinpointing entries and managing risk.
4.1. Pinpointing Entry Zones (The Retest Strategy)
Professional traders generally avoid chasing the price during strong momentum bursts. Instead, they use previous swing points as high-probability zones to plan their entries.
- The Concept: A core principle of price action is that broken resistance often becomes new support, and broken support often becomes new resistance.
- Buy Entry Setup: In an established uptrend, after the price breaks above a previous swing high, traders typically wait patiently for a pullback. They look to enter a long position when the price retests that broken swing high (now acting as support), ideally waiting for a bullish confirmation candle before executing the trade.
- Sell Entry Setup: In a downtrend, traders look for the price to break a swing low, pull back to retest that level as new resistance, and print a bearish confirmation signal before entering a short position.
4.2. Strategic Stop-Loss Placement (Invalidation Levels)
This is often considered a critical utility of a swing point. It is generally advised to avoid placing a stop-loss based purely on a random pip count or fixed monetary amount; rather, it is more effective when placed at a structural level where the trading premise is structurally invalidated.
- Placing the Stop: If a trader enters a buy trade at a newly formed Higher Low, the logical stop-loss placement is just below the previous swing low. Why? Because if the price breaks below that point, the uptrend structure (HH/HL) is invalidated, and the bullish bias is no longer valid. For a step-by-step guide on determining your position size based on these structural levels, learn how to calculate stop loss effectively to protect your trading capital.
- The Buffer Rule: To help avoid being prematurely stopped out by market noise or spread fluctuations, it is highly recommended to add a small price buffer (e.g., a few pips or a fraction of the ATR) just beyond the exact swing high or low.
4.3. Identifying Take-Profit Targets (Liquidity Zones)
Just as swing points help define structural risk (stop loss), they also provide objective targets for taking profits. Previous swing highs and lows act as natural magnets for price, often referred to as liquidity pools. If a trader enters long during a pullback, a logical and conservative initial take-profit target is the most recent swing high.
5. Swing High Swing Low Trading Strategy: A Multi-Timeframe Approach
Relying on a single timeframe can often lead to false signals. This step-by-step strategy combines Higher Timeframe (HTF) market structure with Lower Timeframe (LTF) entry triggers, offering a logical framework to improve precision and optimize the Risk-to-Reward ratio.
5.1. Step 1: Establish the Higher Timeframe (HTF) Bias
The first step is to determine the macro direction using a primary chart, such as the Daily or H4 timeframe.
- Identify the overarching market structure by locating the major swing highs and swing lows.
- If the HTF is printing a clear sequence of Higher Highs and Higher Lows, the primary bias is bullish. Traders should look to align their positions with this dominant momentum.
5.2. Step 2: Map the Structural Zones (Points of Interest)
Once the HTF trend is established, the next step is to map out the logical zones where the price is most likely to react.
- Mark the most recent significant swing points with horizontal lines.
- In an established uptrend, the previous HTF swing high (which was broken) and the most recent HTF swing low act as your primary support zones, often referred to as Points of Interest (POIs) or liquidity zones. The goal is to wait patiently for the price to pull back into these specific areas.
5.3. Step 3: Wait for a Lower Timeframe (LTF) Structure Shift
This is where the strategy moves from basic to advanced. Instead of blindly entering a trade the moment the price touches the HTF support zone, it is generally advised to zoom into a lower timeframe (such as the H1 or M15 chart) to look for a micro-structural confirmation.
- As the price drops into your HTF support zone, the LTF will typically be in a short-term downtrend (making lower highs and lower lows).
- The Trigger: Wait for the LTF structure to break. You are looking for a short-term Change of Character (ChoCH) or a micro Break of Structure (BOS) to the upside. When the LTF prints its first new Higher High inside the HTF support zone, it provides an objective signal that the buyers are regaining control.
5.4. Step 4: Execution and Risk Parameters
With the HTF trend and LTF momentum now aligned, the trade execution becomes highly structural.
- Entry: An entry is typically planned on the first minor pullback (forming a Higher Low) on the lower timeframe after the initial structure shift.
- Stop-Loss: The stop-loss is strategically placed slightly below the newly formed LTF swing low, incorporating a standard spread buffer. Because the stop is based on the lower timeframe, it allows for a much tighter risk parameter.
- Take-Profit: The primary take-profit target is set at the recent HTF swing high. Combining a tight LTF stop-loss with an HTF profit target often results in highly favorable Risk-to-Reward (R:R) setups.
6. Advanced Tools and Techniques for Swing High/Low Analysis
Once a trader masters basic swing identification, they can combine it with other powerful tools and technical indicators to help enhance the precision and probability of their trades.
6.1. Fibonacci Retracement
The Fibonacci Retracement tool synergizes effectively with swing points. By drawing the tool from a significant swing low to a swing high in an uptrend, traders can identify high-probability pullback zones. The area between the 38.2% and 61.8% retracement levels is often considered the “golden zone” for finding a high-quality entry.
6.2. RSI or MACD Divergence
Divergence serves as a valuable early warning signal for a potential trend reversal. The Relative Strength Index (RSI), originally developed by J. Welles Wilder Jr., is particularly effective when used as a momentum oscillator to identify overbought or oversold conditions relative to these swing points.
When the price makes a new swing high, but an oscillator like the RSI or MACD makes a lower high, it creates a bearish divergence. This indicates that the momentum behind the price move is weakening and the trend may soon reverse, especially if the oscillator is also showing overbought conditions. The opposite is true for a bullish divergence forming during oversold conditions.
6.3. Volume Profile and Order Blocks
Advanced traders often use volume analysis to qualify swing points. (Note: Since Spot Forex lacks centralized volume, this technique relies on tick data or is best applied using currency futures feeds). As the Bank for International Settlements (BIS) confirms in its Triennial Central Bank Survey, the Forex market operates as a decentralized OTC market, making tick volume a reliable proxy for institutional liquidity concentration.
A swing low that forms in an area with a high concentration of volume (as shown by a Volume Profile) is more significant, as it suggests an “accumulation zone” where large players are stepping in. Furthermore, identifying Order Blocks or “imbalances” near these swing points can help pinpoint institutional entry levels with a higher degree of precision.
7. Common Mistakes When Trading Swing Points
While swing trading is a powerful concept, traders often make several common mistakes that can lead to unnecessary losses. Avoiding these pitfalls is highly recommended for long-term consistency.
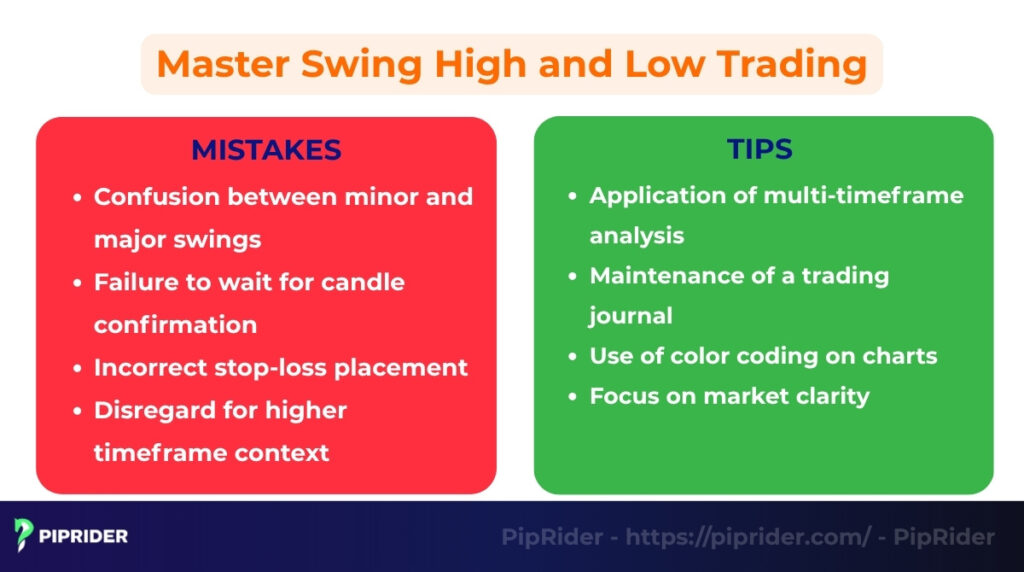
- Confusion between minor and major swings: Treating every small peak and valley as a significant swing point is a frequent error. This often leads to overtrading and getting caught in market noise.
- Failure to wait for candle confirmation: Executing an entry based on a candle that is still forming is highly risky. The price can reverse before the period closes, creating a false signal.
- Incorrect stop-loss placement: Placing stop-loss orders exactly at the swing high or low makes the position vulnerable to being “stop hunted” by minor volatility spikes (This is why applying the Buffer Rule, discussed earlier, is so important).
- Disregard for higher timeframe context: A bullish setup on a 15-minute chart generally becomes a lower-probability trade if the daily chart is in a strong downtrend.
8. Tips to Master Swing High and Low Trading
Mastering market structure takes practice and discipline. Here are four practical tips to help accelerate the learning process and improve trading accuracy.
- Application of multi-timeframe analysis: As detailed in our step-by-step strategy section, analyzing swings across multiple timeframes is one of the most effective approaches. Always align your lower timeframe entries with the primary trend of a higher timeframe.
- Maintenance of a trading journal: Actively logging every swing setup taken, including chart screenshots, helps train the eye to recognize high-probability patterns faster. This data is invaluable for backtesting and reinforcing emotional discipline.
- Use of color coding on charts: Manually marking swing points with a consistent color code (e.g., red for resistance/swing highs, green for support/swing lows) can make the market structure much easier to track visually.
- Focus on market clarity: High-probability trades often emerge from the clearest structural signals. It is generally advised to prioritize obvious swing points in a strongly trending market and ignore ambiguous fluctuations during tight consolidation.
9. Frequently asked questions about Swing High Swing Low Trading
10. The Bottom Line
Swing high swing low trading are the key to reading market structure and identifying potential trend reversals early. When combined with tools like trendlines, Fibonacci, and the RSI, they provide a powerful framework for increasing the accuracy of trading signals. Just as high is to low as near is to far, these opposite points define the boundaries of market action.
Mastering the skill of how to identify swing high and swing low is a core component of price action trading that every serious trader should strive to perfect. To see how these concepts are applied in different scenarios, explore more articles in the Trading Strategies section at Piprider.