The Williams %R (Williams Percent Range) is a momentum oscillator developed to measure where the current closing price sits relative to the highest high and lowest low of a specific look-back period (N periods). Rather than predicting the future, it helps traders objectively identify overbought or oversold conditions and spot potential shifts in market momentum.
This guide details the %R’s calculation, explains how to interpret its extreme readings, and shows how to integrate it into a disciplined, risk-managed trading strategy to validate price action.
Key Takeaways
- Williams %R is a momentum oscillator developed to measure the speed at which price hits the high or low of a recent range.
- It’s the inverse of the Fast Stochastic Oscillator, oscillating between 0 and −100.
- Readings from 0 to −20 signal overbought conditions; −80 to −100 signal oversold conditions.
- The most reliable signal occurs when the indicator moves out of an extreme zone, confirming the reversal is underway.
- Williams %R indicator is fast but noisy. It must be combined with trend analysis (e.g., Moving Averages) to filter false signals, especially during strong, sustained trends.
1. What Is the Williams %R Indicator?
The Williams %R (Williams Percent Range) is a powerful momentum oscillator developed by legendary trader Larry Williams, first popularized in his 1973 book “How I Made One Million Dollars Last Year Trading Commodities” (Williams, 1973).
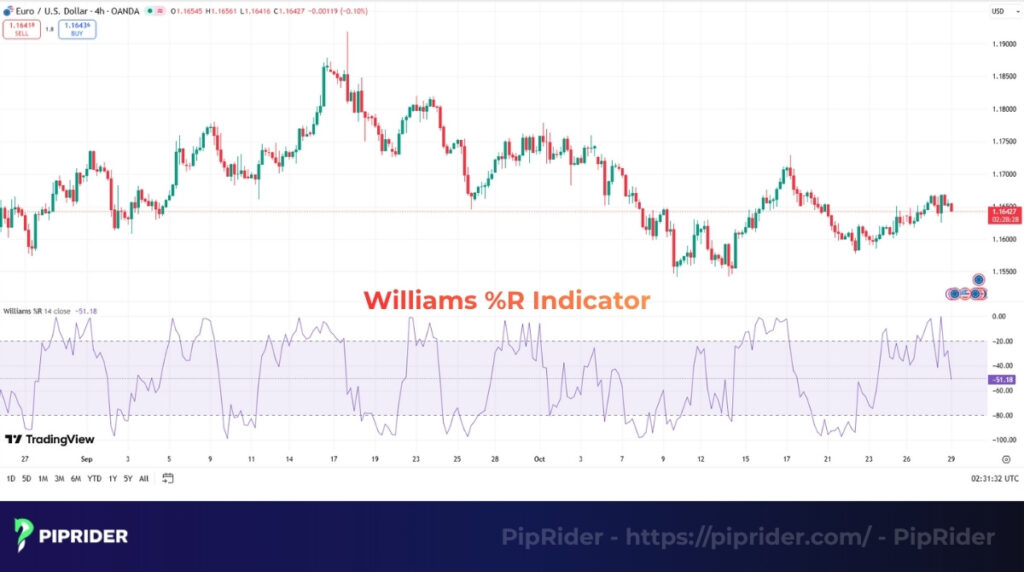
The indicator’s primary function is to measure buying and selling pressure. It is calculated by comparing the current closing price against the highest and lowest prices within a specified look-back period (typically 14 periods).
This measurement directly reflects how much momentum remains in a move: if the close is near the top of the range, momentum is strong; if it’s near the bottom, momentum is weak.
The Williams %R offers an inverted view compared to other popular oscillators. It differs from the RSI (magnitude of changes) and the Stochastic Oscillator, developed by George Lane in the 1950s (StockCharts.com, 2024). The %R focuses on the distance to the highest high and uses a unique scale that runs from 0 to −100. This makes it an extremely sensitive and fast tool for detecting potential short-term reversals.
2. How the Williams %R Works
The Williams Percentage Range works on a simple yet powerful logic: it measures the current short-term strength of buyers and sellers by determining how close the closing price is to the extremes of its recent trading range.
The indicator is unique because it oscillates within an inverted range of 0 to −100.
- When the reading approaches 0 (e.g., −20 or higher), it means the closing price is near the highest high of the look-back period. This indicates strong buying pressure and an overbought market, suggesting a potential price reversal to the downside.
- When the reading approaches −100 (e.g., −80 or lower), the closing price is near the lowest low. This signals intense selling pressure and an oversold market, often preceding a potential upward reversal.
Traders specifically use the extreme readings of the Williams %R to detect early reversal points, anticipating a snapback when the buying or selling momentum has reached an unsustainable peak. This mechanism is rooted in the principle of mean reversion.
3. How to Calculate the Williams %R
The calculation of the Williams %R is essential to understanding its logic, as it directly translates the closing price’s position into a percentage reading relative to the chosen look-back period.
3.1. The Formula
The %R compares the distance from the highest high to the current close against the entire high-low range of the look-back period. The resulting value is then multiplied by −100 to create the unique, inverted scale.
%R = (Highest High − Current Close) / (Highest High − Lowest Low) × (−100)
- Highest High: The highest price recorded over the specified period (e.g., the last 14 days).
- Lowest Low: The lowest price recorded over the specified period.
- Current Close: The most recent closing price.
3.2. Step-by-Step Calculation Example
Let’s assume a standard 14-period look-back for an asset:
- Determine the Range: Find the highest high ($105) and the lowest low ($95) over the last 14 periods. The total range is
$105 − $95 = $10
- Determine the Close Position: If the current close is $104.
- Apply the Formula:
%R = ($105 − $104) / ($105 − $95) × (−100)
%R = ($1 / $10) × (−100) = 0.1 × (−100) = −10
- Interpretation: A reading of −10 means the close is only 10% down from the highest high of the last two weeks, confirming the market is heavily overbought. If the close were $96, the calculation would yield −90, confirming an oversold condition.
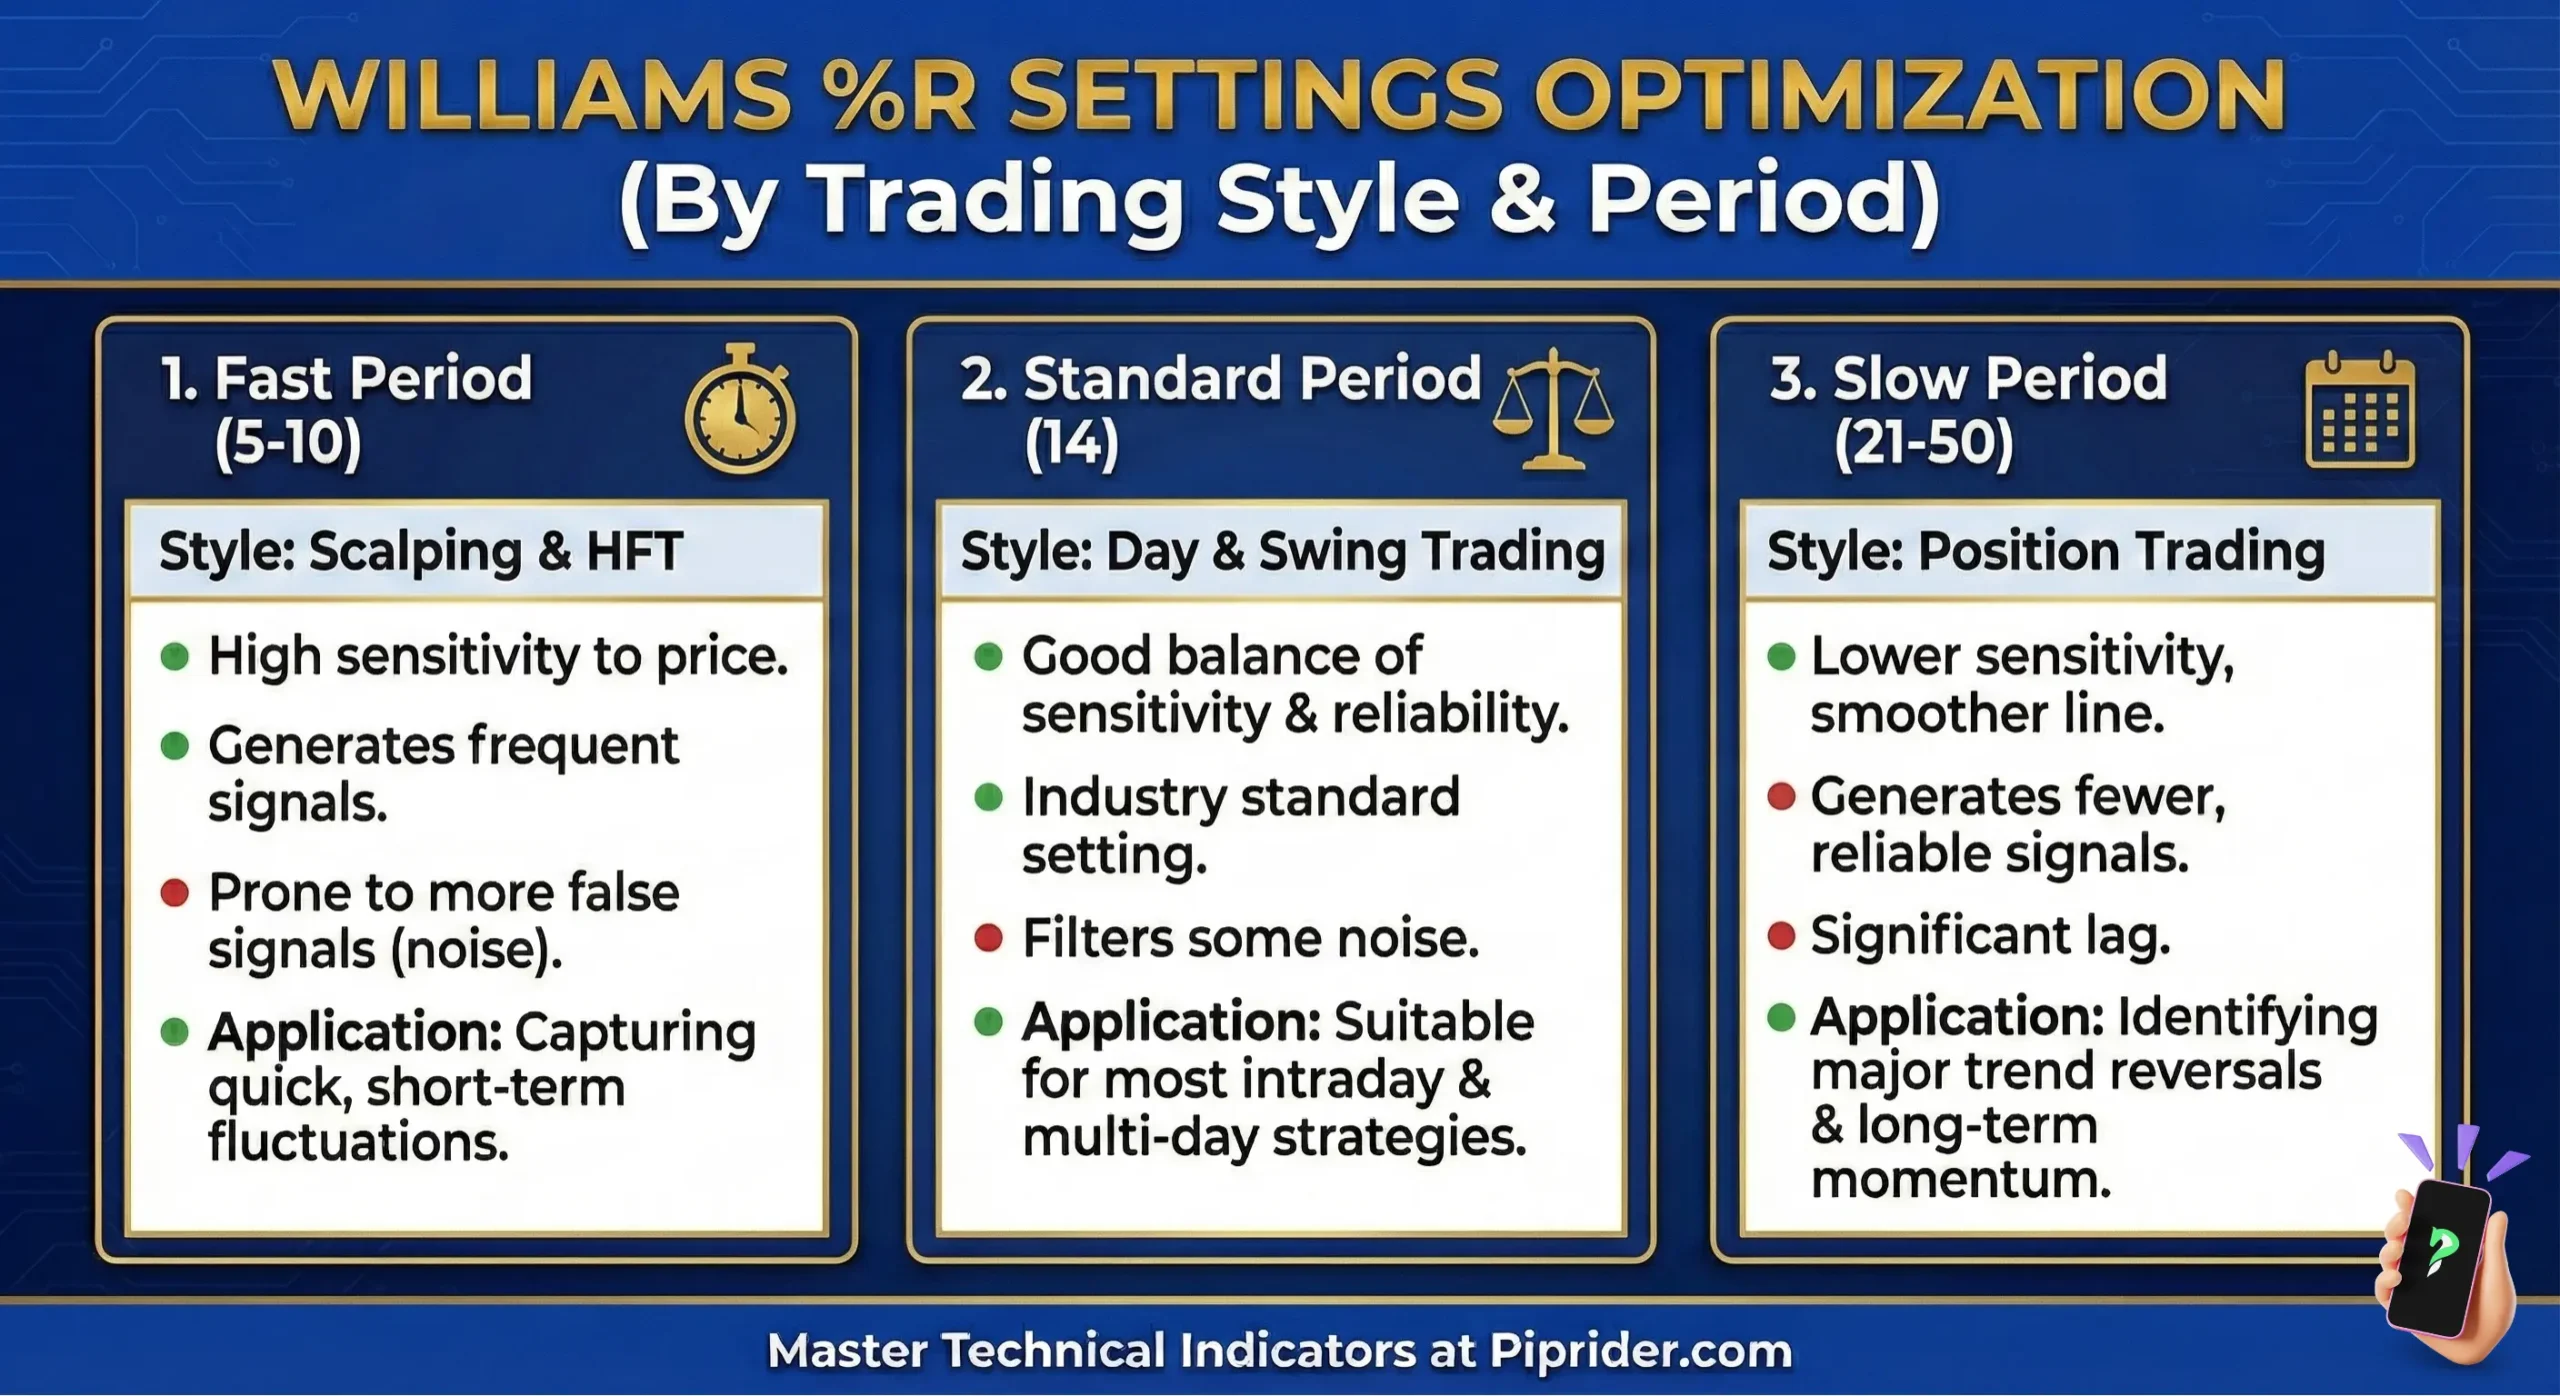
3.3. Recommended Settings
The look-back period (N) directly impacts the sensitivity and number of signals the indicator generates.
| Trading Style | Recommended Period (N) | Rationale |
|---|---|---|
| Scalping/Day Trading | 9 Periods | Less filtering for faster signals; highly sensitive to intraday moves. |
| Swing Trading (Default) | 14 Periods | The standard setting offers a balanced view of short-term momentum. |
| Position Trading | 21 Periods | Smoother, less volatile signals; ideal for catching major turns in longer trends. |
4. How to Interpret Williams %R Indicator
Interpreting the %R involves monitoring the indicator’s position within its −100 to 0 range to gauge market extremes and underlying momentum shifts. This process is fundamental to effective technical analysis.
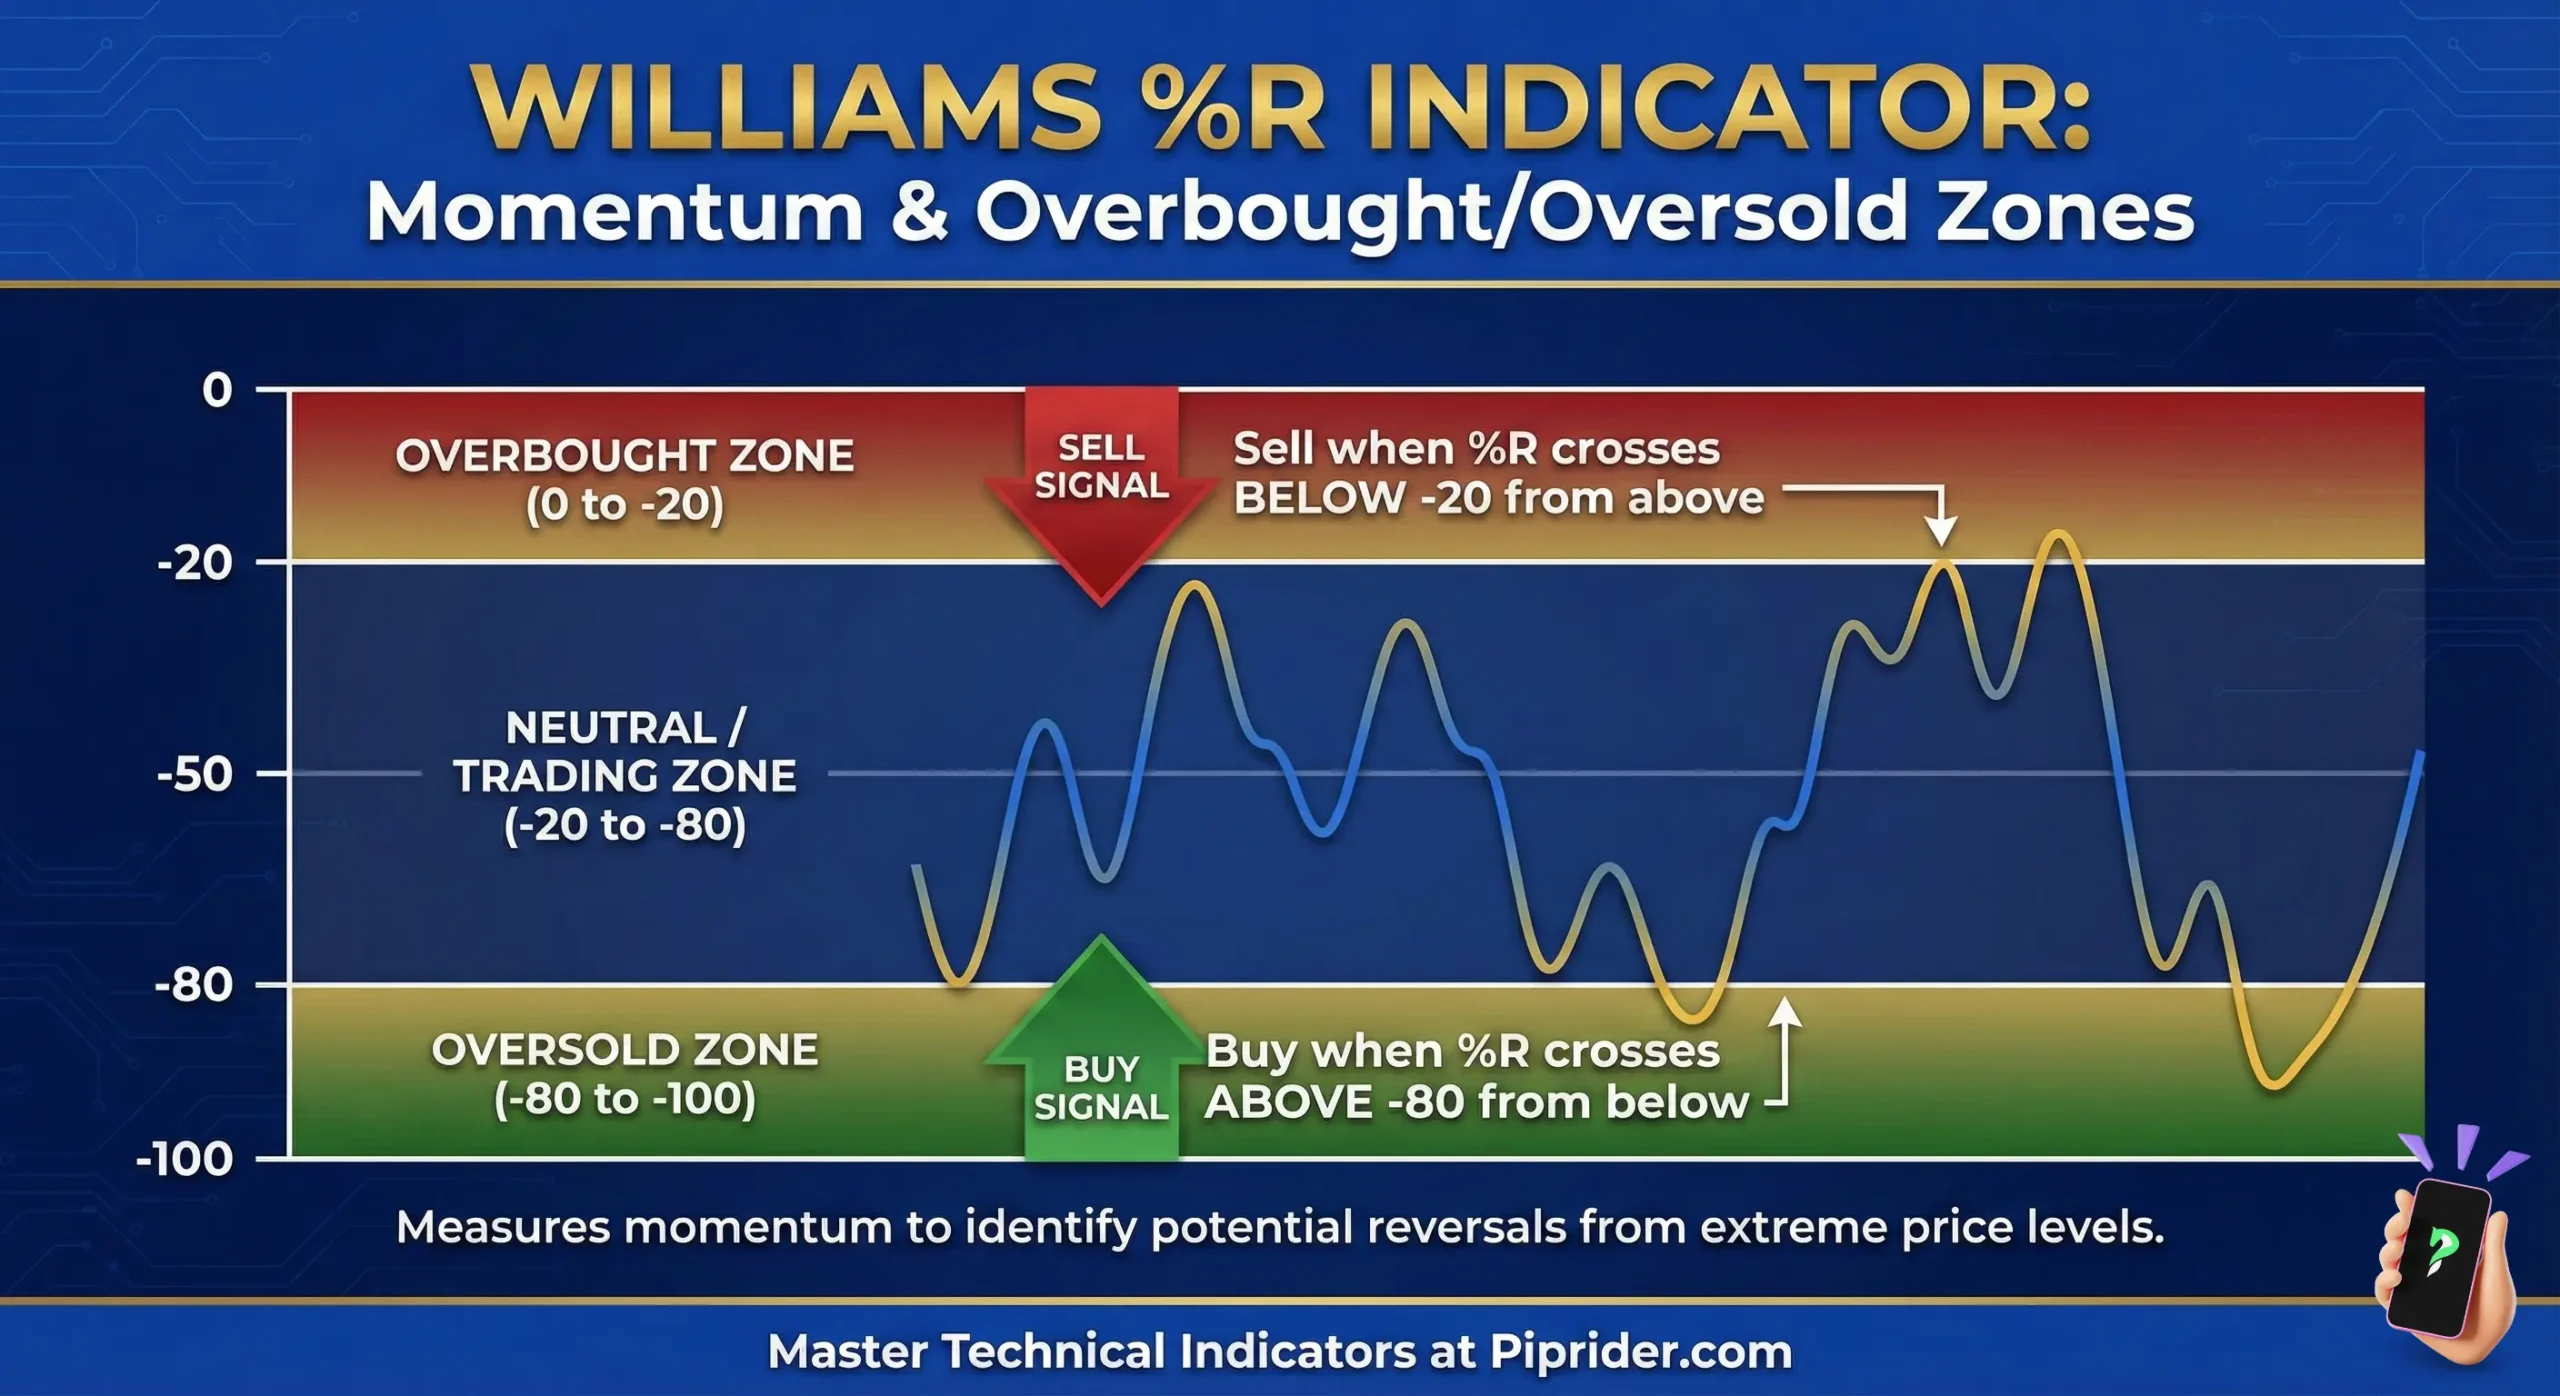
4.1. Overbought and Oversold Levels
The Williams %R identifies overbought (0 to −20) and oversold (−80 to −100) zones to highlight when short-term price momentum has reached a statistical extreme.
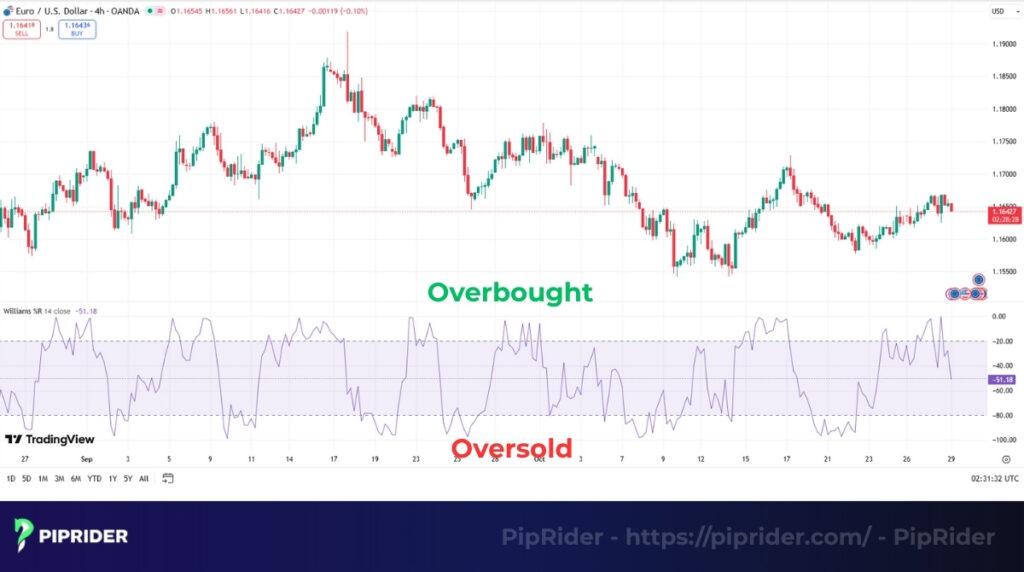
- Overbought (0 to −20): The asset is closing near the highest high of its look-back period. This suggests buying momentum is peaking, signaling a potential downside reversal.
- Oversold (−80 to −100): The asset is closing near the lowest low of its look-back period. This suggests selling momentum is peaking, signaling a potential upside reversal.
Pro Tip on Customization: While −20 and −80 are standard defaults, they are not rigid rules. Professional traders frequently tighten these thresholds (e.g., to −10 and −90) based on an asset’s historical volatility to filter out premature signals in highly erratic markets.
The Context Filter: The “Pinned” Indicator Trap
A common rookie mistake is treating every extreme reading as an immediate reversal signal. In a real market context, an extreme %R reading often confirms trend strength, not exhaustion.
- In a Strong Uptrend: The %R can remain “pinned” in the overbought zone (0 to −20) for extended periods. This confirms sustained buying pressure. It is not a signal to short.
- In a Strong Downtrend: The %R can remain “pinned” in the oversold zone (−80 to −100). This confirms sustained selling pressure. It is not a signal to buy.
The Execution Rule: Never trade blindly off a touch of the extreme line. Always wait for the indicator to decisively exit the extreme zone (e.g., cross back below −20 or above −80) to confirm that momentum is actually shifting.
4.2. Momentum Failure Signals
A momentum failure occurs when a price pulls back within an established trend, but the %R indicator fails to reach its opposite extreme zone. This signals that the counter-trend move lacks conviction.
- Bullish Failure (Uptrend Continuation): Price pulls back (drops), but the %R fails to drop below −80 (oversold). This indicates that sellers are too weak to drive momentum down, reinforcing the probability that the main uptrend will resume.
- Bearish Failure (Downtrend Continuation): Price rallies (rises), but the %R fails to rise above −20 (overbought). This indicates that buyers lack the strength to push momentum higher, reinforcing the probability that the main downtrend will continue.
Practical Application: While beginners obsess over extremes to predict reversals, professional traders use Momentum Failures as high-probability trend-continuation setups. It provides a structural entry point to “buy the dip” or “sell the rally” safely.
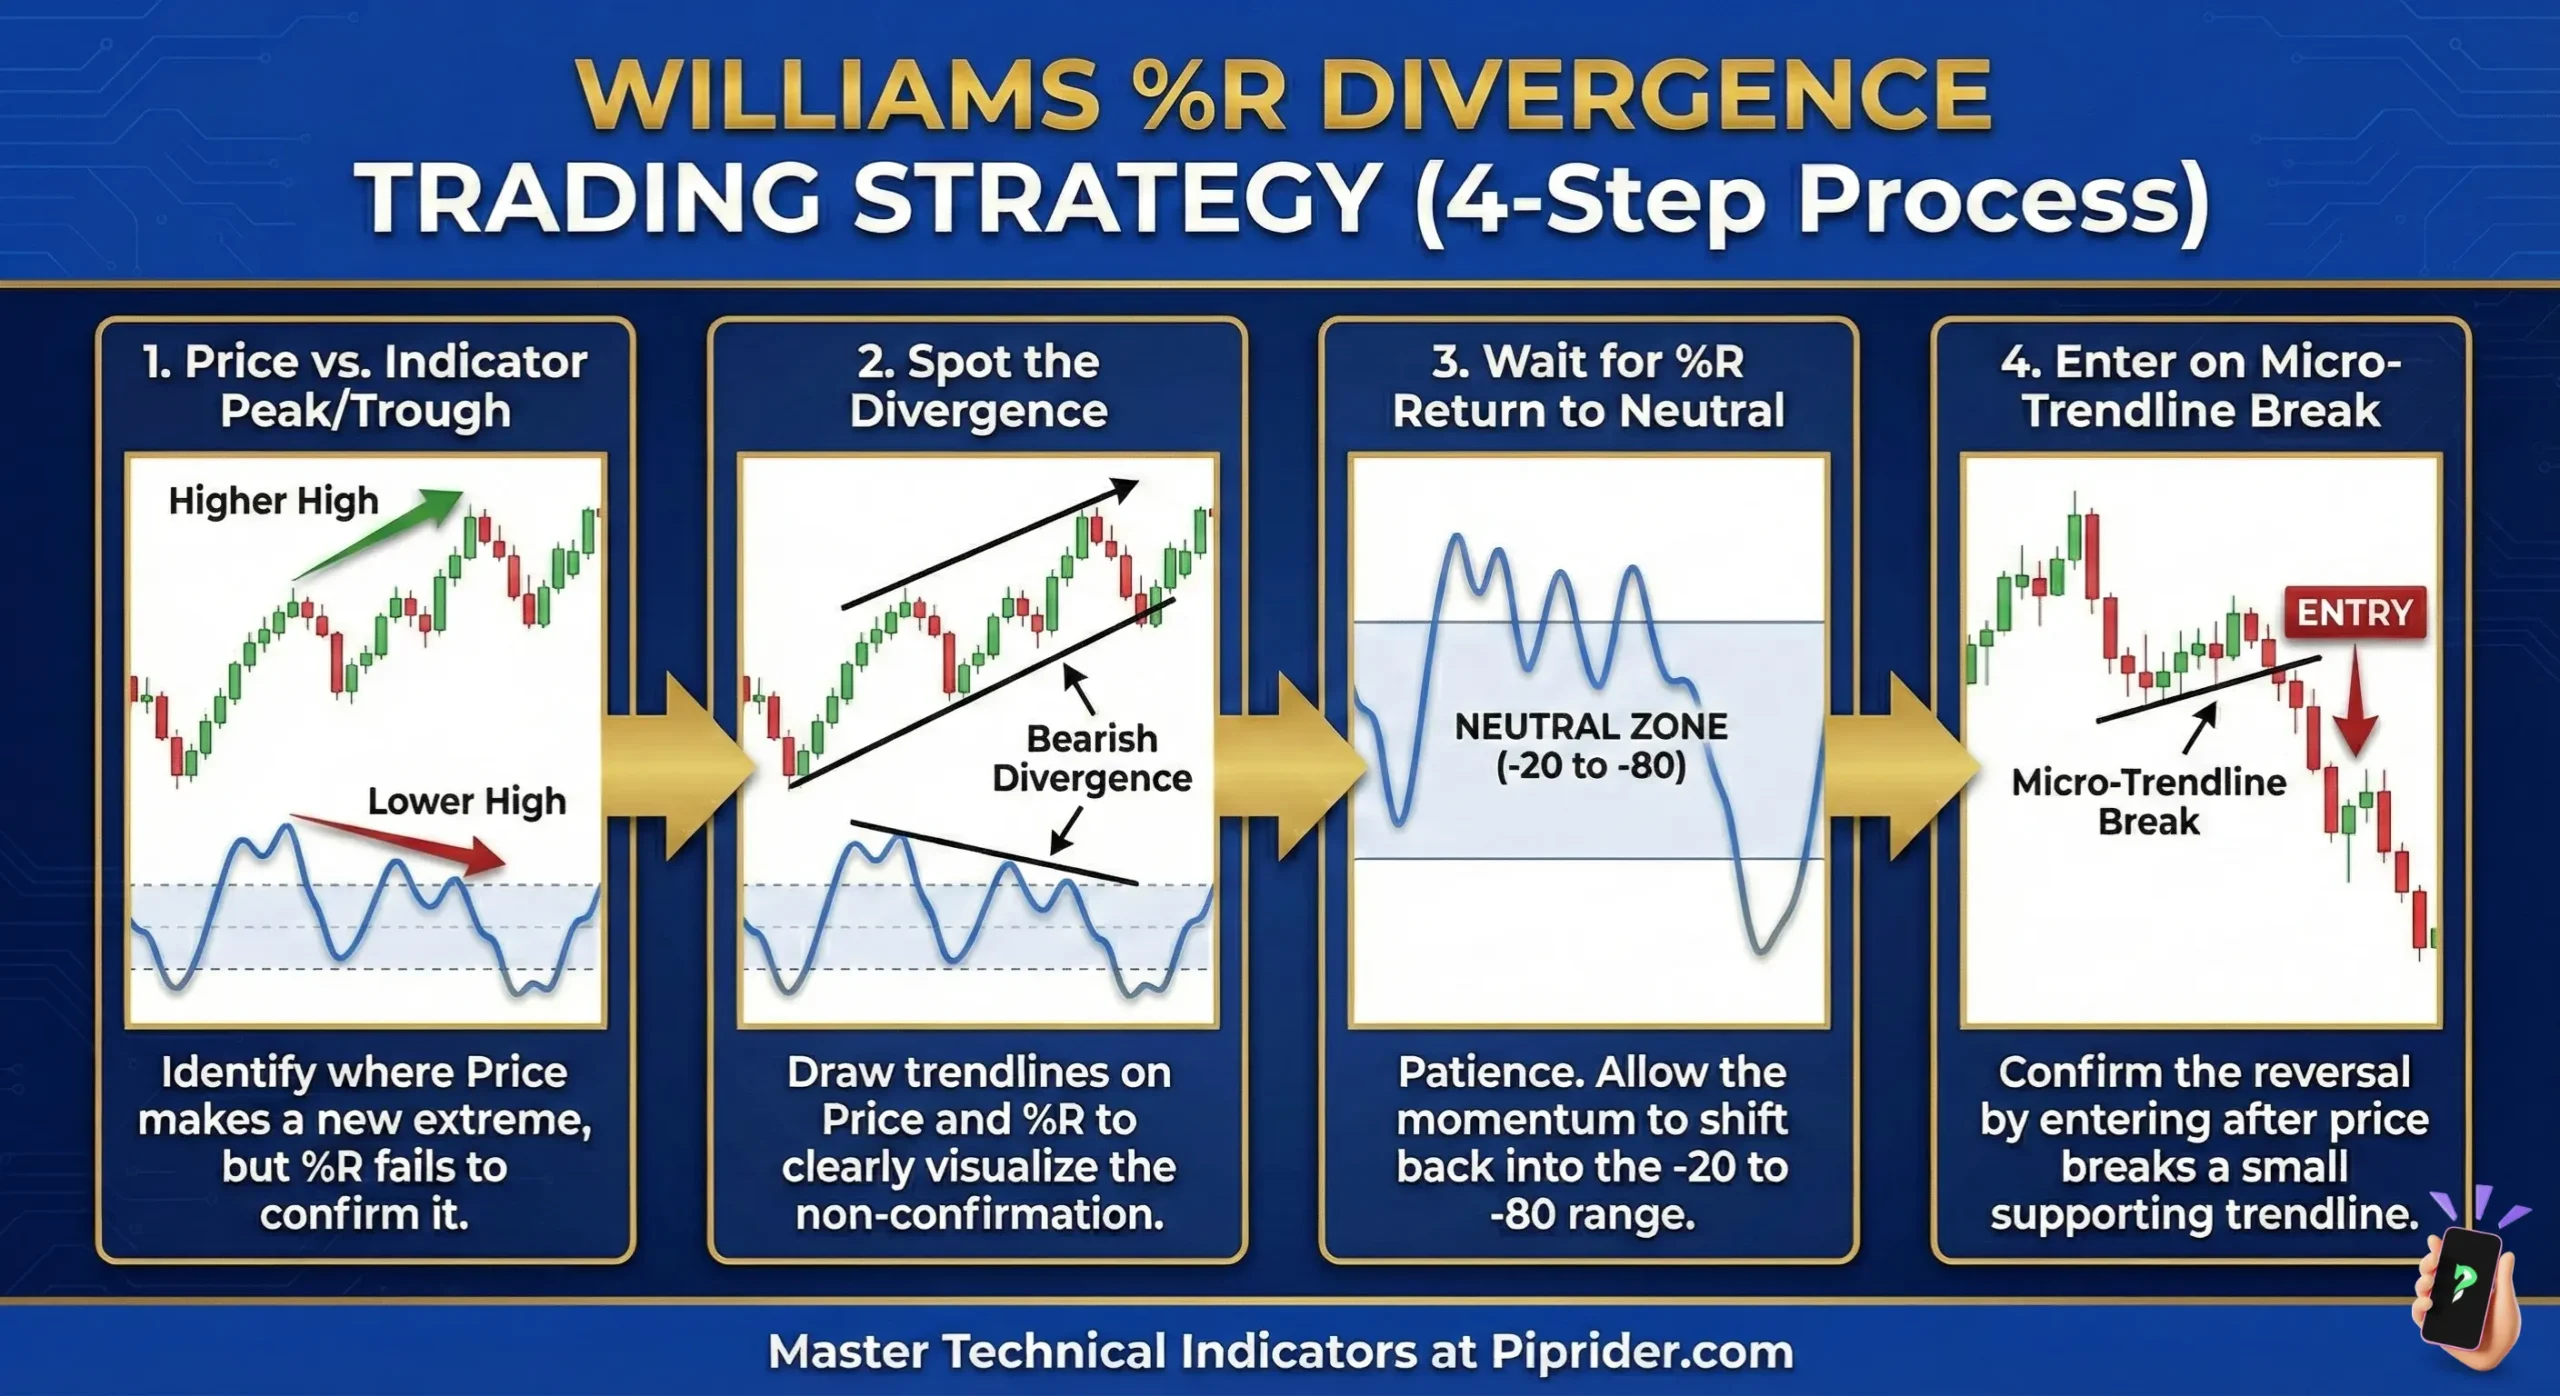
4.3. Divergences
Divergence is a crucial advanced signal that anticipates a potential structural trend change before it becomes obvious on the price chart.
- Bullish Divergence: Price prints a lower low, but the %R prints a higher low. This structural mismatch suggests that underlying selling momentum is drying up, providing an early warning of an upward reversal.
- Bearish Divergence: Price prints a higher high, but the %R prints a lower high. This suggests that underlying buying pressure is exhausting, anticipating a potential move to the downside.
The Divergence Trap: Divergence is an early warning, not an immediate entry trigger. In highly aggressive trends, divergence can build up for an extended period while the price continues to move against you. Execution Rule: Never trade divergence in isolation. Always wait for a definitive break in the price structure or for the %R to cross the −50 centerline to confirm the reversal.
4.4. Center Zone Movement
The −50 centerline represents the exact midpoint of the look-back period’s high-low range, acting as the critical balance point between buyer and seller control.
- Above −50: Prices are trading in the upper half of the recent range. Buyers have the structural advantage (momentum is positive).
- Below −50: Prices are trading in the lower half of the recent range. Sellers have the structural advantage (momentum is negative).
Pro Tip – The “Momentum Bounce”: In a healthy, sustainable trend, the −50 line often acts as dynamic momentum support or resistance. For example, during a strong uptrend, if the %R pulls back but “bounces” directly off the −50 line and heads back toward 0, it strongly confirms that buyers are actively defending the trend.
5. How to Trade Using Williams %R (Strategy Cards)
The Williams %R is rarely used in isolation; its true power lies in timing entries within an established market context. Below are three professional “Strategy Cards” providing exact rulesets for trading ranges, pullbacks, and breakouts.
5.1. Strategy 1: Reversal Trading (Fading the Extreme)
This strategy capitalizes on the inevitable snapback from overextended market conditions.
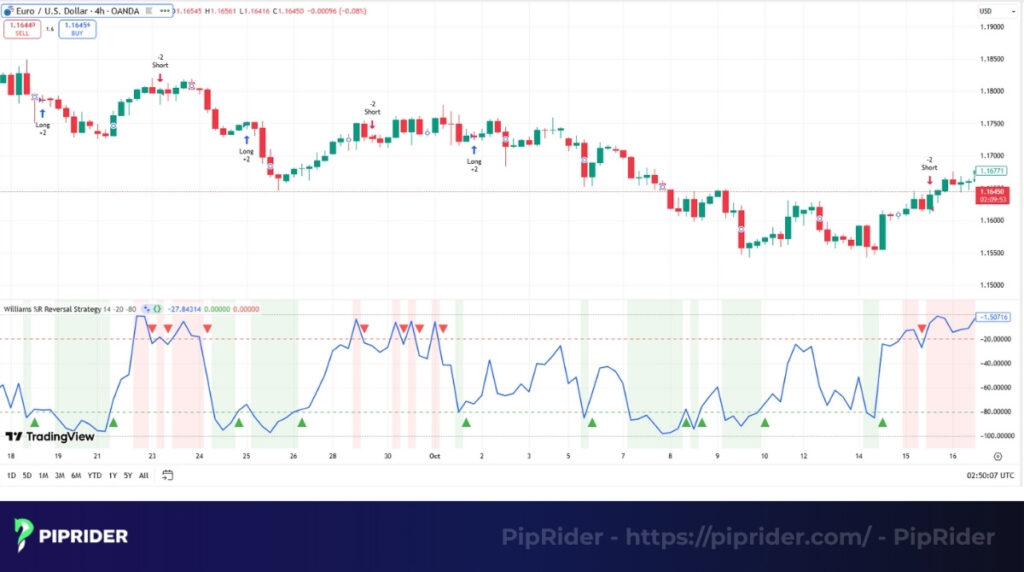
- Condition: The market must be range-bound (sideways) or the price must be testing a major, high-timeframe Support/Resistance level.
- Trigger (Entry):
- Long Setup: Wait for the %R to cross UP above −80 (exiting the oversold zone).
- Short Setup: Wait for the %R to cross DOWN below −20 (exiting the overbought zone).
- Stop Loss (SL): Placed strictly just beyond the most recent structural swing low (for longs) or swing high (for shorts). Never use “mental” or arbitrary pip-based stops.
- Take Profit (Exit):
- TP1: Take partial profits at the mid-range of the price structure (or when %R hits the −50 centerline).
- TP2: Close the remaining position when the %R reaches the opposite extreme zone, or trail your stop loss using a fast Moving Average (e.g., 10 EMA).
5.2. Strategy 2: Trend Confirmation (Trading the Pullback)
Because the %R is highly sensitive, pairing it with a trend filter (like a Moving Average) is the most reliable way to trade.
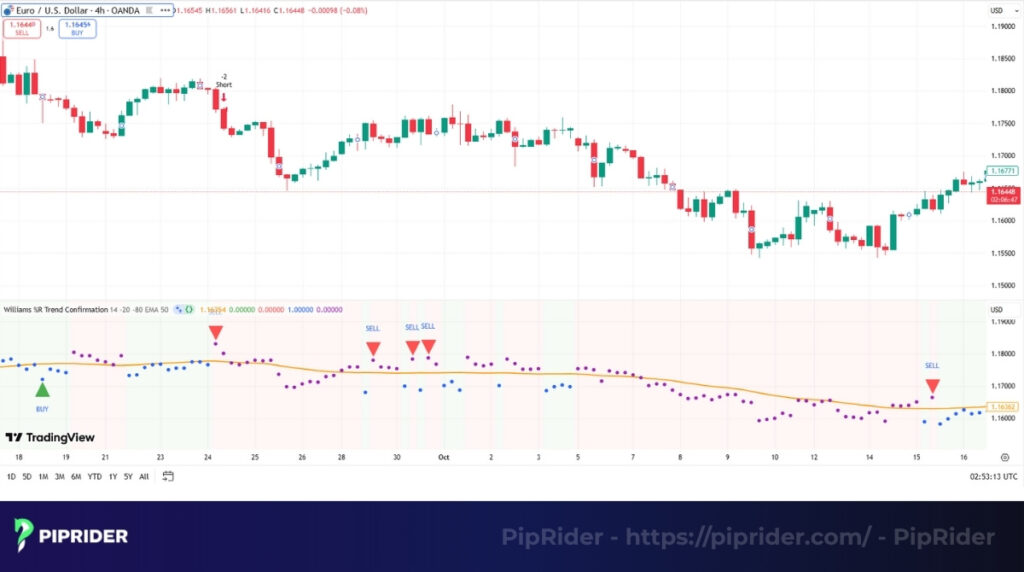
- Condition: An established trend confirmed by a medium-term Moving Average (e.g., 50-period EMA).
- If Price > 50 EMA: Look for Buy setups only.
- If Price < 50 EMA: Look for Sell setups only.
- Trigger (Entry):
- Long (Buy the Dip): In an uptrend, wait for the %R to drop into the oversold zone (−80 to −100). Execute a Long entry when the %R crosses UP above −80.
- Short (Sell the Rally): In a downtrend, wait for the %R to rally into the overbought zone (0 to −20). Execute a Short entry when the %R crosses DOWN below −20.
- Stop Loss (SL): Placed safely below the structural swing low of the pullback (for longs) or above the swing high (for shorts).
- Take Profit (Exit): Exit the trade if the price structure (Higher Highs / Lower Lows) is broken, or if the %R decisively loses the −50 centerline against your position, indicating the trend momentum has died.
5.3. Strategy 3: Breakout Filtering
The %R can validate whether a price breakout has the “fuel” (momentum) to sustain itself or if it’s a bull/bear trap.
- Condition: The price breaks a key technical Support or Resistance level or a chart pattern boundary.
- Trigger (Entry): Immediately following the price breakout, the %R must move aggressively from the −50 center zone toward the extreme zone that aligns with the breakout direction (e.g., surging toward 0 for a bullish breakout).
- Stop Loss (SL): Placed just below the breakout candle or the broken S/R level (which should now act as new support/resistance).
- Take Profit (Exit): Target the next major liquidity zone (S/R) or trail the stop loss as long as the %R remains “pinned” in the extreme zone.
- Fail Case (Invalidation): If the price breaks out but the %R gets “stuck” around the −50 line or quickly snaps back in the opposite direction, it signals a severe lack of underlying momentum. This is a high-probability False Breakout (Whipsaw) warning, abandon the trade setup immediately.
6. Using Williams %R with Other Indicators
The Williams %R is a fast, reactive tool, but its high sensitivity requires confirmation. Pairing it with other indicators helps filter whipsaws and validates the trade context.

- %R + RSI (Double Confirmation): Pairing the fast %R with the smoother Relative Strength Index (RSI) provides double confirmation of overbought/oversold extremes. Agreement between both oscillators significantly increases trade conviction.
- %R + MACD (Trend Validation): Use the Moving Average Convergence Divergence (MACD) to establish the prevailing market bias. Only validate buy signals from %R when the MACD is bullish and sell signals when the MACD is bearish, filtering signals that contradict the main trend.
- %R + Bollinger Bands (Breakout Filter): %R helps validate if a move hitting the Bollinger Bands is a legitimate breakout (confirmed by %R moving aggressively into an extreme zone) or just a short-term fade.
- %R + Volume/OBV (Reversal Strength): For Stock and Crypto traders, a reversal signal from %R is significantly stronger when supported by actual money flow. Look for a simultaneous uptick in the On-Balance Volume (OBV) to confirm institutional backing. (Note for Forex Traders: Since FX uses tick volume, pair %R with volatility expansion tools like ATR instead of OBV).
7. Williams %R vs. RSI – Which Is Better?
The Williams %R, the Relative Strength Index (RSI) originally developed by J. Welles Wilder (Wilder, 1978), and the True Strength Index (TSI) are all momentum oscillators, but they use different calculations and excel in different market environments. Deciding which is “better” depends entirely on your trading objective and the current market condition.
| Criteria | Williams %R | Relative Strength Index (RSI) |
|---|---|---|
| Range | Inverted: 0 to −100 | Standard: 0 to 100 |
| Calculation Focus | Compares close to the highest high (range position). | Compares magnitude of recent gains to losses. |
| Signal Speed | Faster and more reactive (sensitive). | Smoother and less volatile (better filtering). |
| Ideal Use | Timing short-term reversals and snapbacks. | Momentum trend analysis and trend validation. |
| Best Market | Range-bound or highly volatile markets. | Trending markets (uptrends/downtrends). |
Analysis: When to Use Which?
The key distinction lies in their calculation and resulting speed:
- Use %R when: You are a scalper or short-term swing trader focused on catching rapid, short-lived movements or price reversals at the extremes of a defined range. Its speed makes it a superior timing indicator.
- Use RSI when: You are a swing trader or position trader focused on trend continuation and need a smoother indicator to avoid whipsaws. RSI excels at measuring the sustained magnitude of momentum, making it better for trend validation.
In short: Williams %R is better for timing extremes, while RSI is better for validating the strength of a trend.
8. Backtesting the Williams %R Strategy
Quantifying a trading strategy using backtesting is essential to validate its edge and improve risk-adjusted returns before risking real capital. Backtesting is necessary to ensure a Williams %R strategy offers a reliable, statistical advantage on a specific asset or timeframe.
| Criterion | Suggested Setup (Example) |
|---|---|
| Entry Rule (Buy) | %R crosses up above −80, and the price is above the 50-period EMA. |
| Exit Rule (Take Profit) | %R hits −20 (overbought) or the price crosses below a fast Moving Average (e.g., 10 EMA). |
| Risk Management | Stop-loss set at the lowest low recorded during the oversold period. |
The goal is to verify key metrics like win rate, profit factor, and maximum drawdown to validate the strategy’s profitability over a large sample size.
9. Example Scans and Code Implementation
Translating the Williams %R strategy into actionable code for scanners and trading platforms is essential for systematic trading. By automating the indicator, you can filter thousands of assets and only receive alerts when a high-probability reversal setup occurs.
These conditions focus on the core reversal strategy: exiting the extreme zones.
- Buy Setup (Long Alert): The %R crosses UP above −80. This confirms that selling pressure has been exhausted, and upward momentum is taking over.
- Sell Setup (Short Alert): The %R crosses DOWN below −20. This confirms that buying pressure is depleted, and downward momentum is taking over.
TradingView Pine Script (v5) Example
Below is the standard, optimized code snippet using the latest Pine Script v5 built-in functions. You can paste this directly into your TradingView Pine Editor to create custom alerts or screeners.
Pine Script
//@version=5

indicator("Williams %R Reversal Alerts", overlay=false)


// 1. Define the look-back period and calculate %R

length = input.int(14, title="Look-back Period")

wR = ta.williamsr(length)


// 2. Define the exact trigger logic (Exiting the extremes)

buy_alert  = ta.crossover(wR, -80)  // %R crosses UP above -80

sell_alert = ta.crossunder(wR, -20) // %R crosses DOWN below -20


// 3. Plotting the indicator and trigger signals

plot(wR, title="Williams %R", color=color.blue, linewidth=2)

hline(-20, title="Overbought", color=color.red, linestyle=hline.style_dashed)

hline(-80, title="Oversold", color=color.green, linestyle=hline.style_dashed)


// Optional: Display shapes on the chart when signals trigger

plotshape(series=buy_alert, title="Buy Signal", style=shape.triangleup, location=location.bottom, color=color.green, size=size.small)

plotshape(series=sell_alert, title="Sell Signal", style=shape.triangledown, location=location.top, color=color.red, size=size.small)
Technical Reference:For deeper integration and a full list of mathematical parameters, refer to the official TradingView Williams %R Indicator Documentation (TradingView, n.d.).
10. Best Market Conditions for Williams %R
The Williams %R is a timing tool best utilized in specific market environments where its sensitivity is an advantage.
- Optimal conditions: Williams %R is most effective in range-bound (sideways) markets and for identifying short-term pullbacks within a trend. In these environments, the indicator consistently cycles between −20 and −80, generating reliable reversal signals when the price is due for a snapback.
- Suboptimal conditions: The indicator’s effectiveness decreases sharply during strong, sustained trends. Since the price keeps closing near its high or low, the %R will remain stuck in the 0 to −20 or −80 to −100 zones. This common occurrence leads to frequent false reversal signals (whipsaws).
- Optimized settings by asset: Adjusting the look-back period (N) maximizes performance based on an asset’s typical price fluctuations:
| Asset Class | Recommended Period (N) | Rationale |
|---|---|---|
| Forex / Crypto | 9 to 12 Periods | Shorter period for higher sensitivity to fast, sharp reversals common in volatile markets. |
| Stocks (Swing Trading) | 14 Periods | Standard setting for balanced signal reliability on daily charts. |
| Long-Term/Position | 21 to 28 Periods | Longer period filters minor noise, focusing on significant momentum shifts. |
11. Advantages and Limitations
The Williams %R is a popular and effective momentum tool due to its speed, but its inherent sensitivity creates certain drawbacks that traders must manage.
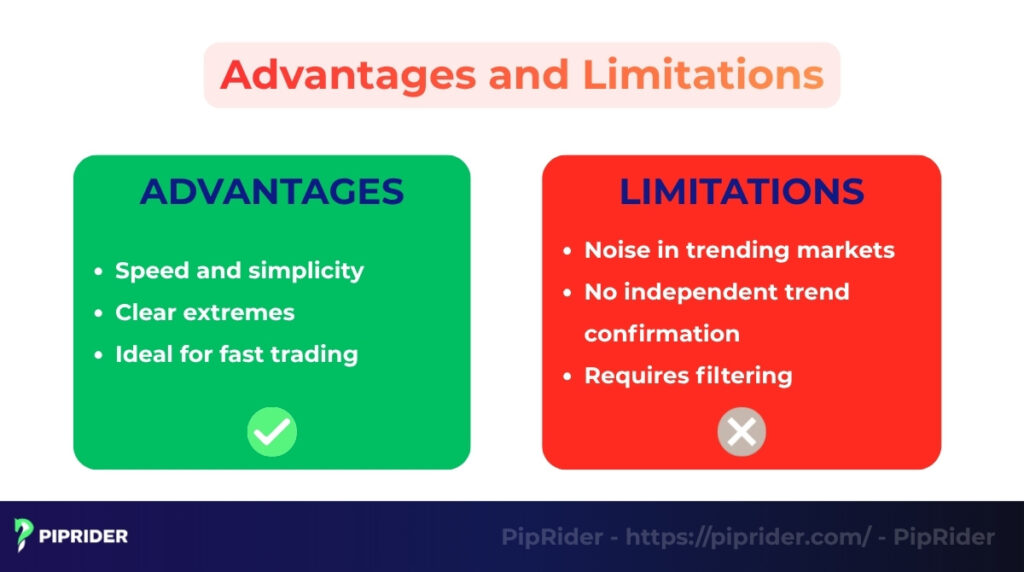
11.1. Advantages
The Williams %R offers significant benefits, particularly for short-term trading.
- Speed and simplicity: It is highly sensitive and quick to generate signals, making it an excellent timing indicator. The core concept, measuring the close against the recent price range, is straightforward.
- Clear extremes: The scale clearly defines overbought (0 to −20) and oversold (−80 to −100) levels, allowing traders to easily spot potential short-term reversal points.
- Ideal for fast trading: Its responsiveness makes it a favorite tool for scalpers and swing traders looking to capitalize on quick price snapbacks.
11.2. Limitations
The high sensitivity of Williams %R is also the source of its main drawbacks.
- Noise in trending markets: Its primary weakness is producing false reversal signals (whipsaws) during strong, sustained trends. The %R often sticks in an extreme zone, incorrectly suggesting a reversal.
- No independent trend confirmation: As a momentum oscillator, the Williams %R cannot independently confirm the long-term trend direction or strength; it only measures range position.
- Requires filtering: Due to its high noise, it must be combined with other technical tools (like Moving Averages or MACD) to filter out unreliable signals and provide necessary market context.
12. Frequently asked questions about Williams %R Indicator
13. Conclusion
The Williams %R is an essential tool for identifying short-term momentum and timing potential reversals. Its key function is the rapid identification of price extremes, signaling that momentum is likely exhausted. However, its high sensitivity is a flaw; the %R must never be used in isolation.
Always treat the Williams %R as a confirmation indicator. To maximize accuracy, pair it with a Moving Average (MA) as a trend filter to ensure signals align with the dominant market direction. Combine it with the RSI for momentum confirmation, which provides a higher-conviction signal on market extremes.
For more advanced trading strategies and broker insights, be sure to follow Piprider and explore our dedicated technical indicators list section.
Infographic Section
-
Williams %R Indicator Momentum -
Williams %R Settings Optimization -
Williams %R Indicator Trading Strategy