
The Dead Cat Bounce Pattern is one of the most deceptive traps in a bear market. Many investors mistake this temporary recovery for a trend reversal, only to suffer heavy losses when the price crashes again. This guide explains how to distinguish a fake rally from a real bottom, confirm the continuation with volume, and execute high-probability short trades without getting trapped.
Key Takeaways
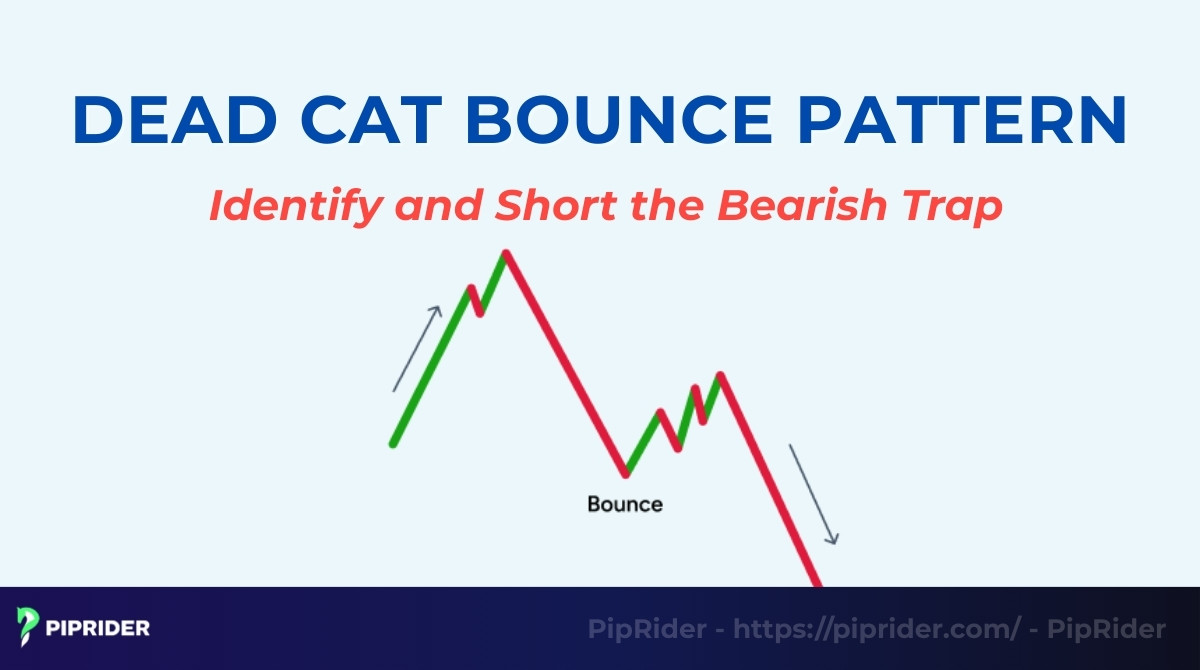
- The Dead Cat Bounce is a bearish continuation pattern that typically appears after a sharp market crash.
- The price bounces slightly due to technical factors, but it fails to break key resistance levels.
- Trading volume often decreases during the recovery, signaling a lack of genuine buying interest (a bull trap).
- A break below the bounce low confirms the pattern and triggers a strong short-selling opportunity.
- Inexperienced traders often mistake this pattern for a market bottom, leading to “FOMO” buying before the next drop.
1. What Is a Dead Cat Bounce Pattern?
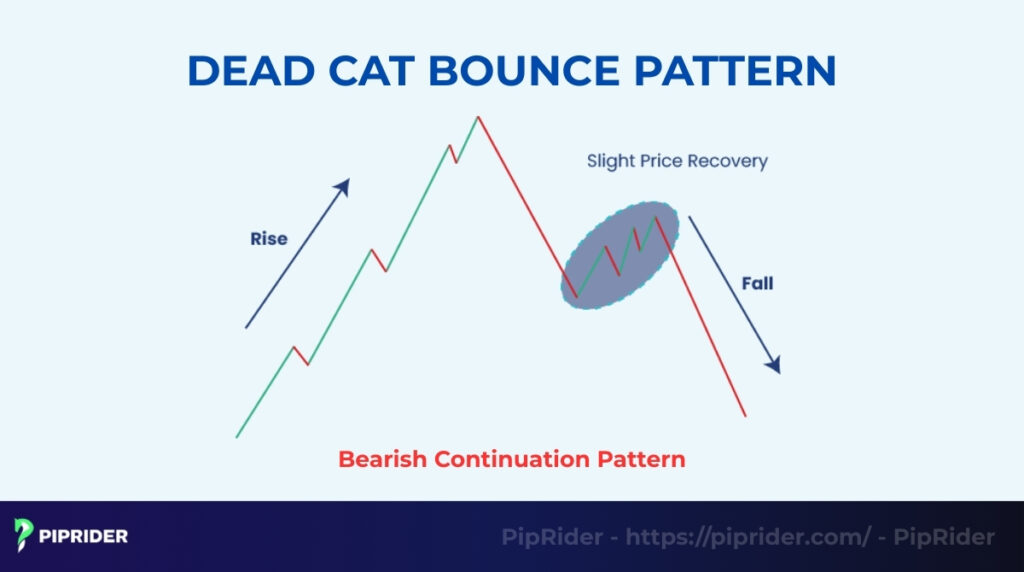
The Dead Cat Bounce is a temporary price recovery that happens during a severe downtrend. In technical analysis, it is strictly classified as a bearish continuation pattern, meaning the rally is a “fakeout” driven by speculation rather than genuine value, followed inevitably by a resumption of the crash.
According to Investopedia, the term derives from the macabre Wall Street saying: “Even a dead cat will bounce if it falls from a great height” (Chen, 2025). This serves as a warning: a rising price doesn’t always mean the asset is recovering; it may just be a technical reaction before the next drop.
1.1. Why It’s Not a Bullish Reversal
Traders often confuse a Dead Cat Bounce with a “V-shaped” market reversal, but the underlying mechanics are opposite.
- Volume: A true reversal requires expanding volume to prove buyer conviction. A Dead Cat Bounce usually occurs on low or declining volume, indicating weak buying interest from smart investors.
- Resistance: A reversal breaks through resistance levels. A Dead Cat Bounce typically stalls and fails at the first major resistance zone (like a moving average or Fibonacci level) before rolling over.
1.2. The Bull Trap Concept Behind the Pattern
The pattern’s primary danger lies in its ability to function as a bull trap.
- The Lure: The sudden halt in selling attracts “bottom fishers” and retail traders who believe the asset is now cheap (oversold).
- The Trap: Institutional sellers use this temporary liquidity to enter new short positions at better prices. When the price eventually breaks below the bounce low, the new buyers are trapped in losing positions, fueling the next leg of the crash.
2. How Does the Dead Cat Bounce Pattern Form?
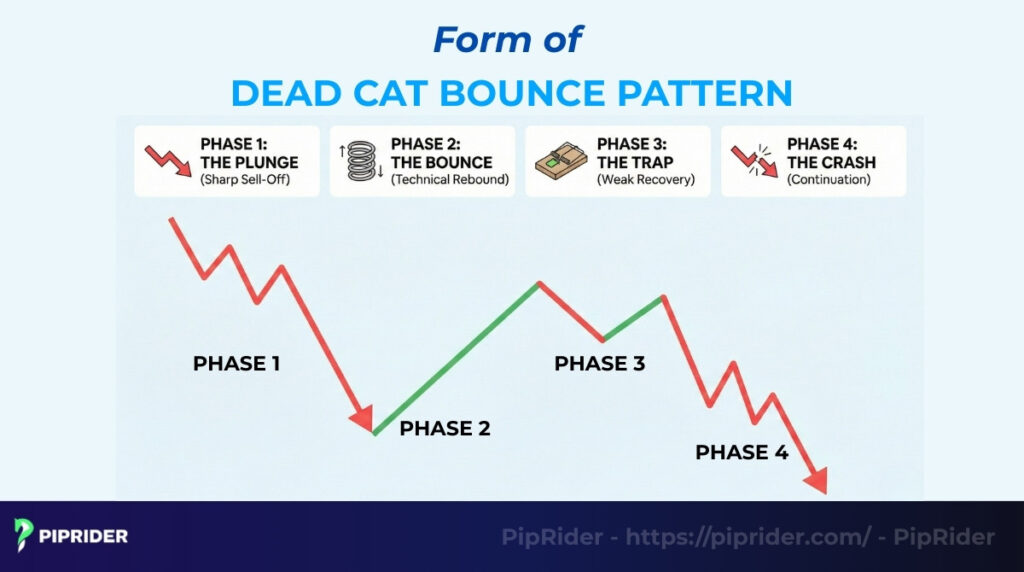
The pattern unfolds in a predictable four-step cycle. Understanding this sequence helps you identify exactly where you are in the trap before it snaps shut.
- Phase 1: The Plunge (Sharp Sell-Off): The pattern begins with a violent, aggressive decline, typically plummeting from a local market peak. Visually, this looks like a steep, almost vertical price drop where the RSI plunges deep into oversold territory (below 30), driven by panic selling.
- Phase 2: The Bounce (Technical Rebound): Just when the asset looks dead, price spikes up. This is not new buying interest; it is primarily “short covering.” Traders who shorted at the top are buying back shares to lock in profits, mechanically pushing the price up.
- Phase 3: The Trap (Weak Recovery): Price drifts higher, but momentum is sluggish. Crucially, volume decreases significantly during this rise. Institutional money is absent; only retail “bottom fishers” are entering, hoping for a reversal that isn’t there.
- Phase 4: The Crash (Continuation): The trap snaps shut. As the price fails to break resistance, the new buyers panic and sell. This fresh wave of supply drives the price below the initial low, resuming the dominant downtrend.
3. What Is the Market Psychology Behind a Dead Cat Bounce?
The Dead Cat Bounce is a psychological battleground where retail hope collides with institutional strategy. It is fueled by two primary forces: desperation and profit-taking.
3.1. The Retail Trap: Anchoring Bias
Inexperienced traders fall victim to “Anchoring Bias,” fixating on recent high prices and perceiving the crash as a “bargain.” Driven by the fear of missing out (FOMO) and desperation, they mistake the technical rebound for a V-shaped recovery. Their emotional buying provides the initial fuel for the bounce.
3.2. The Technical Trigger: Short Covering
The rally is rarely fundamental. It is triggered by a short squeeze. Traders who shorted at the top buy back shares to lock in massive profits. This mechanical buying pressure pushes the price up artificially, creating a mirage of strength.
3.3. The Institutional Setup: Sell the Rip
“Smart Money” uses the bounce as a liquidity event. Institutions view the rally as a second chance to exit losing positions or open new short positions at better prices. Once this selling pressure absorbs the retail buying, the support collapses, and the downtrend resumes.
4. Key Characteristics of a Valid Dead Cat Bounce
Not every price rise is a trap. To confirm a valid Dead Cat Bounce pattern and avoid shorting a real reversal, the setup must satisfy these four strict technical criteria.
- Appears after a strong downtrend: Context is king. The pattern only applies after a steep, significant decline (often a drop of 20% or more). If the market is sideways or uptrending, this pattern is invalid.
- Weak and low-volume rally: This is the most telling sign. While the upward price movement occurs, trading volume should dry up. This divergence signals that the rally is “hollow” and lacks institutional backing.
- Bounce fails at key resistance: The recovery is short-lived because it hits a “ceiling.” The price typically stalls perfectly at a dynamic resistance level (like the 20-day EMA) or a Fibonacci Retracement level (usually the 38.2% or 50% level).
- Breakdown confirms the pattern: The pattern is not complete until the trap snaps shut. A valid setup requires the price to break below the lowest point of the bounce. This lower low confirms the downtrend has resumed.
5. Dead Cat Bounce vs. Similar Patterns: How to Avoid Confusion
Mistaking a Dead Cat Bounce for a reversal is a costly error. Use this comparison guide to distinguish a trap from a genuine opportunity.
| Pattern | Key Difference (The “Tell”) | Direction Bias |
| Dead Cat Bounce | Low volume recovery, fails at resistance. | Bearish (Continuation) |
| Bear Market Rally | Lasts longer (weeks/months), fundamentally driven. | Bearish (Long-term) |
| Double Bottom | Respects the previous low (“W” shape). | Bullish (Reversal) |
| V-Shaped Recovery | Massive volume spike, breaks resistance instantly. | Bullish (Reversal) |
5.1. Dead Cat Bounce vs. Bear Market Rally
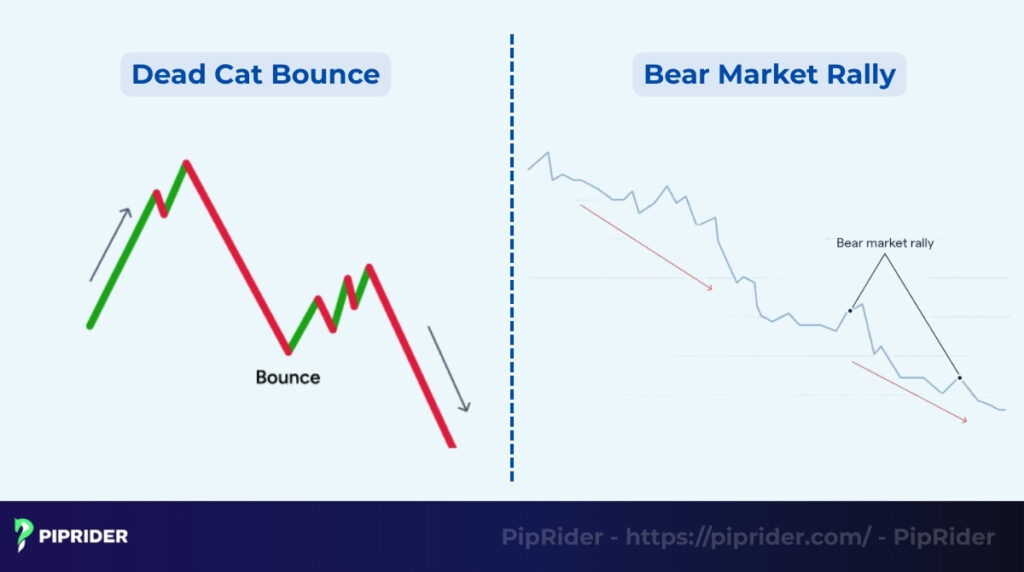
While both are temporary recoveries in a downtrend, they differ significantly in duration and scale. A Dead Cat Bounce pattern is a sharp, short-lived technical reaction (days to weeks) driven by short-covering. In contrast, a Bear Market Rally can last for months and retrace significant ground (e.g., 20%). This movement often tricks investors into believing a new bull market has begun before the primary downtrend resumes.
5.2. Dead Cat Bounce vs. Double Bottom
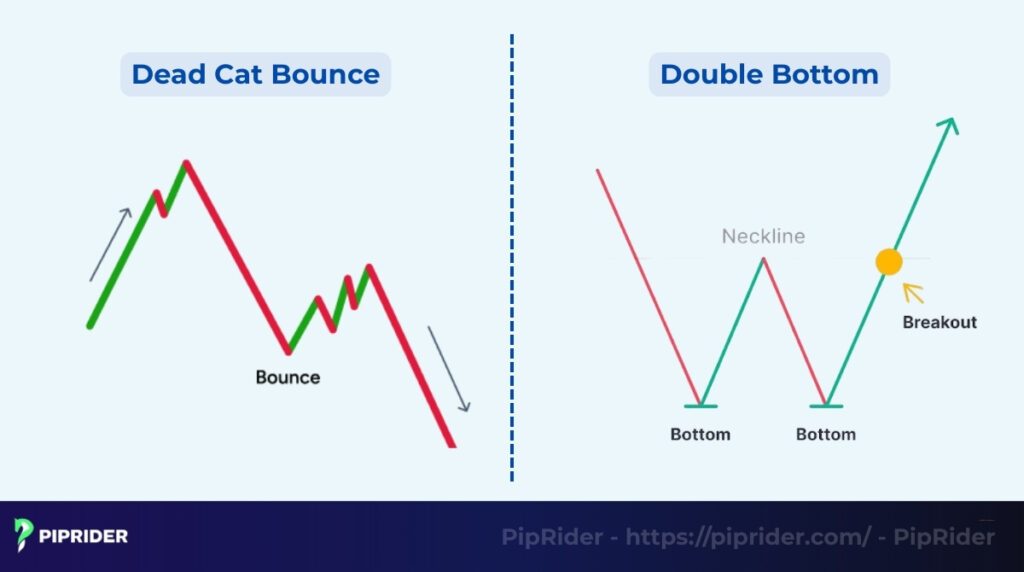
This distinction is critical because one is a sell signal, and the other is a buy signal. The key lies in the support level.
- Dead Cat Bounce: The price rallies briefly but fails to hold support, eventually breaking below the initial low.
- Double Bottom: The price returns to the initial low, finds strong support, and bounces up again to form a “W” shape. If the support holds, it’s a Double Bottom; if it breaks, it’s a Dead Cat.
5.3. Dead Cat Bounce vs. V-Shaped Recovery
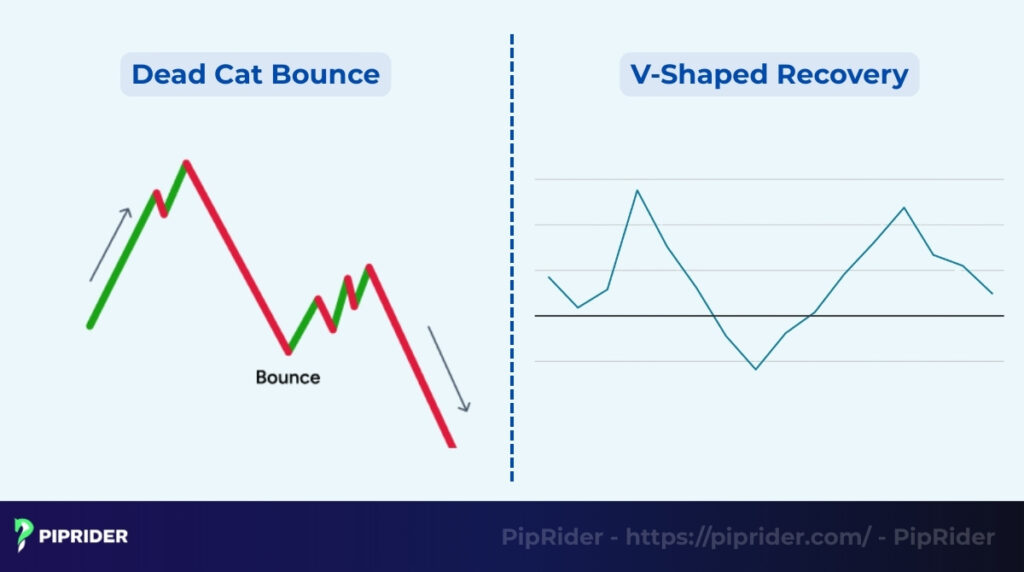
Volume is your best filter here. A V-Shaped Recovery is characterized by explosive volume and aggressive buying that smashes through resistance levels without looking back. A Dead Cat Bounce, however, rises on declining or low volume, signaling a lack of conviction that eventually leads to failure.
5.4. Dead Cat Bounce vs. Corrective Wave (Elliott Wave)
For advanced traders, context is key. A Dead Cat Bounce typically corresponds to Wave B (in an A-B-C correction) or a small corrective wave within a larger impulsive downtrend. After the bounce completes, the price must drop in Wave C, which is often the most devastating leg of the decline.
6. How Should You Trade the Dead Cat Bounce Pattern?
Trading a Dead Cat Bounce is about timing the continuation of the crash. Since this is a bearish pattern, the primary trading strategy is short selling. Never buy this pattern.
6.1. Strategy 1: The Breakdown Short (Standard)
Widely considered the gold standard, entering on the breakdown confirms that the downtrend has officially resumed.
- The Trigger: Enter a short position immediately when the price breaks below the lowest point of the initial sell-off (Phase 1 low).
- Why: A lower low confirms that the “dead cat” has stopped bouncing and gravity is taking over again.
6.2. Strategy 2: The Retest Short (Conservative)
Waiting for a retest significantly reduces the risk of a “bear trap” (false breakdown).
- The Trigger: Wait for the breakdown, then let the price rally back up to retest the broken support levels. Enter short when the price rejects this level (Support turns into Resistance).
- The Trade-off: You get a safer entry price, but you risk missing the trade if the market crashes violently without looking back.
6.3. Strategy 3: Fading the Bounce (Aggressive)
Aggressive traders use this advanced technique to catch the exact top of the recovery before the drop occurs.
- The Trigger: Enter short when the recovery rally stalls at a key technical level, such as the 38.2% or 50% Fibonacci Retracement or the 20-day Moving Average.
- Confirmation: Look for bearish candlestick patterns (like a Shooting Star or Bearish Engulfing) at these resistance levels to confirm the top is in.
6.4. Stop Loss Placement (Protecting Capital)
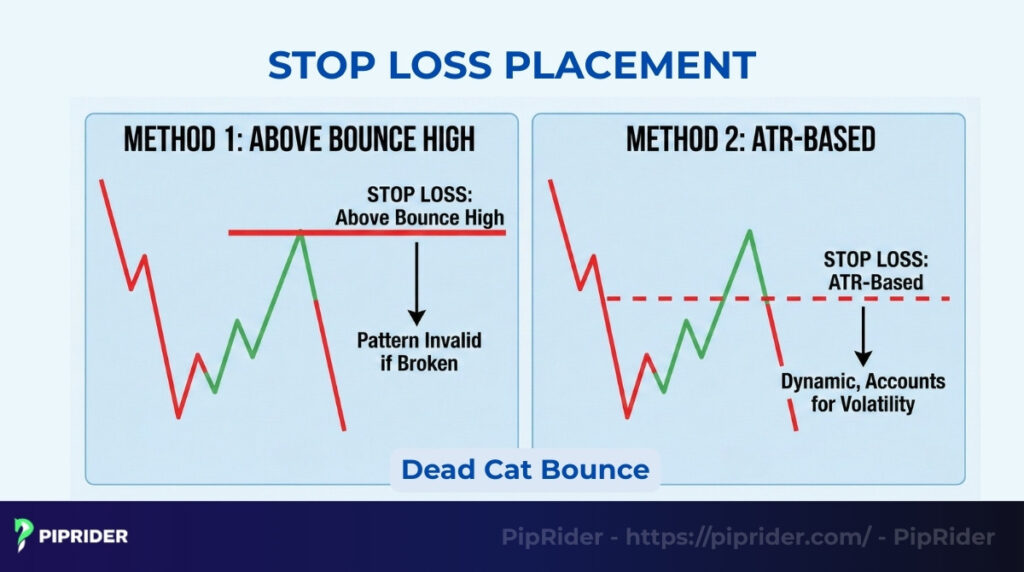
Shorting has unlimited risk if not managed. A precise stop loss is non-negotiable.
- Above Bounce High: Place the SL just above the highest peak of the recovery rally. If the price breaks this high, the pattern is invalid.
- ATR-Based: Use the Average True Range (ATR) indicator to set a dynamic stop loss that accounts for market volatility, preventing you from being stopped out by random noise.
6.5. Take Profit Strategy
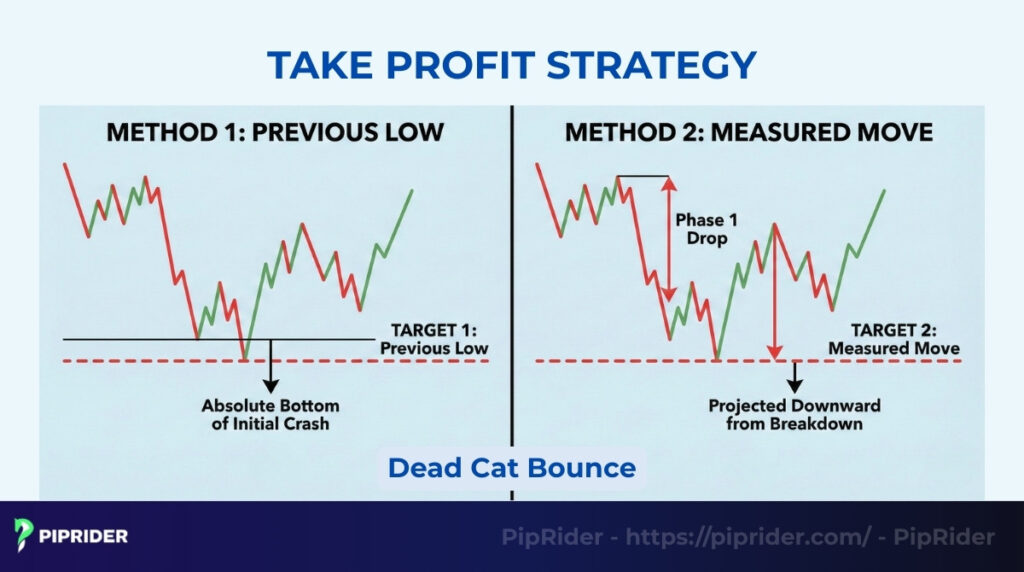
Set realistic targets based on the chart structure, not greed.
- Target 1 (Previous Low): The absolute bottom of the initial crash.
- Target 2 (Measured Move): Calculate the distance of the initial drop (Phase 1). Project that distance downward from the breakdown point to find the ultimate target.
7. Which Indicators Best Improve Dead Cat Bounce Accuracy?
Summary: Price action tells you what is happening, but indicators reveal why. Use this checklist to distinguish a hollow “dead cat” rally from a genuine market reversal.
| Indicator | The Signal to Look For | What It Means |
| Volume | Decreasing as price rises | Lack of institutional buying (Fakeout). |
| RSI | Rebounds to 40-50 (No Divergence) | Momentum is just resetting, not reversing. |
| MACD | Histogram stays weak/flat | Bulls lack the power to sustain the move. |
| EMA | Rejection at 20 or 50 EMA | Dynamic resistance is still dominant. |
- Volume Decline (The Lie Detector): This is your primary filter. During the bounce, trading volume should dry up or remain significantly below average. A price rally on low volume proves that “Smart Money” is not participating; it is merely a lack of selling pressure, not an influx of demand.
- RSI Bearish Reset: In a true reversal, the RSI often shows “Bullish Divergence” (Price Lower Low, RSI Higher Low). In a Dead Cat Bounce pattern, this divergence is usually absent. The RSI simply rises from oversold (<30) back to neutral territory (40–50) to relieve pressure before the next crash.
- MACD Weakness: Watch the momentum. Even if the price is rising, the MACD Histogram bars should remain small or struggle to flip positive. A “lazy” or flat bullish crossover indicates that the buyers are too weak to change the trend structure.
- EMA Dynamic Resistance: Plot the 20-period and 50-period EMAs. These lines act as a “no-fly zone.” The dead cat bounce typically rallies exactly to touch these lines and stalls. A bearish candlestick (like a Shooting Star) rejecting the EMA is the perfect trigger to enter a short.
8. Real Chart Examples: Seeing the Trap in Action
The Dead Cat Bounce is a chameleon; its appearance shifts depending on the market’s liquidity and volatility. Recognizing these asset-specific nuances is crucial to avoid getting trapped in a fake rally.
8.1. Forex Example (GBP/JPY – “The Widow Maker”)
Currency pairs like GBP/JPY are famous for volatility and sharp technical reactions. A Dead Cat Bounce pattern here is often triggered by a sudden shift in global risk sentiment.
- The Setup: A breakdown of a major weekly support level (e.g., 150.00) triggered by negative economic data.
- The Bounce: Price rallies aggressively back up to “kiss” the 150.00 level from underneath. Retail traders see this 100-pip rally and buy, thinking the support held.
- The Reality: The 150.00 level has flipped from Support to Resistance. The bounce fails exactly at this level, forming a long upper wick (rejection), before crashing another 300 pips.
8.2. Crypto Example (Bitcoin / Altcoins)
Crypto markets are emotionally charged, creating the most violent Dead Cat Bounces. The rallies are often steep (20-40%), convincing holders that the “Bear Market is over.”
- The Setup: Bitcoin crashes 30% in a week due to regulatory news. RSI hits 20 (Extreme Oversold).
- The Bounce: Price explodes upward, recovering half of the loss in two days. Social media sentiment flips to “Buy the Dip.”
- The Trap: Volume on the rally is declining. The price stalls at the 0.5 Fibonacci retracement of the crash. Whales unload their bags into this retail liquidity, driving the price to new yearly lows.
8.3. Stock Example (Tech Crash / Earnings Miss)
In the stock market, Dead Cat Bounces are frequently associated with “Gap Downs” following bad earnings reports or economic crises (like the Dot-com bubble or 2008 crash).
- The Setup: A high-flying tech stock misses earnings estimates and gaps down 15% at the open.
- The Bounce: For the next 3 days, the stock rallies to “fill the gap.” Investors think the market overreacted and rush to buy the discount.
- The Outcome: The gap acts as a brick wall of resistance. Once the gap is filled, the selling pressure resumes, pushing the stock into a multi-month downtrend.
9. What Are Common Mistakes Traders Make?
Even with a perfect setup, human error can ruin the trade. Avoid these traps to protect your capital.
- Buying too early (FOMO): Jumping in at the first sign of a bounce is the most common mistake. Remember, the initial rally is usually just a temporary “Short Squeeze,” not a reversal. Buying early often means buying at the top of a minor correction before the crash resumes.
- Confusing it with a real bottom: Assuming a “V-shaped” recovery without confirmation is dangerous. A real bottom requires a Higher Low or a Double Bottom structure. A Dead Cat Bounce makes a lower high and then breaks down.
- Ignoring market context & volume: Never bet against a strong bearish trend (like a crypto bear market) without overwhelming evidence. If the bounce happens on low volume, it lacks institutional backing and is highly likely to fail.
- Over-reliance on indicators: Shorting solely because RSI is “overbought” is risky in a strong downtrend. Indicators lag; always wait for a specific bearish candlestick pattern (Price Action) to confirm that momentum has actually shifted before entering.
10. Which Scanners and Tools Can Automatically Detect the Pattern?
Finding a Dead Cat Bounce pattern requires identifying assets that are severely oversold but hitting resistance. Use these specific settings to filter the market for high-probability candidates.
- TradingView Screener (Crypto & Forex): Filter for assets with RSI (14) below 30 (Oversold) and Weekly Performance below -15% (The Crash). This instantly lists crashed assets ripe for a potential trap.
- FinViz Stock Screener: Go to the “Technical” tab. Set 20-Day SMA to “Price below SMA20” and Pattern to “Channel Down”. Look for stocks rallying to touch the upper channel line (Resistance).
- MT4/MT5 Indicators: Use “Supply and Demand” zone plugins to identify “Drop-Base-Drop” zones. Set alerts when price rallies back up into a red Supply Zone on the H4 chart.
- AI Pattern Tools (LuxAlgo): Enable the Smart Money Concepts overlay. Look for a Bearish Order Block appearing above the current price. The bounce will likely target this block before crashing.
11. Frequently asked questions about Dead Cat Bounce Pattern
Quick answers to the most common questions traders ask to avoid getting trapped by this pattern.
12. Conclusion
The Dead Cat Bounce pattern is a treacherous bearish continuation pattern designed to trap emotional traders in a fake recovery. It is not a buying opportunity; it is a warning sign that the dominant downtrend is pausing before resuming with renewed intensity.
To survive, never trust price alone. Always confirm the bounce’s weakness through declining volume and rejection at key resistance levels. By waiting for the breakdown, you can turn a potential trap into a high-probability shorting opportunity.
Ready to master market traps?Don’t trade blindly. Follow Piprider today for professional technical analysis and strategies to stay ahead of the next crash.


