

Are you searching for a responsive oscillator to help pinpoint trend fatigue but find the RSI can be overly erratic at times? The DeMarker indicator (DeM), a powerful yet often underutilized tool, offers a compelling solution. This indicator presents a distinct view of market dynamics and serves as a fantastic alternative or companion to the RSI.
This manual will be your complete guide to the DeM. We’ll dive into its unique calculation, explain how to interpret its signals, and provide three actionable strategies for applying it effectively in the Forex market.
Key Takeaways
- The DeMarker is a tool that measures market pressure to forecast trend reversals.
- Its signal is often smoother than the RSI, helping to filter out market noise.
- The 0.3 and 0.7 thresholds help identify potential oversold/overbought zones.
- One of the most powerful signals is divergence between the DeM and price.
- As a leading indicator, DeM’s signals should always be confirmed by other tools.
1. What is the DeMarker indicator?
The DeMarker indicator is a technical tool from the oscillator family, and its central purpose is to gauge the underlying demand for an asset. It uses this information to evaluate the current trend’s vitality and, more importantly, to identify when that trend is likely losing drive. This makes it a crucial component of technical analysis.
The DeM indicator was invented by Thomas DeMark, a highly influential figure in technical analysis (Investopedia, n.d.). DeMarker is a market visionary celebrated for creating a suite of advanced trading tools (like the TD Sequential) employed by major hedge funds and financial institutions.
The DeMarker indicator relies on these core components to measure market pressure and generate signals:
- DeM-High (Demax): Measures upward pressure by calculating the difference between the current high and the previous high. If the result is negative or zero, this value is reset to zero.
- DeM-Low (Demin): Measures downward pressure by calculating the difference between the previous low and the current low. If the result is negative or zero, this value is reset to zero.
- The lookback period: This is the ‘N’ value, which determines the number of periods used to smooth the DeMax and DeMin values. A common setting is 14.
- The final DeM value: The final indicator is calculated by dividing the smoothed DeMax by the sum of the smoothed DeMax and DeMin. This produces a single line that oscillates between 0 and 1 (or 0 and 100).
- Overbought and Oversold levels: The indicator’s primary function is to identify these levels, which are typically set at 0.7 and 0.3 and signal potential reversals.
2. Why choose DeMarker? 3 key advantages in Forex trading
The DeMarker is a reliable tool for identifying high-probability setups when used correctly. Its primary advantage is that its smoother line can help filter out market noise, making its divergence signals often clearer and less frequent than those from more sensitive oscillators like the Stochastic.
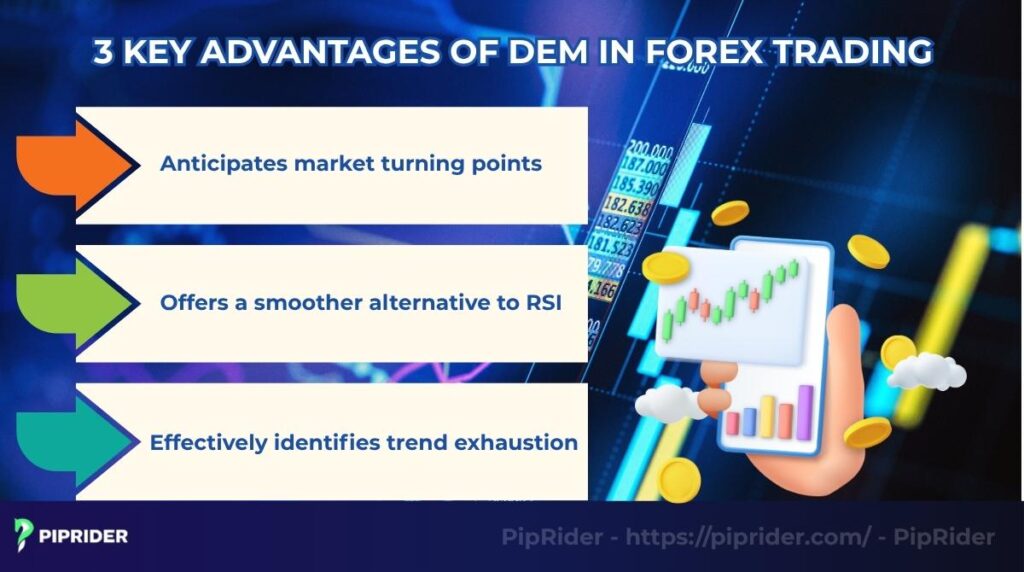
2.1. Anticipates market turning points
The DeM is a leading indicator, which means its signals often emerge before a price reversal becomes obvious (Quantified Strategies, 2025). This provides traders with a valuable early warning that a trend might be preparing to change course, allowing them to plan an exit or a counter-trend setup. This also aids in understanding price trends.
2.2. Offers a smoother alternative to RSI
A major source of frustration with the RSI is its tendency to produce “spiky” or “choppy” movements, which can lead to false signals. Due to its unique formula, the DeM line is often noticeably smoother. This can help screen out minor, irrelevant price jitters, enabling you to concentrate on the more significant shifts in strength.
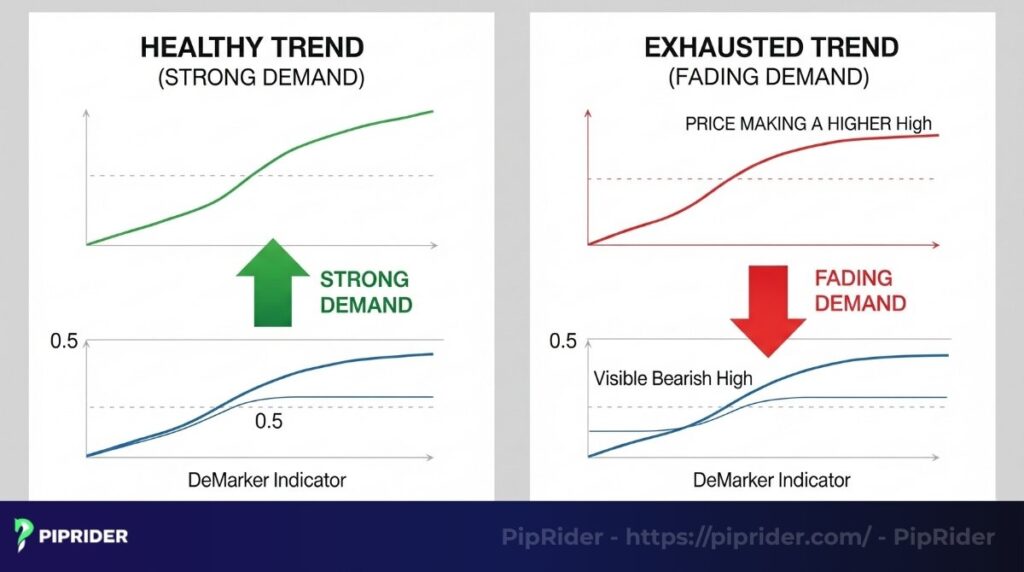
2.3. Effectively identifies trend exhaustion
The DeM indicator truly excels at identifying trend exhaustion. By measuring the underlying “demand” behind a price move, the indicator detects when a strong trend is losing internal power. This loss of momentum can become visible even as the price continues to inch higher.
Such a divergence between price action and the indicator is a textbook illustration of a weakening trend and a clear signal of price exhaustion.
3. Formula of the DeMarker indicator
You don’t need to perform the math, as your platform handles it. However, grasping the basic logic of the formula will give you a much richer understanding of what its signals represent. This understanding is often derived from empirical research in market behavior.
Step 1: Calculating DeMax and DeMin
The indicator first assesses two conditions for each period:
Calculating DeMax (Buyer Strength) If Current High > Previous High, then
DeMax = Current High – Previous High Otherwise, DeMax = 0
Calculating DeMin (Seller Strength) If Current Low < Previous Low, then
DeMin = Previous Low – Current LowOtherwise, DeMin = 0
Step 2: Calculating the Moving Averages
The indicator then computes a Simple Moving Average (SMA) of both the DeMax and DeMin values over a chosen period (typically 14).
Step 3: The final DeMarker formula
The final oscillator is created with this equation:
DeM = SMA of DeMax / (SMA of DeMax + SMA of DeMin)
The result is a value between 0 and 1, which many platforms then scale to a 0-100 range for easier interpretation.
4. How to read the DeM Indicator on a Forex chart
Interpreting the DeM involves observing its position relative to three key levels. These levels serve as benchmarks for assessing strength and flagging potential trade opportunities, providing insights into trend direction.
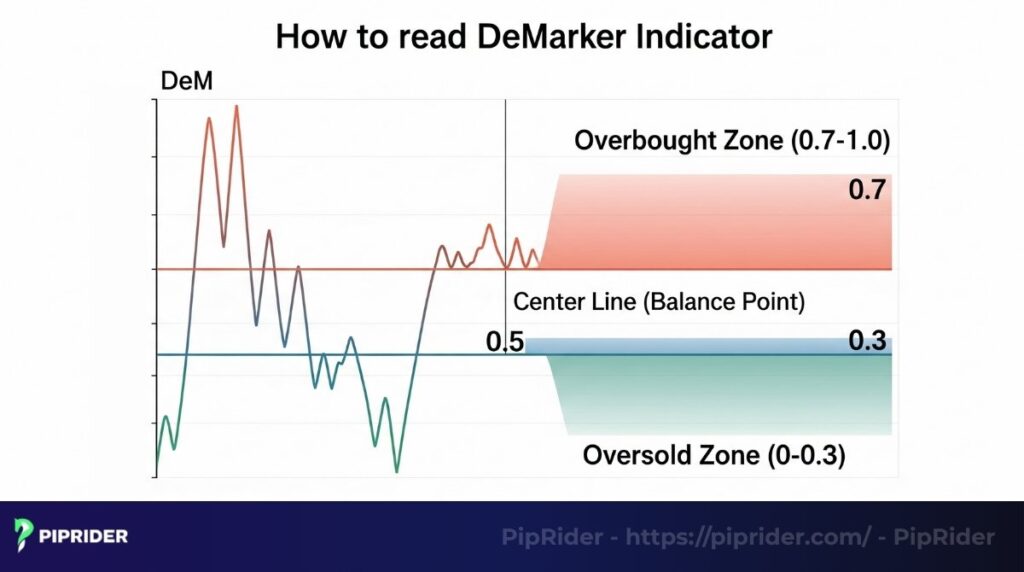
The key levels:
- The 0.7 level: When the DeM line moves above the 0.7 mark, it suggests the market may be overextended to the upside (Admiral Markets, n.d.). This is a cautionary sign that the uptrend could be due for a consolidation or reversal.
- The 0.3 level: A dip below this mark suggests that the asset might be entering an undervalued state. This alerts a trader that selling strength could be waning, and a potential upward turn might be near.
- The 0.5 level (center line): This level represents the balance point between bullish and bearish forces. A cross above 0.5 indicates bullish momentum is gaining the upper hand for that period, while a cross below suggests bearish momentum is taking charge.
Read more:
Using Williams %R Indicator with Other Indicators
Practical Applications Of The True Strength Index TSI
5. Practical trading strategies with the DeMarker indicator in Forex
Now for practical application. Here are three powerful and field-tested strategies for integrating the DeMarker indicator into your trading decisions within the Forex market. Each outlines a viable trading strategy.
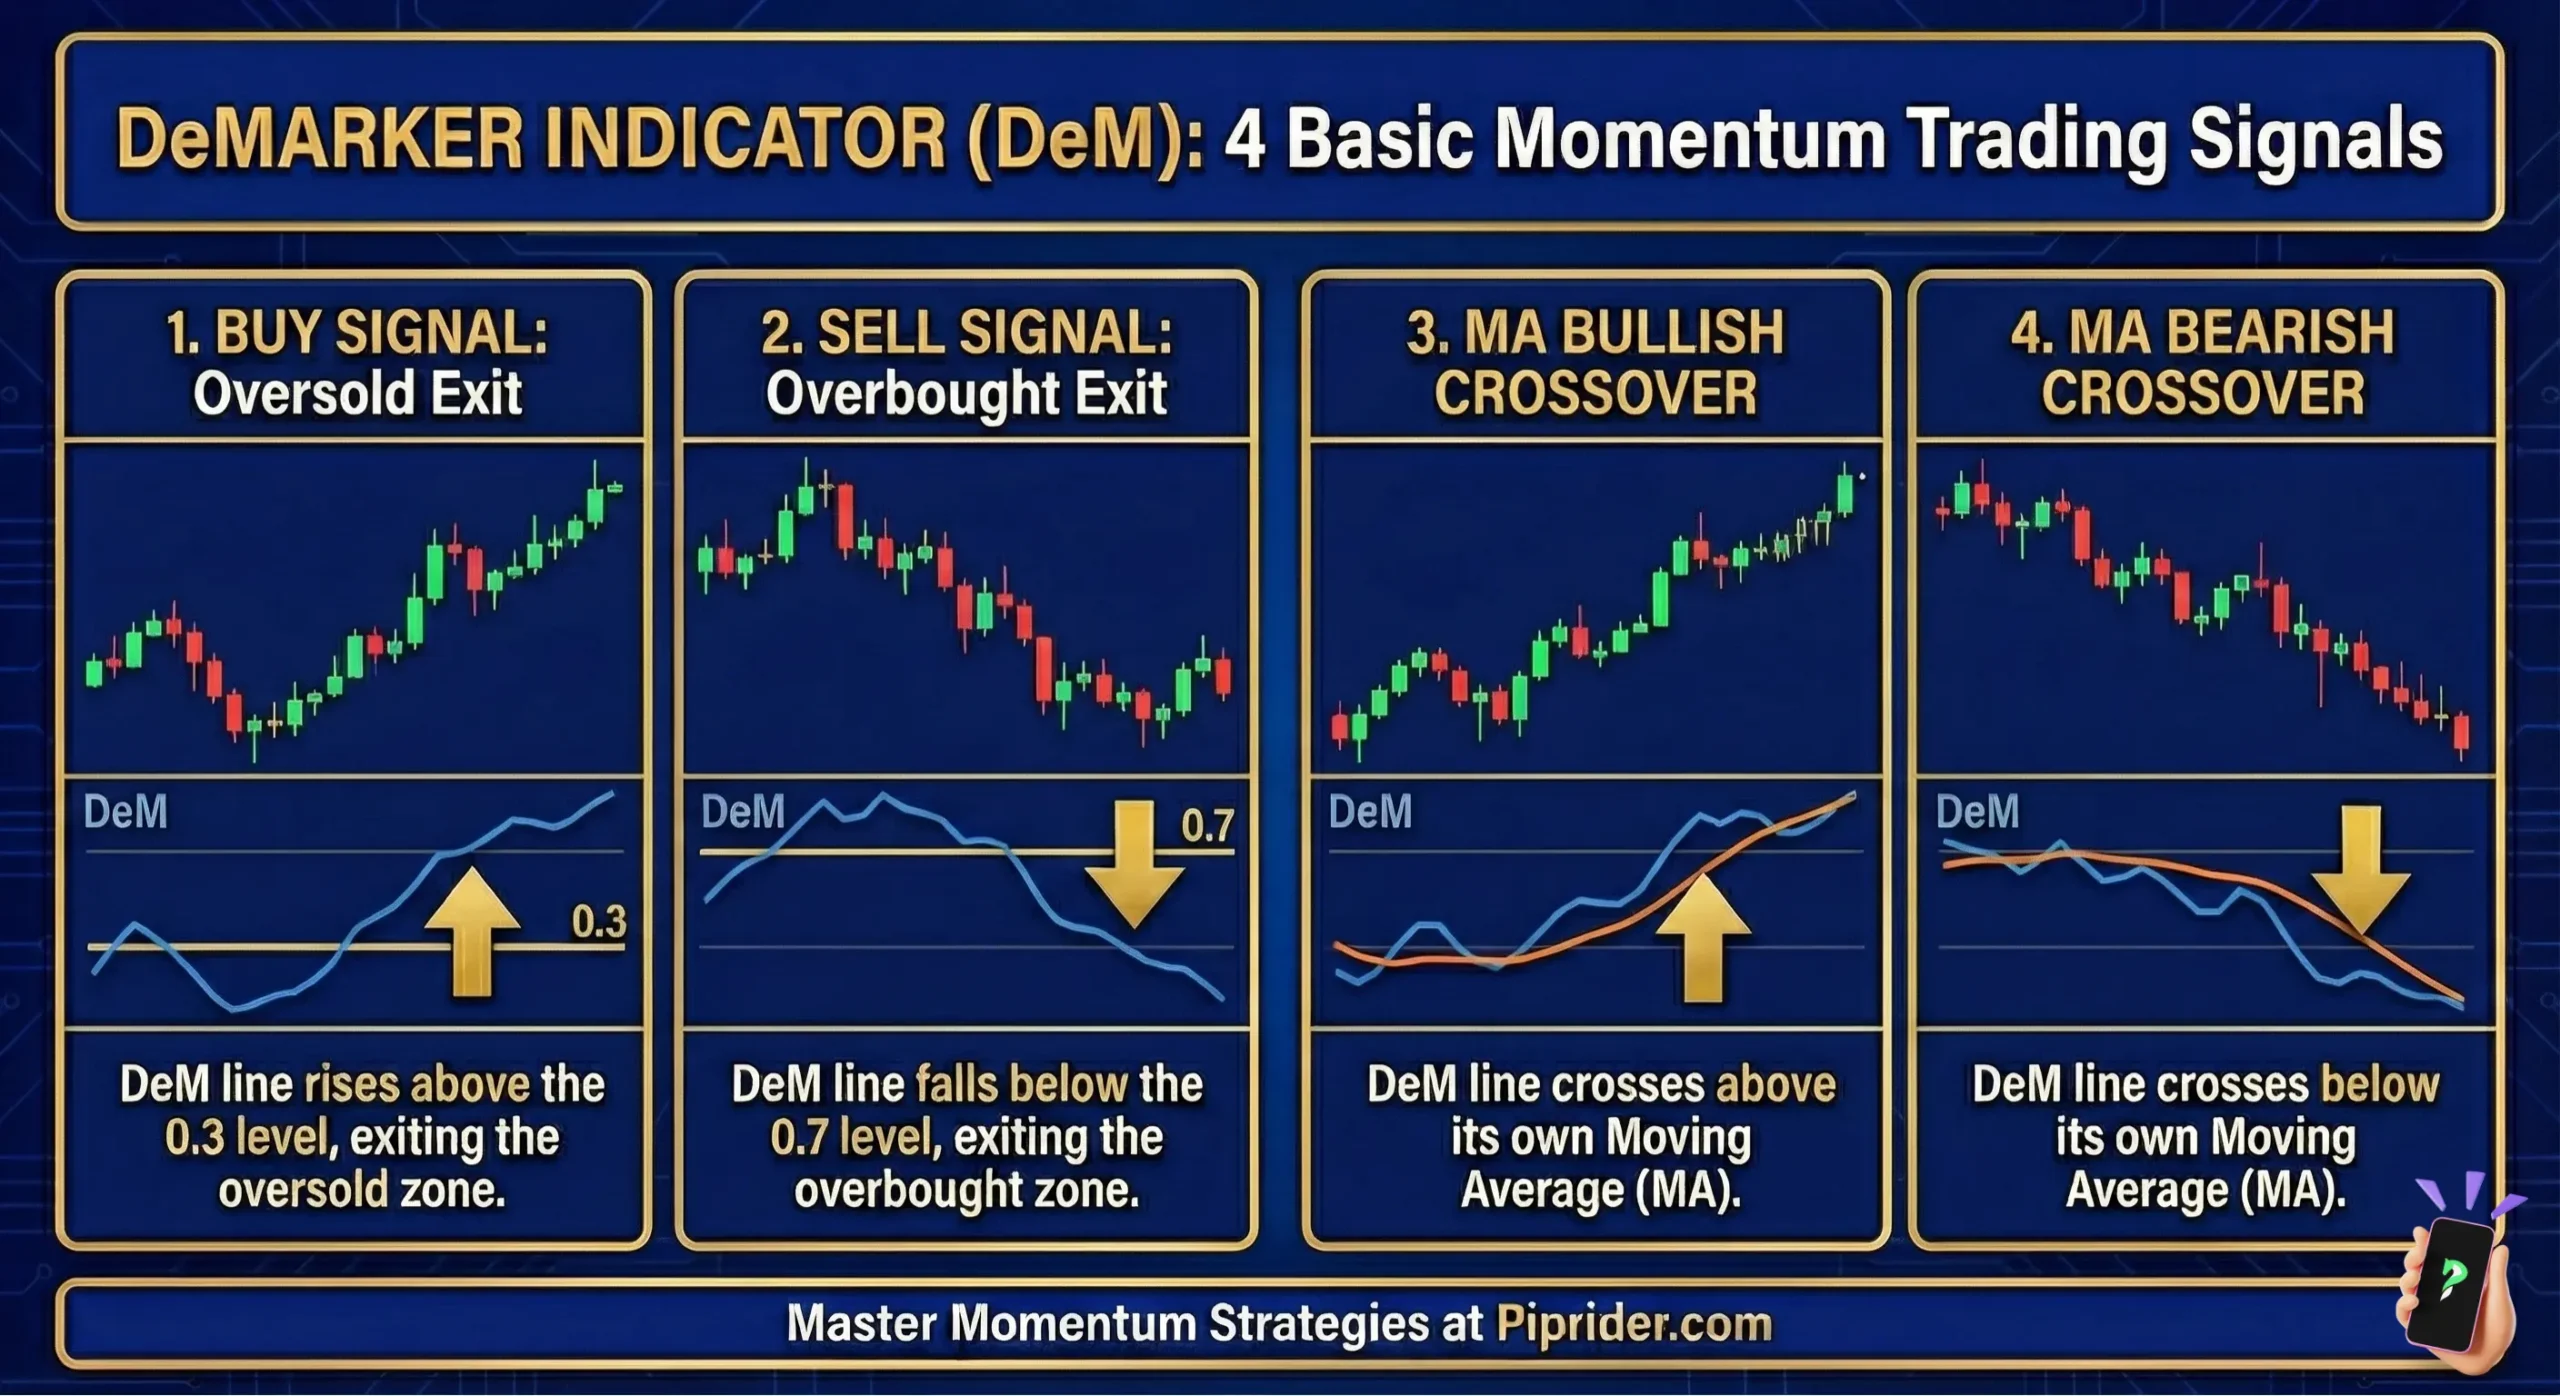
5.1. Strategy 1: Trading overbought & oversold signals
This is the most fundamental way to use the DeM, but it demands patience and confirmation. The signal is not generated when the indicator enters the zone, but when it exits.
- Buy signal: The initial condition requires the DeM to fall into the zone below 0.3. This serves as a warning, not a call to action. The actual signal occurs when the DeM line then climbs back above the 0.3 level. This confirms that the bearish momentum has likely waned, presenting a potential market entry.
- Sell signal: Conversely, wait for the DeM to rise above the 0.7 level. The sell signal triggers only when the line subsequently falls back below the 0.7 level, suggesting the initial buying excitement is fading.
5.2. Strategy 2: Trading divergence signals
Trading divergence signals is the most powerful method for applying the DeMarker indicator. A divergence reveals a clear conflict between price and strength, often serving as an early warning for a significant trend change.
- Bullish: You observe the price on your chart printing a new lower low, but the DeM forms a higher low. This is a strong clue that the selling power behind the new low is weak, and a market bottom might be forming.
- Bearish: The price makes a new higher high, but the DeM carves out a lower high. This is a major warning sign for those in long positions, as it implies that buying power is diminishing and the rally is fragile.
5.3. Strategy 3: Using trendline breaks on the indicator
This is a more advanced technique that can provide very early signals. On occasion, a trendline drawn directly on the DeMarker indicator will break before the corresponding trendline on the price chart gives way.
How it works: If you have a clear uptrend on your price chart, you can draw a parallel trendline on the DeM, connecting its rising valleys. If you see the DeM violate its own trendline while the price remains in its upward movement, it can be a very early heads-up that the underlying strength has weakened and the price may soon follow.
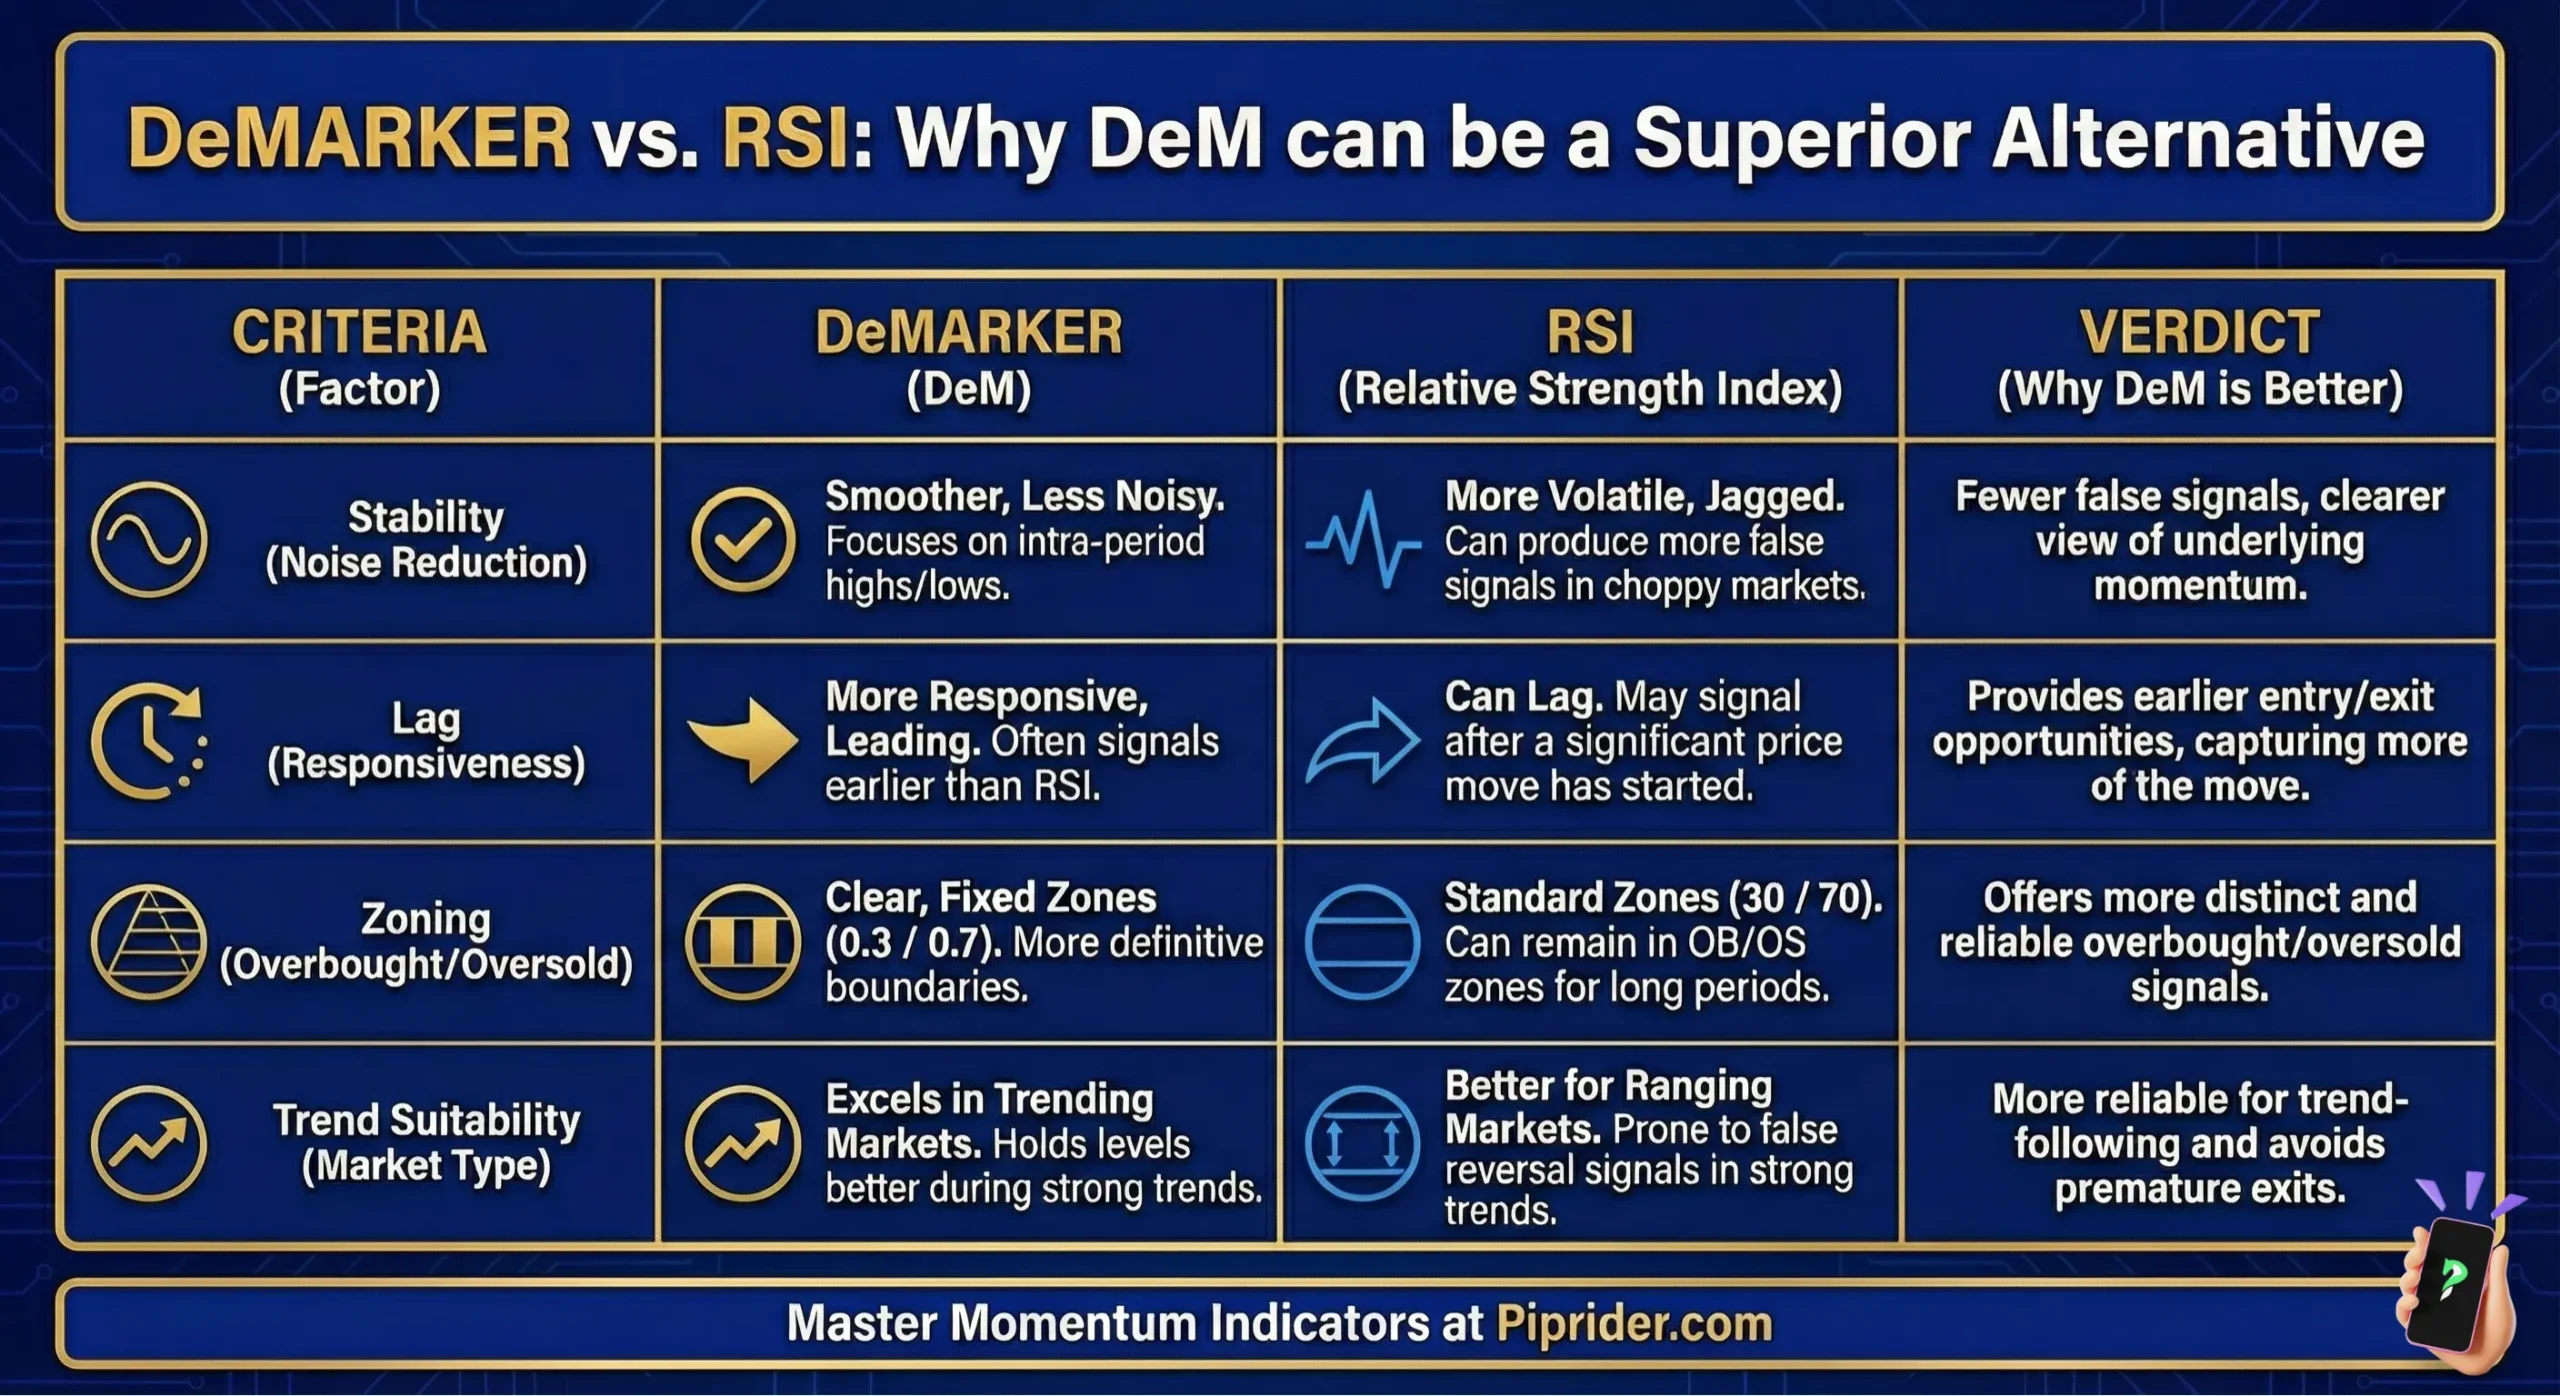
6. Compare the differences between DeMarker indicator and RSI
At a glance, the DeMarker indicator and RSI appear as simple lines moving within boundaries. However, treating them as identical is a critical error. They are built on different philosophies and therefore provide answers to different questions about market drive.
The fundamental difference is in their calculation. The RSI effectively asks, “How powerful have the ‘up’ days been compared to the ‘down’ days?” focusing on the magnitude of price closes. The DeMarker indicator asks a different question: “Is today’s demand strong enough to push price beyond yesterday’s range?” with its focus on comparing intraday highs and lows.
This philosophical difference leads to practical distinctions for traders:
| Feature | DeMarker (DeM) | Relative Strength Index (RSI) |
| Core philosophy | Gauges directional demand and trend fatigue. | Gauges the speed and scale of price movements. |
| Key input data | Compares current high/low to the previous high/low. | Compares average gains of “up” closes to average losses of “down” closes. |
| Signal character | Smoother line. Its SMA-based formula filters out more minor noise, making significant divergences easier to spot. | More responsive line. It reacts quicker to sharp price moves, which can be useful but also creates more “spiky” signals. |
| Best use case | Excellent for forecasting potential market tops/bottoms and identifying trend exhaustion | A classic tool for flagging standard overbought/oversold levels, especially effective in ranging or moderately trending markets. |
From our own trading experience, the “smoothness” of the DeMarker indicator is its primary advantage. In a choppy market, the RSI can sometimes whipsaw erratically, generating small, confusing signals. The DeM tends to glide through that noise, making it much easier to identify the one or two drive shifts that truly matter. It guides your attention to meaningful data rather than market interference.
7. Strengths and weaknesses of the DeMarker indicator
No indicator is a silver bullet. To use the DeM responsibly, you must clearly understand its capabilities and limitations.
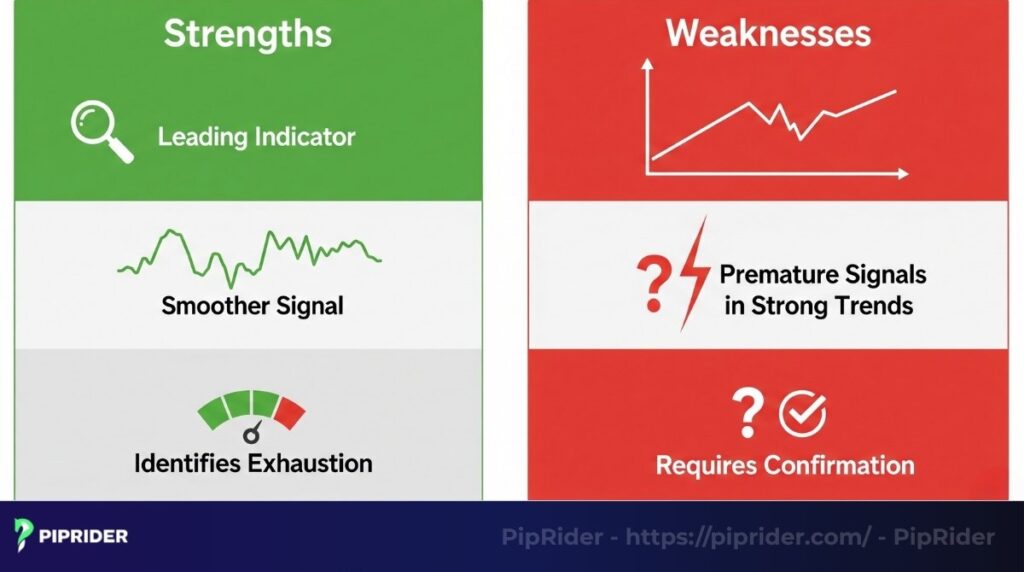
Strengths:
- A leading indicator: The main strength of the DeM is the ability to forecast potential tops and bottoms, often before they become apparent on the price chart.
- Smoother signal: A unique formula often creates a less erratic line than the RSI, which can help filter out false signals in volatile conditions.
- Effective exhaustion detection: The indicator is specifically built to detect when a trend is losing its underlying fuel, making it ideal for timing exits.
Weaknesses:
- Signals prematurely in strong trends: Like all leading indicators, its greatest strength is also its greatest weakness. In a very powerful trend, the DeM can enter an overbought/oversold zone and remain there for an extended time, generating premature reversal signals.
- Requires confirmation: Because DeM’s signals are predictive and not certainties, you must always wait for validation from price action (e.g., a candle pattern or a support/resistance break) before acting on a DeM signal.
Another limitation is that DeM ignores volume data. Pairing it with a volume-based tool like the Chaikin Oscillator creates a more robust system, ensuring that any price momentum signal is supported by actual money flow.
8. Tips for using the DeMarker effectively
Here are a few professional tips, based on our own experience, to help you maximize this powerful indicator’s potential and avoid common pitfalls. These tips align with robust trading rules.
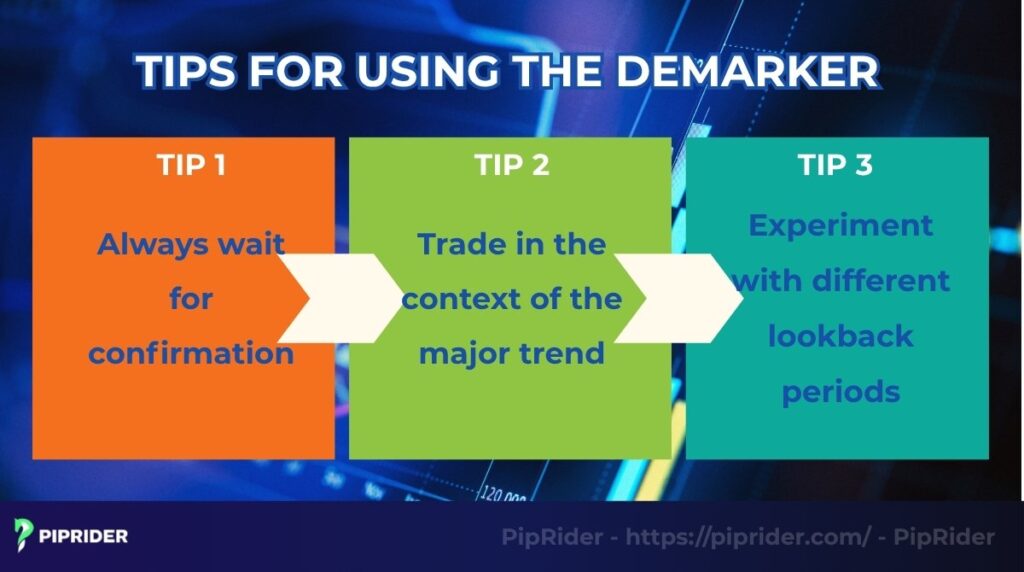
8.1. Always wait for confirmation: The Golden Rule
This is our number one rule when trading with the DeMarker indicator. We’ve learned the hard way that a solitary DeM signal can be misleading. For instance, if we spot a bull, we never jump into a trade immediately.
Instead, we wait for a clear confirmation from the price chart itself, like a bullish engulfing candle or a break of a minor resistance level, before we even consider placing a buy order. This extra step has saved me from countless false signals.
8.2. Trade in the context of the major trend
We find the DeMarker indicator works best as a timing tool for entries that align with the larger trend. In a strong uptrend, we place much more trust in buy signals as the DeM exits the oversold (0.3) zone.
Conversely, we are highly skeptical of sell signals from the overbought (0.7) zone, as they often just represent minor pullbacks in a powerful move up. Aligning the indicator with the bigger picture is key to its success.
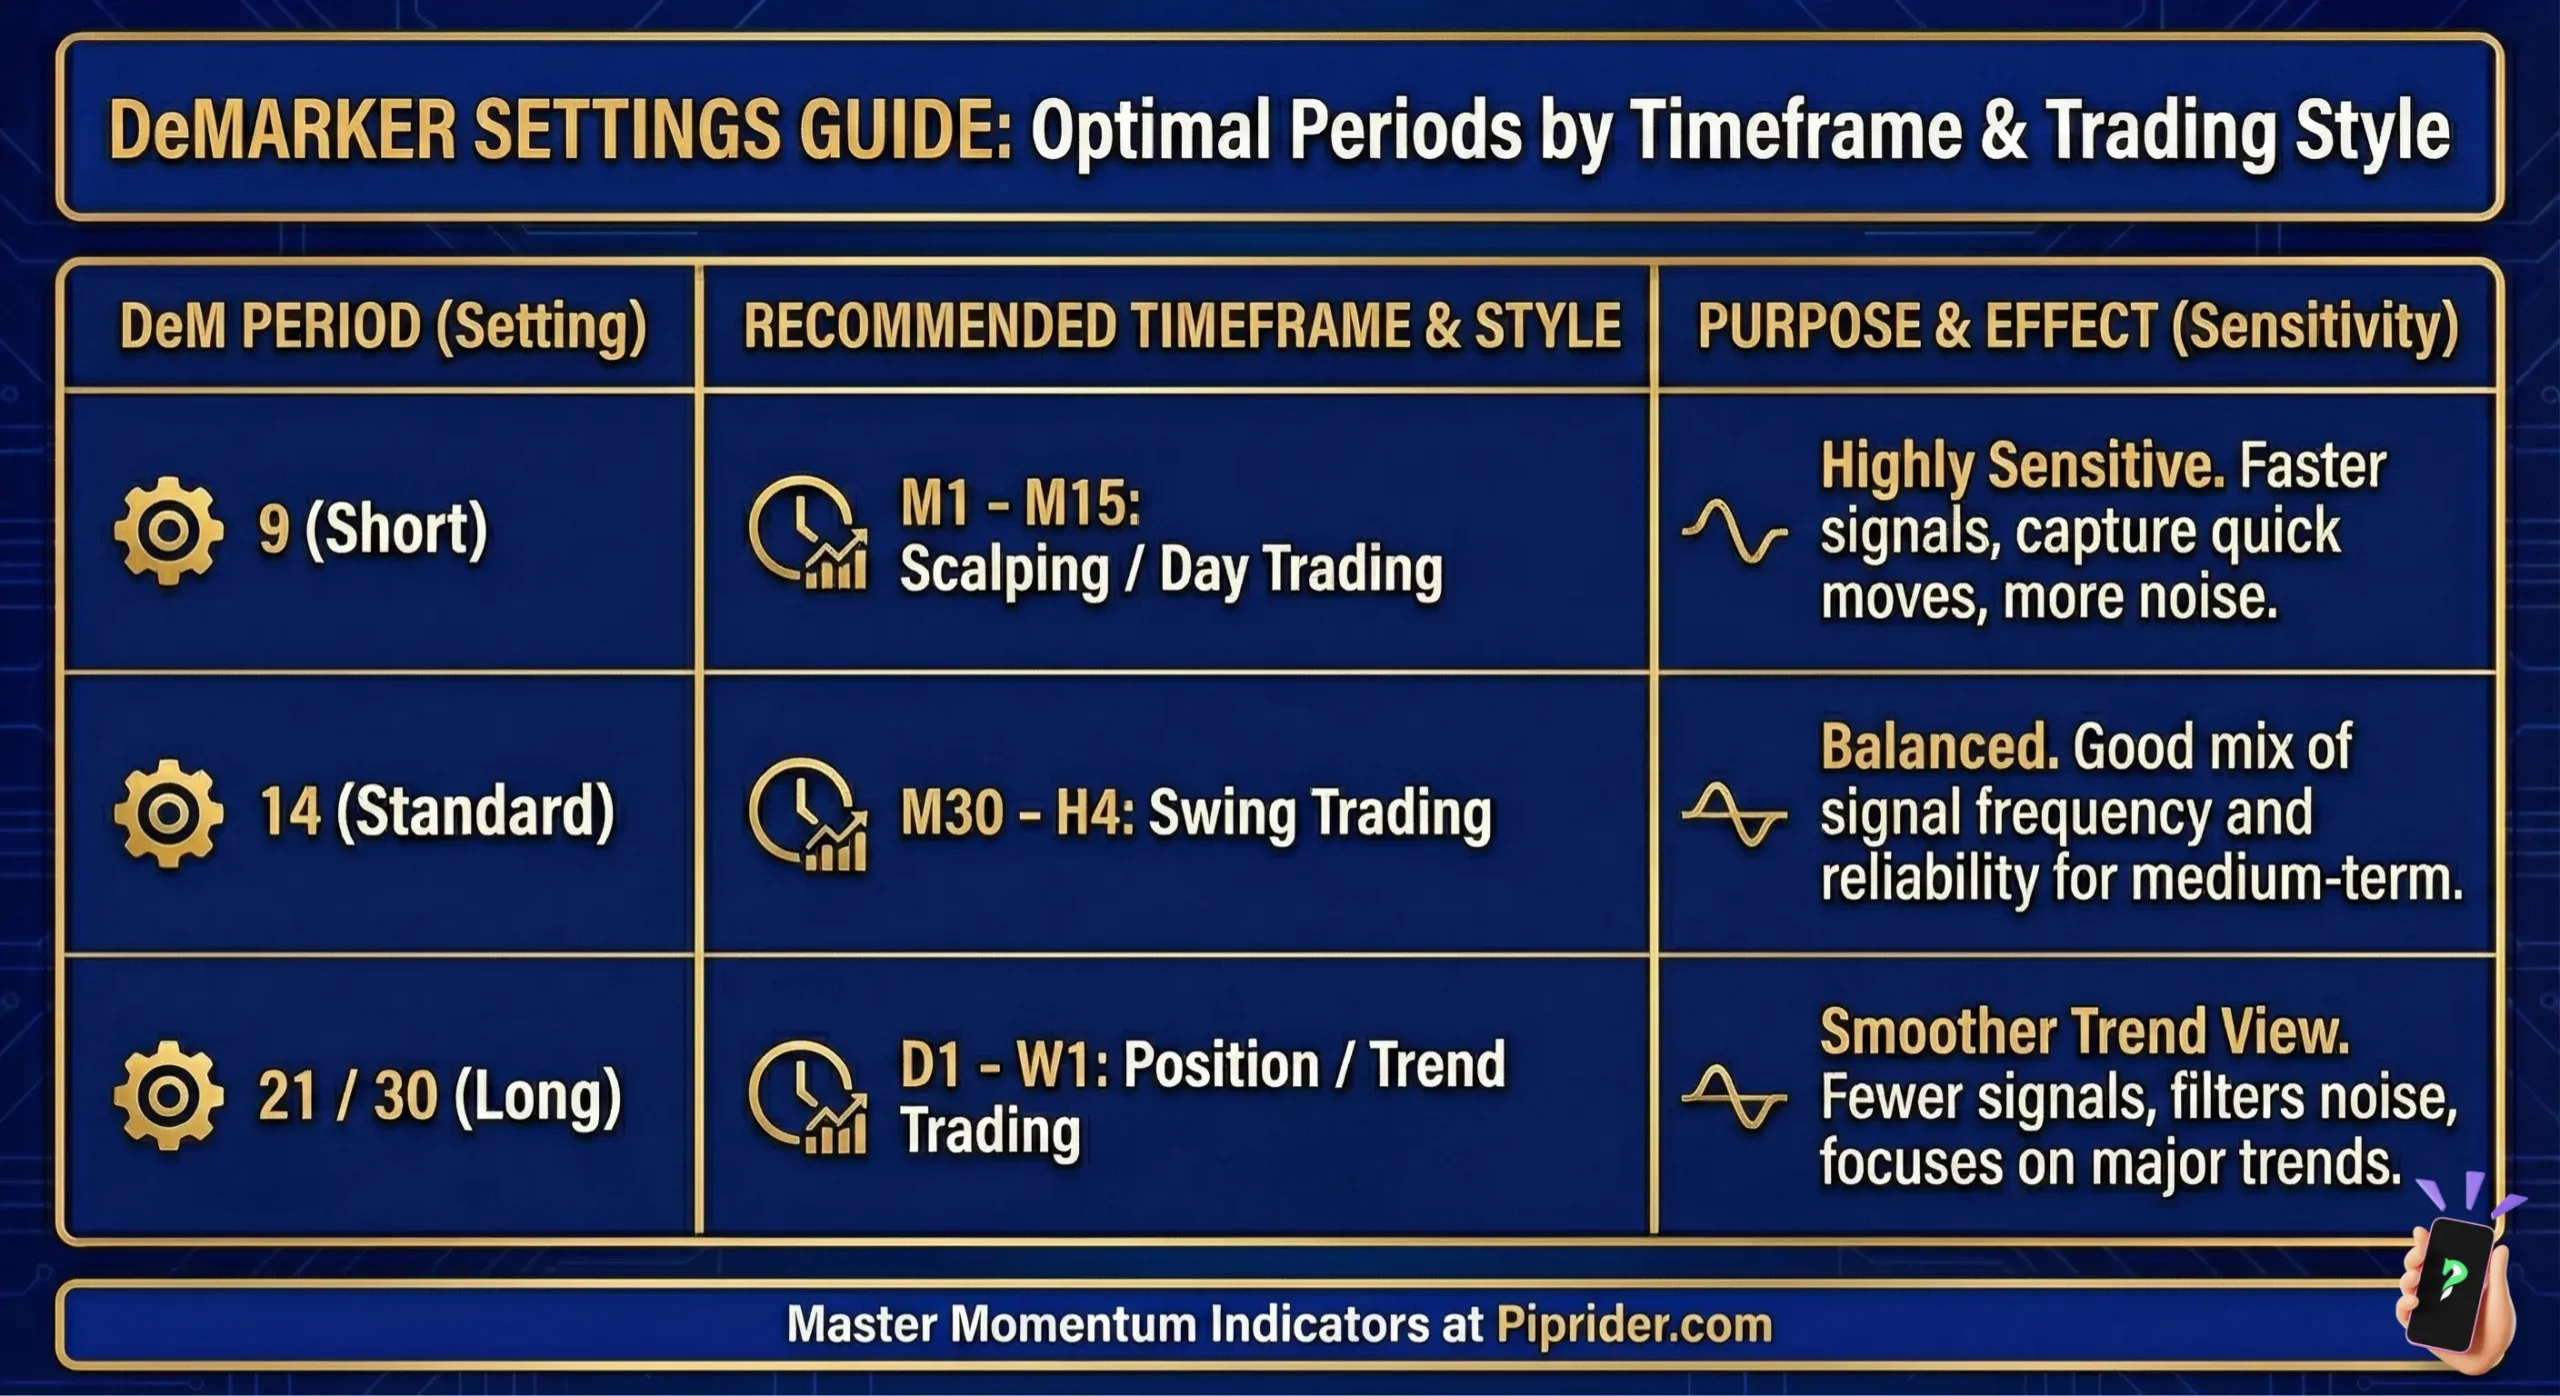
8.3. Experiment with different lookback periods
While 14 is the standard setting, we strongly encourage you to test other values on a demo account. The right setting depends entirely on your trading style. For our day trading, we prefer a shorter period (like 9) because it’s more responsive to the quick drive shifts we are looking for.
For swing trading, we’ll use a longer period (like 21 or 30) because it smooths out the noise and helps us focus on the most significant trend changes. There’s no “one size fits all,” so find what works for you.
Read more:
3 Commodity Channel Index CCI strategies for Forex traders
Percentage Price Oscillator (PPO): Measuring Market Momentum
9. A simple guide to adding DeMarker indicator on MT4 and MT5
Although the process for adding custom indicators on MetaTrader 4 (MT4) and MetaTrader 5 (MT5) is nearly identical, we’ll focus on MT4 as it’s the more popular platform. MT5 users can follow the same steps. These are standard procedures across most trading platforms and charting software.
To add the DeMarker indicator to your chart, just follow these simple steps:
- Open your MT4 trading platform.
- In the Navigator window on the left side, expand the Indicators folder.
- Next, expand the Oscillators subfolder.
- You will find “DeMarker” in the list. Click and drag this indicator directly onto your price chart.
- A pop-up window will appear, allowing you to customize the parameters (such as the period) before it appears on your chart. The indicator will then be displayed in a separate panel below your main price chart.
10. Frequently asked questions (FAQs) about the DeMarker indicator
11. Conclusion
The DeMarker indicator is a powerful, nuanced, and highly effective tool that presents a valuable alternative to more common oscillators like the RSI. Its unique capacity to measure market demand and generate a smoother signal line makes it exceptional for identifying trend exhaustion.
However, always remember that it is a leading indicator. Its signals must be treated with respect and consistently confirmed by price action. By understanding its strengths and weaknesses and incorporating it into a solid trading plan, the DeM can become a vital component of your analytical toolkit.
Are you ready to see the difference the indicator can make in your analysis? Follow Piprider to find out the best technical indicators for your trading now!
Infographic Section
-
DeMarker Indicator: Trading Signals -
DeMarker Indicator Vs. RSI Indicator -
DeMarker Indicator Settings Guide


