The double top pattern is a powerful bearish reversal signal that forms when the market fails twice to break a high. Understanding how to trade double top patterns is critical for spotting market tops, avoiding bull traps, and finding high-probability short entries. This guide explains the structure, confirmation rules, and strategies to trade this pattern like a pro.
Key Takeaways
- A double top pattern is a bearish reversal formation that signals a change from an uptrend to a downtrend.
- It consists of two peaks at a similar price level and a central support level called the neckline.
- The pattern is only valid once the price breaks down below the neckline.
- Traders calculate the price target using a measured move: the vertical distance from the peak to the neckline.
- For higher accuracy, always confirm the pattern with volume, RSI divergence, or a trendline break to avoid false signals.
1. What Is a Double Top Pattern?
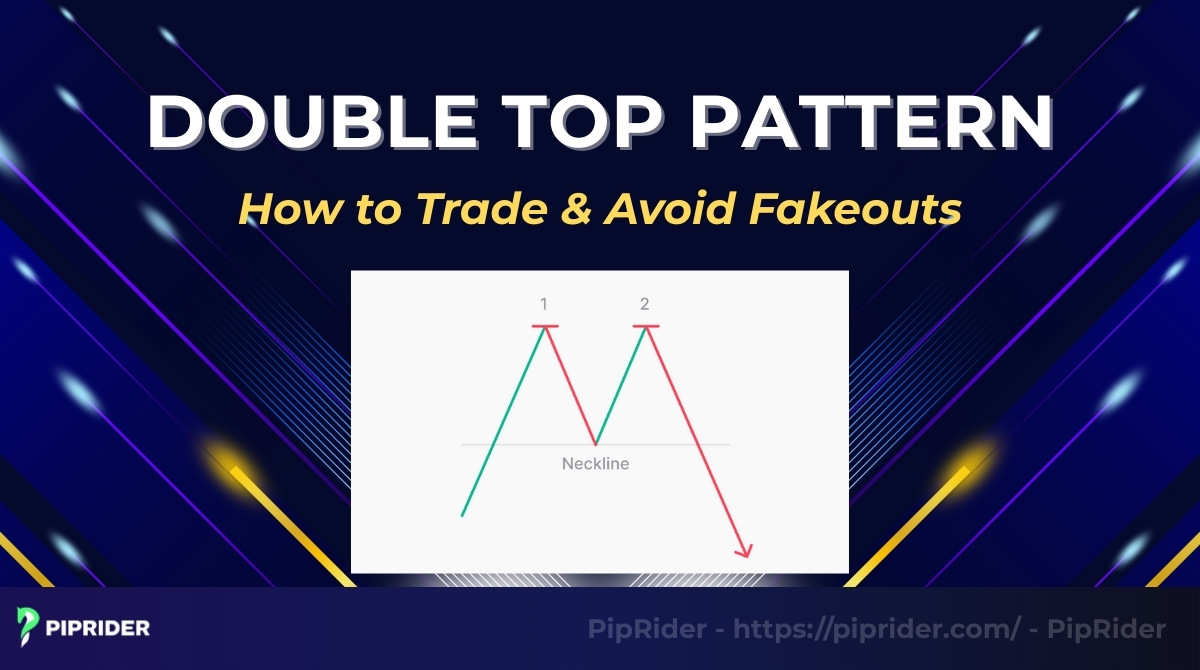
The double top pattern is a bearish technical reversal formation that signals a potential trend change. It occurs when an asset’s price hits a resistance level twice without breaking through, indicating that the uptrend has lost momentum and is shifting to a downtrend.
Visually, this pattern resembles the letter “M” on a price chart.

The pattern consists of three distinct parts:
- First peak: The price rallies to a new high but hits resistance and pulls back.
- Trough (neckline): The price drops to a temporary support level, creating the central trough of the M.
- Second peak: Buyers try to push the price up again to the same resistance level but fail to break it, proving that demand is exhausted.
Psychologically, double top pattern represents a shift in power. The first peak shows strong demand. However, the failure of the second peak to break resistance proves that the upward price movement is weakening. Sellers realize the uptrend is over and begin to take control.
According to Investopedia (2025), a double top is most reliable when it forms after a significant, long-term uptrend. Patterns that take a longer time to form (weeks or months) are generally more accurate than those that form quickly on short timeframes, regardless of specific market conditions.
2. What Does the Visual Structure of a Double Top Look Like?
Visually, a double top pattern is defined by four specific phases that form an “M” shape: the first peak (initial rejection), a pullback to the neckline (support), a second peak (failed breakout), and the final neckline breakdown, which confirms the reversal.
2.1. Peak 1 – First Rejection Zone
The pattern begins when the price rallies to a new high but faces strong resistance. Sellers step in aggressively at this level, rejecting the price and causing the first sell-off. This establishes the initial resistance zone.
2.2. Pullback to Neckline Support
After the rejection, the price retreats until it finds temporary support. This low point is critical because it forms the “neckline” (the middle trough of the “M”). It represents the level where buyers try to save the trend one last time.
2.3. Peak 2 – Failed Breakout Attempt
Buyers make a final attempt to push the price higher. However, as the price approaches the level of the first peak, demand dries up. The price fails to break the previous high (often forming a reversal candlestick pattern with a long upper wick), confirming that the uptrend has run out of steam.
2.4. Neckline Breakdown – Trend Reversal Confirmation
The pattern is not complete until this final step. The price falls back down from the second peak and breaks below the neckline support. This breakdown confirms the reversal, triggering stop-losses from buyers and signaling a new downtrend has begun.
3. What Are the Different Types of Double Top Patterns?
While the classic “M” shape is the standard, the market often creates variations based on volatility and time. Traders typically encounter four specific types. Identifying the specific type helps you adjust your timing and expectations.
Here is a quick cheat sheet to distinguish them:
| Pattern Type | Visual Shape | Market Signal |
| Classic | Two even, symmetrical peaks. | Standard reversal. |
| Adam & Eve | Peak 1 is sharp (A), Peak 2 is round (E). | Accumulation of sell orders. |
| Wide | Peaks are separated by weeks/months. | Major trend change. |
| Failed | Price breaks above Peak 2. | Bullish continuation (Trap). |
3.1. Classic Double Top
The standard version features two peaks separated by a clear trough, creating a symmetrical ‘M’ shape. It signals a neat, textbook reversal where buying pressure hits a clear ceiling twice before giving up.
3.2. Adam & Eve Double Top
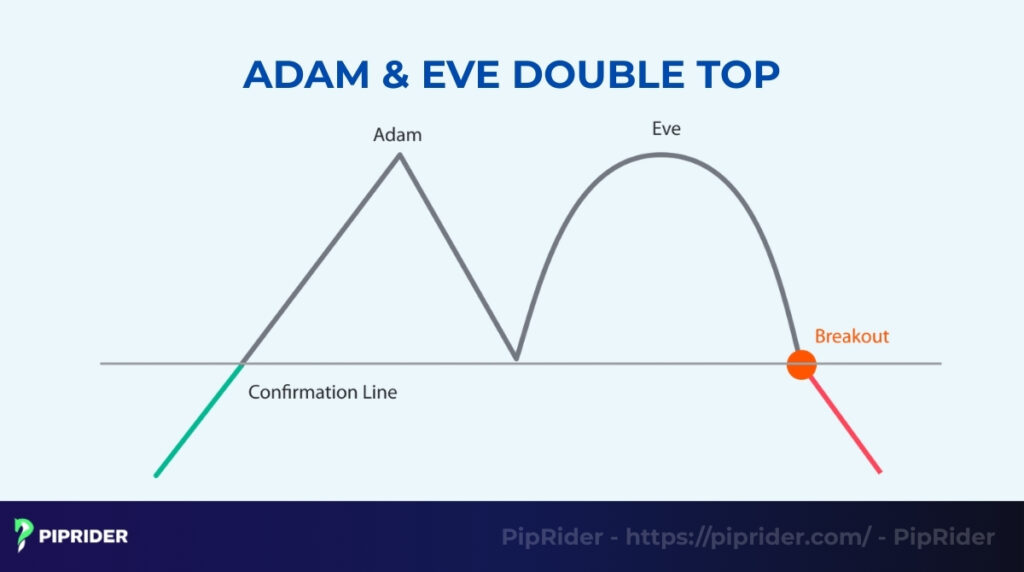
This variation is characterized by two different-looking peaks. The first peak (“Adam”) is sharp and narrow, representing a sudden spike and rejection. The second peak (“Eve”) is wider and rounder, showing a slower, more gradual loss of momentum. This rounded top indicates that sellers are slowly taking control over a longer period.
3.3. Wide Double Top
Timeframe matters significantly in this variation. The two peaks are separated by a long period (weeks or even months). Because the distribution phase lasts longer, a breakdown from a wide double top often leads to a more significant and lasting trend reversal than a narrow one.
3.4. Failed double top (Bullish Continuation)
Not all M-shapes result in a reversal. If the price pulls back from the second peak but finds support above the neckline, it may rally again. If it breaks above the resistance of the two peaks, the pattern has “failed.” Smart traders treat this failure as a powerful bullish continuation signal (often called a “BUST” pattern) and look to buy the breakout.
4. How to Identify a Valid Double Top Pattern
Identifying a valid double top requires more than just finding an “M” shape on the chart. To filter out false signals, you must follow a strict 5-step checklist that verifies the trend, the price structure, and the volume.
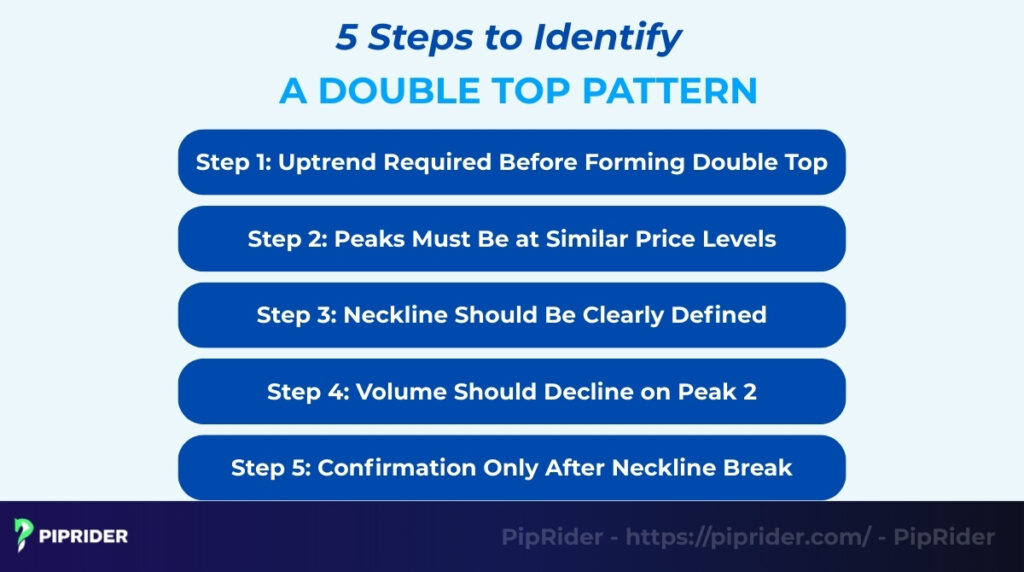
4.1. Step 1: Uptrend Required Before Forming Double Top
A reversal pattern cannot exist without a prior trend to reverse. You must first confirm that the asset is in an established uptrend. If you see an “M” shape in a sideways (ranging) market, it is not a double top; it is just random consolidation.
4.2. Step 2: Peaks Must Be at Similar Price Levels
Visually, the two peaks should look like twins. They do not need to be at the exact same price to the penny, but they should be close. A difference of 3% to 5% between the highs is generally acceptable. If the second peak is significantly lower than the first, it may simply be a lower high in a normal downtrend.
4.3. Step 3: Neckline Should Be Clearly Defined
The neckline is the horizontal support level drawn through the lowest point of the trough (the valley between the two peaks). This line is your “trigger zone.” You must be able to draw a clear, straight line connecting the reaction lows. If the support area is messy or unclear, the pattern is less reliable.
4.4. Step 4: Volume Should Decline on Peak 2
Volume acts as a lie detector. In a classic Double Top, you should see higher volume on the first peak (strong buying) and noticeably lower volume on the second peak. This divergence proves that buying pressure is drying up (“exhaustion”) as the price tries to retest the highs.
4.5. Step 5: Confirmation Only After Neckline Break
The double top pattern is not valid until the price actually breaks support. A common mistake is assuming the pattern is complete while the price is still hovering at the second peak. You must wait for a candle to close decisively below the neckline to confirm the pattern is active.
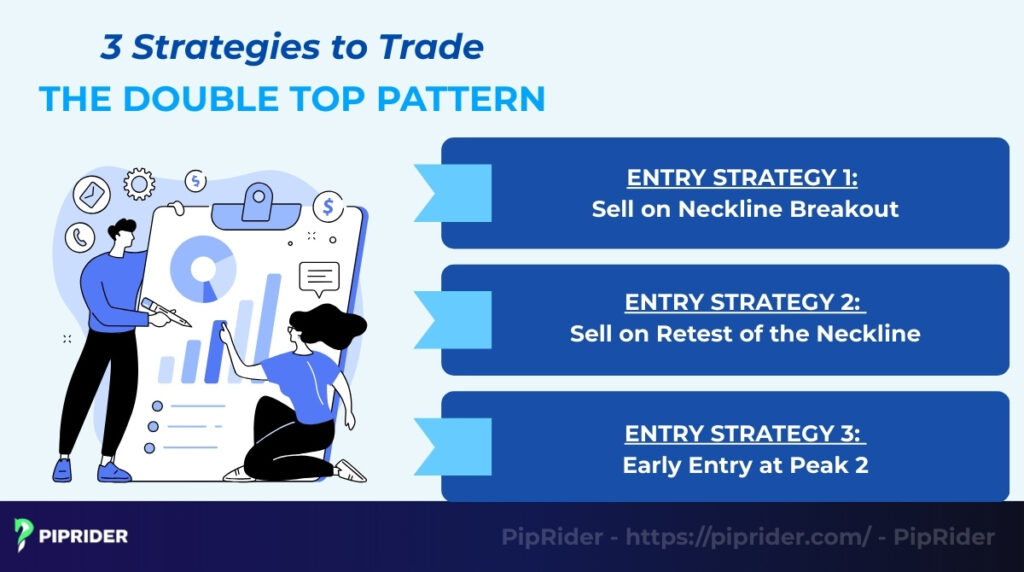
5. How to Trade the Double Top Pattern
Once you identify the pattern, execution is key. Traders typically use three main strategies depending on their risk tolerance.
Here is a quick comparison to help you choose the right entry:
| Strategy | Risk Level | Reward Potential | Best For |
| 1. Neckline Breakout | Medium | Medium | Standard Traders |
| 2. The Retest (Pullback) | Low | High | Conservative Traders |
| 3. Peak 2 (Aggressive) | High | Very High | Pro / Sniper Traders |
5.1. Entry Strategy 1: Sell on Neckline Breakout
Trading the breakout is the standard approach used by most retail traders because it waits for the pattern to fully complete. By waiting for the support to break, you have confirmation that the sellers have officially taken control.
- The Setup: Wait patiently for the price to breach the support level.
- The Trigger: Enter a “Sell” trade only when a candle closes decisively below the neckline. This breakdown serves as your primary entry point.
- Risk: Be careful of “fakeouts” (whipsaws) in volatile market conditions where price breaks down but snaps back up.
5.2. Entry Strategy 2: Sell on Retest of the Neckline
A more conservative method involves waiting for a retest, relying on the principle that “broken support becomes new resistance.” This approach requires patience but often provides a better entry price and a safer stop-loss location.
- The Setup: After the breakdown, wait for the price to rally back up to touch the neckline.
- The Trigger: Enter on a bearish rejection candle (like a pin bar) at the retest level.
- Advantage: This filters out many false signals and improves your risk-to-reward ratio significantly.
5.3. Entry Strategy 3: Early Entry at Peak 2 (Aggressive)
Aggressive traders try to “snipe” the very top by entering at the second peak. This strategy does not wait for the neckline break; instead, it anticipates the reversal based on resistance failure.
- The Setup: Watch the price closely as it tests the resistance level of the first peak.
- The Trigger: Look for strong reversal candlesticks (like a shooting star or bearish engulfing) right at the resistance line.
- Advantage: This offers the tightest stop loss and biggest profit potential, but carries the highest risk if the trend continues upward.
5.4. Stop Loss Placement
Effective risk management is vital, and your stop loss placement should depend on which entry strategy you chose. The goal is to place it where the trade setup is proven “wrong,” establishing a clear invalidation exit point.
- Conservative SL: Place it just above the second peak or the nearest supply zone. If price breaks this high, the reversal pattern has failed.
- Aggressive SL: Place it just above the breakout candle (for Strategy 1) or the rejection candle (for strategy 2) to keep the risk tight.
5.5. Take Profit Targets
You need a clear profit target to lock in gains before the market finds new support. Traders usually combine measured moves with historical levels.
- TP1 (Measured Move): Measure the vertical distance from the peak to the neckline and project it downward from the breakout point.
- TP2 (Support Zones): Look left on the chart to find the next major historical support level where buyers might step in.
- TP3 (Fibonacci): Advanced traders use Fibonacci extensions (like the 1.272 or 1.618 levels) to find extended targets for a longer downtrend.
6. Measured Move: How to Calculate the double top Target
Establishing a clear profit target is just as important as finding the entry. The “measured move” technique gives you a specific, mathematical goal based on the pattern’s own structure.
6.1. Step 1: Measure the Height
First, calculate the vertical distance of the double top pattern. Measure the number of pips or points from the highest peak down to the bottom of the trough. For example, if the peak is at $150 and the neckline is at $140, the height is $10.
6.2. Step 2: Project from the Breakout
Next, take that height value and project it downward from the breakout point. If the neckline breaks at $140, you subtract $10. Your theoretical target is $130. This assumes that the downward momentum will equal the upward momentum that created the pattern.
6.3. Adjust for Volatility (ATR)
Real markets rarely move in perfect straight lines. To be safe, professional traders adjust their targets based on volatility.
- The 80% Rule: Instead of aiming for the full 100% measured move, set your target at 80% of the distance. This ensures you exit the trade before the trend runs out of steam.
- Using ATR indicator: You can also subtract 1x ATR (Average True Range) value from your target. If the market is moving slowly (low ATR), aim for a smaller target to avoid getting stuck in a reversal.
7. Which Techniques Confirm the double top pattern?
Trading a double top without confirmation is risky because the market often fakes a reversal before continuing higher. To filter out these “bull traps,” professional traders look for confluence from these four technical signals.
7.1. Volume Confirmation (The Fuel)
Applying volume analysis is the most important validator. You should look for a specific pattern: decreasing volume on the second peak (showing lack of buyer interest) followed by a massive spike in volume as the price breaks the neckline. High volume on the breakdown confirms that institutions are aggressively selling.
7.2. RSI Divergence (The Early Warning)
The RSI Relative Strength Index often spots the reversal before price action does. Look for bearish divergence: while the price creates two equal highs (the double top), the RSI indicator creates a lower high. This disagreement signals that although price is high, the underlying momentum is dying.
7.3. MACD Bearish Crossover
The MACD indicator (Moving Average Convergence Divergence) provides a clear momentum shift signal. Traders watch for the MACD line to cross below the signal line (a bearish crossover). If this crossover happens at the same time the second peak is forming, it strongly supports the bearish case.
7.4. Trendline Break Confirmation
Before the price even reaches the neckline, it often breaks a major diagonal trendline. Draw a line connecting the lows of the uptrend. A break and close below this rising trendline is usually the first “domino” to fall, warning you that the double top structure is forming and the trend is changing.
8. How Does the Double Top Compare to Similar Patterns?
Traders often confuse the double top with other reversal patterns. Misidentifying the structure can lead to entering trades too early or setting the wrong targets.
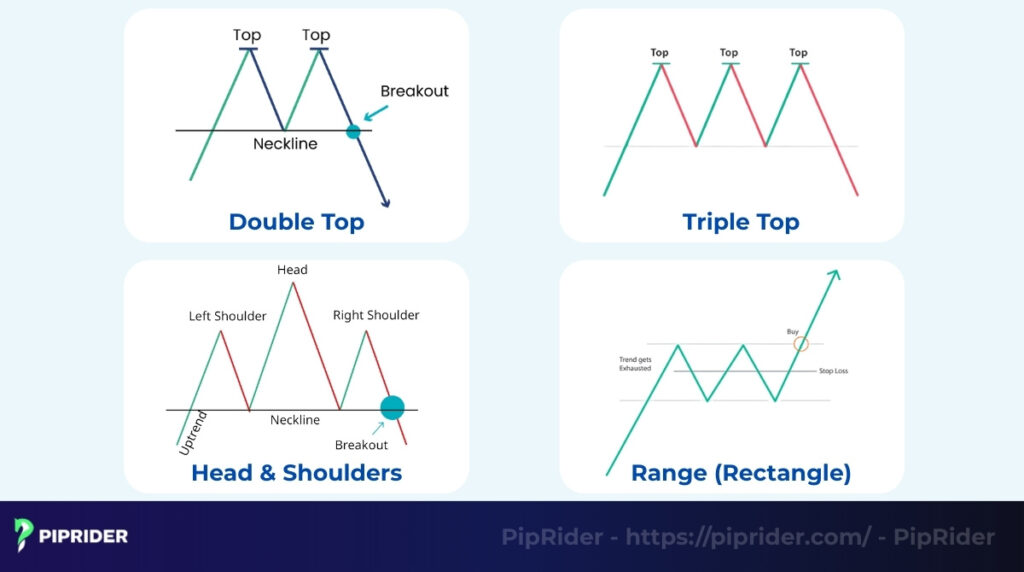
Here is a quick comparison guide:
| Pattern | Key Difference | Signal Strength |
| Double Top | Two peaks at similar height. | Strong reversal |
| Triple Top | Three peaks hitting resistance. | Very strong (More rare) |
| Head & Shoulders | Middle peak (Head) is higher. | Strongest reversal |
| Range (Rectangle) | Peaks have no prior uptrend. | Neutral (until breakout) |
8.1. Is a double top the Same as an M-Pattern?
No, context is the key difference. While every double top looks like an “M,” not every “M” on the chart is a Double Top. A valid double top must appear after a clear, extended uptrend. If you see an “M” shape forming in the middle of a sideways consolidation range, it is likely just market noise, not a reversal signal.
8.2. What Is the Difference Between a Double Top and Triple Top?
The difference is the number of failed attempts. A triple top features three distinct peaks hitting the same resistance level instead of two. It represents a longer battle between buyers and sellers. Because the resistance has held three times, the eventual breakdown from a triple top is often more explosive than a double top.
8.3. How Does it Differ from a Head and Shoulders?
The main difference is the height of the middle peak. In a Double Top, the two peaks are roughly equal. In a head and shoulders pattern, the middle peak is significantly higher than the left and right peaks. This indicates a failed higher high, whereas a double top shows a failure to even make a higher high.
9. What Are Common Mistakes When Trading Double Tops?
Even experienced traders can lose money if they rush into a trade without following the rules. Most losses come from impatience or ignoring market context.
- Entering too early: Selling the moment price touches Peak 2 without confirmation is risky. Price often blasts through resistance, turning the pattern into a trend continuation.
- Ignoring context: A double top must reverse an uptrend. An M-shape appearing in a sideways market is likely just random noise, not a valid signal.
- Disregarding volume: Peak 2 requires lower volume than Peak 1. High volume suggests buyers are still aggressive, invalidating the bearish setup.
- Setting stop-losses too tight: Placing stops exactly at the high invites “stop hunting.” Always give your trade breathing room to ensure you have a clear exit point by placing stops slightly higher or using the ATR indicator.
10. What Do Real double top Examples Look Like?
Understanding the theory is one thing, but spotting it on a messy chart is another. Here are three real-world examples across different markets.
10.1. Forex double top (EUR/USD)
Currency pairs often form Double Tops at the end of a medium-term trend.
- The Setup: On the 4-Hour chart, EUR/USD rallies to 1.1200 but gets rejected. It pulls back to 1.1150 (Neckline) and then rallies again to 1.1200.
- The Trigger: The second peak shows a long wick, signaling exhaustion. A trader waits for a solid candle close below 1.1150 to enter a short position, targeting the next support at 1.1100, leading to a deeper price decline.
10.2. Stock Market double top (AAPL)
Stocks often form Double Tops over longer timeframes, signaling a shift in fundamental sentiment.
- The Setup: Apple (AAPL) hits an all-time high of $180 on high volume. It drops, then retries $180 weeks later on much lower volume.
- The Trigger: The price breaks the neckline at $170. This confirms that institutional investors are distributing (selling) shares, leading to a deeper correction.
10.3. Crypto double top (BTC)
Crypto markets are volatile, so “Adam & Eve” variations are common here.
- The Setup: Bitcoin spikes sharply to $65k (Adam Peak) and crashes. It slowly grinds back up to $65k over several weeks (Eve Peak) but fails to break out.
- The Trigger: The failure to break the ATH (All-Time High) confirms a lack of momentum. When the neckline breaks, it triggers massive liquidation of long positions, accelerating the downtrend.
11. Which Tools Can Help You Spot Double Tops Automatically?
Finding patterns manually takes practice. Modern trading platforms offer automated tools to detect these formations for you, saving time and reducing errors.
- TradingView (auto pattern detection): TradingView has a built-in indicator called “Chart Patterns.” You can simply select “Double Top” from the menu, and it will automatically highlight valid patterns on your chart in real-time.
- TrendSpider (pattern scanner): This AI-powered platform is designed for automation. Its “Market Scanner” can search thousands of stocks instantly to find tickers that are currently forming a double top pattern.
- MT4/MT5 indicators: For Forex traders, the MetaTrader community offers hundreds of custom indicators. You can download specific “Double Top/Bottom” scanners from the marketplace that send alerts to your phone when a pattern forms.
12. Frequently asked questions about Double Top Pattern
Traders often have questions about reliability, timing, and context. Here are the answers to the most common questions.
13. Conclusion
The double top pattern is a reliable reversal signal, but only when confirmed. To avoid expensive “bull traps,” always wait for a clear neckline breakdown supported by volume or RSI divergence.
Don’t guess the top. Wait for confirmation, use the Measured Move for targets, and trade with discipline. Ready to master more technical patterns? Explore the comprehensive trading guides and strategies at Piprider today.