The hammer candlestick pattern is one of the most powerful reversal signals in price action trading. When it appears at a key support level or the end of a downtrend, the hammer candlestick helps traders identify market bottoms with low risk and high probability. This guide explains exactly how to spot and trade it effectively.
Key Takeaways
- The hammer is a bullish reversal pattern that appears exclusively after a downtrend.
- Structure: It has a small real body, a long lower wick (at least 2-3 times the body length), and little to no upper wick.
- Confirmation: The signal is strongest when the next candle closes above the high of the hammer.
- Location matters: It is most effective when found at support zones or in oversold conditions.
- Warning: Avoid trading hammers that appear in the middle of a sideways range or lack volume confirmation.
1. What Is a Hammer Candlestick Pattern?
The hammer candlestick pattern is a bullish reversal formation that appears at the bottom of a downtrend. It signals that selling pressure is weakening and buyers are beginning to take control (Thompson, 2025).
Visually, it resembles a physical hammer, characterized by a small body at the top and a long lower wick.
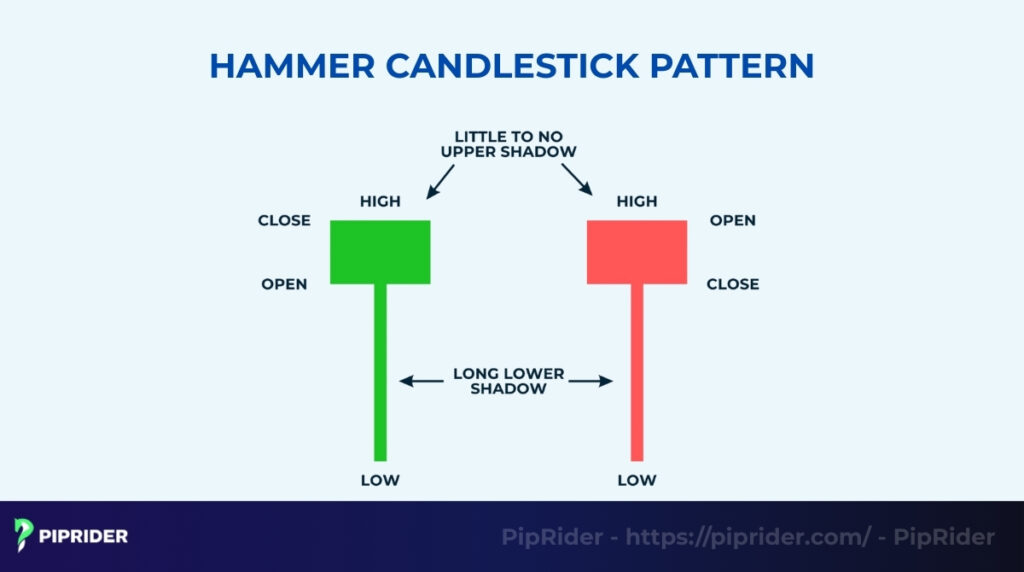
To identify a valid hammer, look for these three specific traits used in technical analysis:
- The trend: It must form after a decline. A hammer in a sideways market is not a valid signal.
- The shape: It has a small real body and a long lower shadow that is at least two times the length of the body. Ideally, there is no upper shadow.
- The confirmation: The pattern is only considered complete when the next candle closes above the Hammer’s closing price.
1.1. Why the Hammer Signals a Bullish Reversal
The Hammer pattern represents a classic sign of price rejection. During the session, sellers aggressively pushed the price down to a new low, creating the long wick, but they failed to hold that ground. Buyers stepped in to absorb the selling pressure and pushed the price back up near the open, proving that bearish momentum is exhausted and a bullish reversal is likely.
1.2. Hammer vs. Inverted Hammer (Don’t Confuse)
Traders often confuse the standard hammer candlestick with the inverted hammer. Both appear at the bottom of a downtrend and signal a potential buy, but they look different.
- Hammer: The long wick is on the bottom (Rejection of lows).
- Inverted Hammer: The long wick is on the top (Test of highs).
2. How to Identify a valid Hammer Pattern
Not every hammer-shaped candle is a tradable signal. To filter out random market noise and find high-probability setups through pattern recognition, you must verify these four specific criteria.
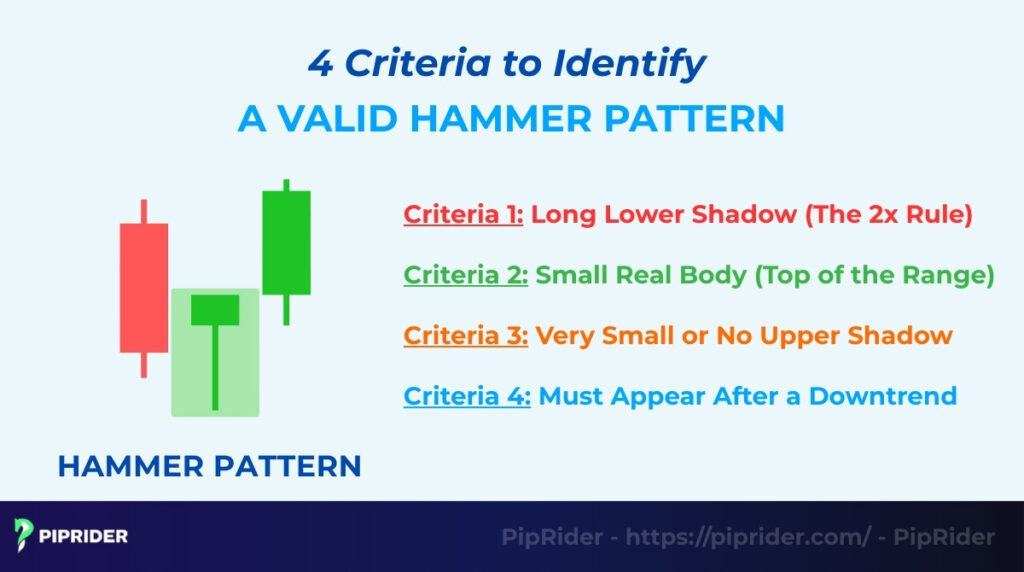
2.1. Long Lower Shadow (The 2x Rule)
The lower shadow is the most important feature. To be considered a valid signal, the shadow must be at least two to three times the length of the real body. This extreme length represents the intensity of the price rejection; a short wick simply suggests indecision, not a strong reversal.
2.2. Small Real Body (Top of the Range)
The “real body” (the area between the open and close price) should be small and situated at the very top of the trading range. This visual structure confirms that buyers were strong enough to push the price back up to the session’s highs before the close.
2.3. Very Small or No Upper Shadow
A perfect hammer should have no upper shadow (wick). If a shadow does exist, it must be extremely short. A long upper shadow implies that sellers stepped back in to push the price down from the highs, which weakens the bullish sentiment and makes the pattern less reliable.
2.4. Must Appear After a Downtrend
Market context is the ultimate filter. Since the hammer is a reversal pattern, there must be a trend to reverse. You should look for this pattern only after a clear series of lower lows (a downtrend). If you see a hammer shape in a sideways or choppy market, it is invalid and should be ignored.
3. What Is the Market Psychology Behind the Hammer?
Technical analysis is ultimately the study of human behavior. The hammer candlestick pattern tells a dramatic story of a failed attack by sellers and a surprise counter-attack by buyers, often occurring during high market volatility.
3.1. Sellers Push Price Down but Buyers Absorb Supply
When the candle opens, the market is still gripped by fear from the existing downtrend. Sellers aggressively dump their positions, driving the price significantly lower. This creates the long lower shadow. At this point, it looks like the market will crash further. However, as the price drops, “Smart Money” steps in, seeing value at these low levels, and absorbs the selling pressure.
3.2. Shift in Momentum From Bearish to Bullish
Once the heavy selling is absorbed, the supply dries up. The market sentiment shifts rapidly from panic to greed. Buyers begin to bid the price up aggressively, forcing the sellers (bears) to cover their short positions. This short-covering fuels the rally even further, pushing the price back up toward the opening level.
3.3. Why the Close Near High Shows Buyer Dominance
The final close is the most critical part of the story. By closing near the session’s high, the buyers have successfully erased all the intraday losses. This visual victory proves that the bears have lost control and the bulls are now dominant, setting the stage for a reversal.
4. What Are the Different Types of Hammer Patterns?
Not all hammers are created equal. While the shape remains the same, the context determines whether the signal is weak, standard, or high-probability.
4.1. Bullish Hammer (Standard)
This is the textbook version of the hammer candlestick pattern found at the bottom of a downtrend. It meets all the visual criteria (small body, long wick), but it appears “in the middle of nowhere” without a specific support level. While valid, it carries moderate risk and absolutely requires a confirmation candle before entry.
4.2. Hammer at Support (High-Probability Setup)
Location is the difference between a good trade and a great one. When a hammer forms exactly on major support levels, a rising trendline, or a key moving average, the probability of success skyrockets. This “confluence” proves that buyers are defending a specific price floor.
4.3. Volume-Confirmed Hammer
Volume acts as the fuel for the reversal. Applying volume analysis can confirm the signal; a Hammer accompanied by a massive spike in trading volume indicates “Climax Selling.” It means the last of the sellers have panicked out, and smart money has absorbed all the supply. This is often the strongest reversal signal available.
4.4. Failed Hammer (Weak Setup)
Traders must also recognize when a pattern is broken. A hammer fails if the price closes below the lower wick on the following candles. This usually happens when a hammer forms in a strong bearish trend without waiting for confirmation, turning the “reversal” into a mere pause before the crash continues.
5. Hammer Candlestick vs. Similar Patterns
Traders often confuse the hammer candlestick pattern with other single-candle formations. Misidentifying these patterns can lead to entering trades in the wrong direction.
Here is a quick comparison guide:
| Pattern | Key Visual Difference | Trend Context | Signal Meaning |
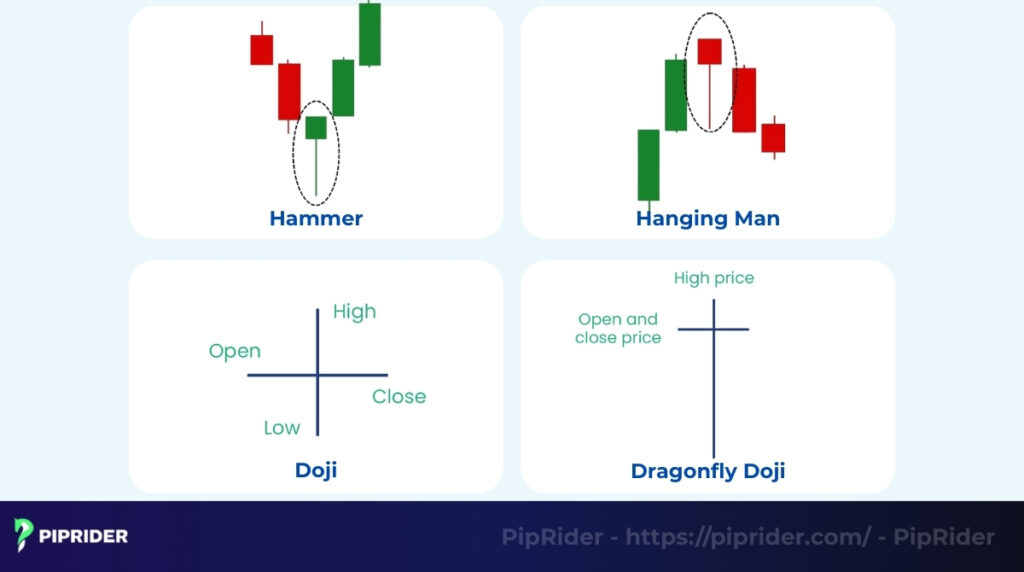
| Hammer | Small body, long lower wick. | Downtrend | Bullish Reversal |
| Hanging Man | Identical to Hammer. | Uptrend | Bearish Reversal |
| Doji | No body (Open = Close). | Any | Indecision |
| Pin Bar | Long wick, small body at one end. | Any | Price Rejection |
| Dragonfly | No body, long lower wick. | Downtrend | Strong Bullish |
5.1. Hammer vs. Doji
The primary distinction between these two lies in the body size and what it represents regarding market conviction.
- Hammer: Has a small but visible “real body,” indicating that buyers managed to push the price slightly higher than the open (green) after a long lower shadow rejection.
- Doji: Has essentially no body (a flat line). The Open and Close prices are virtually identical. While a hammer shows buyer strength, a doji represents total indecision or a stalemate between buyers and sellers.
5.2. Hammer vs. Hanging Man
These two patterns look visually identical, which causes the most confusion for beginners. The only difference is the trend context in which they appear.
- Hammer: Appears after a price drop (Downtrend). It signals a potential bottom.
- Hanging Man: Appears after a price rise (Uptrend). It signals a potential top. If you see a “hammer” shape at the top of a chart, do not buy; it is a hanging man warning you to sell.
5.3. Hammer vs. Pin Bar
The terms are often used interchangeably, but there is a slight distinction based on the trading methodology (Price Action vs. Japanese Candlesticks).
- Pin Bar: A broad “Price Action” term for any candle with a long wick that “pins” (rejects) a price level.
- Hammer: A specific “Japanese Candlestick” term with strict definitions.
- Relationship: Every hammer is a bullish pin bar, but not every pin bar is a hammer (pin bars can appear in different contexts or have longer upper wicks).
5.4. Hammer vs. Dragonfly Doji
The dragonfly doji is often considered a “perfect” or more extreme version of the hammer because it shows a complete rejection of the lows.
- Hammer: Has a small body, showing some struggle.
- Dragonfly Doji: Has no body and usually no visible upper shadow. The Open, High, and Close are all at the exact same level. This indicates that despite selling pressure, buyers pushed the price all the way back to the absolute high of the session, making it a very potent bullish signal.
6. How to Trade the Hammer Pattern: Strategies for Entry & Exit
Identifying the pattern is only the first step. To make money, you need a concrete trading strategy for execution. Traders typically choose one of three entry methods based on their risk tolerance, followed by strict rules for entry points and targets.
6.1. Entry Methods (Choose Your Style)
Deciding exactly when to pull the trigger depends on your trading personality, whether you prioritize getting in at the best price or waiting for a confirmation candle.
| Entry Style | Trigger Point | Risk Level | Best For |
| Aggressive | Break of Hammer’s High | High | Catching the full move |
| Standard | Candle Close (Green) | Medium | Most Traders |
| Conservative | Retest of 50% Wick | Low | Precision Traders |
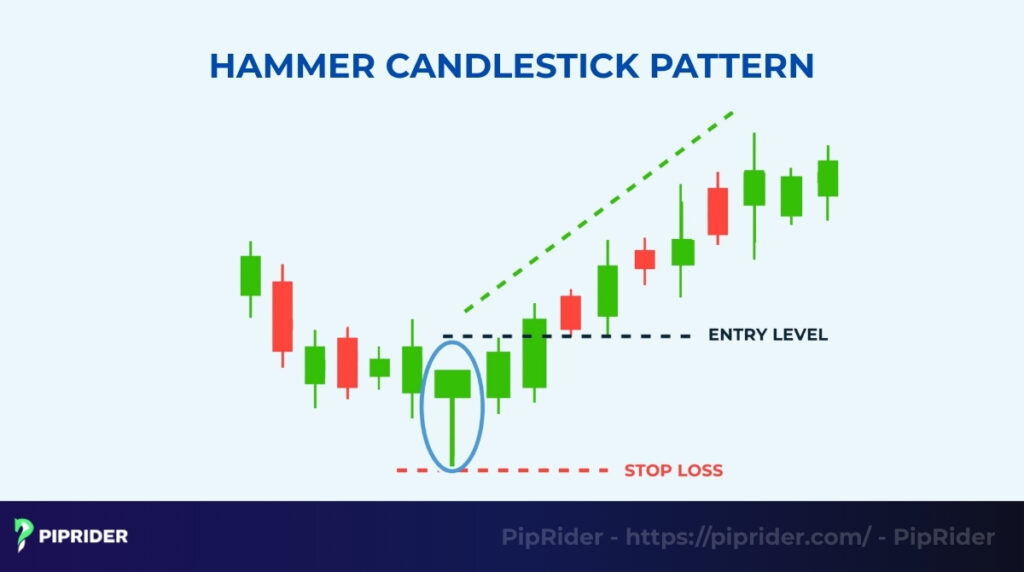
- The aggressive entry: Traders who want to catch the move early place a “Buy Stop” order just above the high of the hammer candle. As soon as the price breaks this level, the trade triggers. This gets you in early but carries the risk of a “fakeout” if the price reverses immediately.
- The standard entry (Confirmation): Most professionals prefer to wait. They only enter after the confirmation candle closes green (bullish). This confirms that buyers have officially taken control, though it may result in a slightly worse entry price.
- The conservative entry (Retest): Prices often pull back to test demand. Patient traders place a “Buy Limit” order near the 50% level of the hammer’s tail. This offers the best risk-reward ratio, but you risk missing the trade if the price shoots up without looking back.
6.2. Stop Loss Placement
Defining your risk is critical with the Hammer pattern because the long lower wick can sometimes require a wide stop. You need a placement that protects your capital with a proper stop-loss order without getting stopped out by normal market noise.
- Below the low: The classic placement is just 2-3 pips below the lowest point (the tail) of the hammer. If sellers manage to push the price below this tail, the hammer has failed, and you must exit.
- ATR-based stop: If the market is very volatile (like Crypto), using a tight stop might get you swept out. In this case, calculate the Average True Range (ATR indicator) and place your stop-loss order 1x ATR below the Hammer’s low to give the trade room to breathe.
6.3. Take Profit Techniques
Exiting is often harder than entering. To avoid giving back profits when the trend eventually turns, successful traders use defined profit targets rather than guessing.
- Previous structure: Look left on the chart. The first target should be the most recent Swing High or a major resistance zone.
- Fibonacci targets: If the price breaks new highs, use Fibonacci level extensions (like the 1.272 or 1.618 levels) to find potential reversal points.
- Risk-to-reward ratio: If you don’t see clear resistance, use math to determine your profit targets. Aim for a target that is 2 or 3 times your risk. For example, if your stop loss is $10 away, your take profit should be $20 or $30 away.
7. What Are the Best Conditions for High-Probability Hammer Trades?
A Hammer pattern is only as good as its location. To filter out low-quality signals and find the “A+” setups, professional traders look for specific confluence factors. The more of these conditions you have, the higher your probability of success.
7.1. Support Zones / Demand Zones
Location is the single most important filter. A Hammer that forms “in thin air” is dangerous. You want to see the pattern form exactly on a major support zone or a fresh demand zone. This historical evidence proves that buyers are stepping in at a price level they have successfully defended in the past.
7.2. Oversold RSI / Bullish Divergence
Momentum indicators help confirm that the sellers are exhausted. Look for oscillators like the RSI (Relative Strength Index) to be in oversold territory (below 30). Even better is bullish divergence, where the price makes a lower low (the Hammer’s tail), but the RSI makes a higher low. This disagreement suggests the selling pressure is losing power.
7.3. EMA Confluence (20/50 EMA)
In a strong uptrend, price often pulls back to the “mean.” A high-probability setup occurs when a Hammer forms right as price touches the 20-period or 50-period Exponential Moving Average (EMA). The EMA acts as a dynamic floor, adding institutional weight to the reversal signal.
7.4. Volume Spike Confirmation
Volume is the fuel that drives the reversal. A valid hammer candlestick pattern should ideally be accompanied by a significant spike in trading volume (higher than the previous 5-10 candles). This indicates “Stopping Volume”, a climax event where a massive amount of shares changed hands, signaling a transfer from panic sellers to smart money buyers.
7.5. Trendline and Fibonacci Confluence
Using trendlines and Fibonacci levels adds another layer of precision. A hammer that forms exactly on an upward trendline and the 61.8% Fibonacci retracement level is one of the most reliable setups in trading.
8. What Do Real Hammer Chart Examples Look Like?
Theory is important, but seeing the pattern in action on a messy, real-time chart is the best way to learn. Here are three examples across different markets.
8.1. Forex Example (EUR/USD)
In the Forex market, Hammers often appear on the 4-Hour chart during session reversals. Imagine the EUR/USD pair has been dropping for two days, approaching a major psychological support level like 1.1000. Sellers try to push it lower to 1.0980 but are quickly rejected, closing the candle back up at 1.1005.
This long wick confirms the rejection. A trader recognizes this signal and enters a buy trade on the next candle’s open, successfully riding the reversal for a 50-pip gain back to the daily average.
8.2. Stock Market Example (Apple / AAPL)
Stocks often form Hammers on the Daily chart after a multi-week correction. For instance, Apple stock might pull back to its 50-day Moving Average. It opens lower and drops sharply intraday but rallies into the close to finish near the high of the session.
This “bounce” off the Moving Average confirms that institutional investors are stepping in to defend the trend. A swing trader buys the stock the next morning with a stop loss below the Hammer’s low, capturing the next leg of the bull run.
8.3. Crypto Example (Bitcoin / BTC)
Crypto markets are prone to high volatility, so hammers here often have extreme wicks due to liquidity sweeps. Consider a scenario where Bitcoin crashes quickly from $40,000 to $38,000 in a “flash crash.”
The crash is bought up aggressively, leaving a massive wick behind as the candle closes near its high on huge volume. This “V-shaped” recovery signals that the dip has been bought. Price stabilizes and rallies back to $40,000 within hours, rewarding traders who trusted the rejection signal.
9. What Are Common Mistakes When Trading the Hammer Pattern?
Even with a reliable pattern like the hammer candlestick pattern, traders often lose money by ignoring the market context or practicing poor risk management. Avoiding these common traps will significantly improve your win rate.
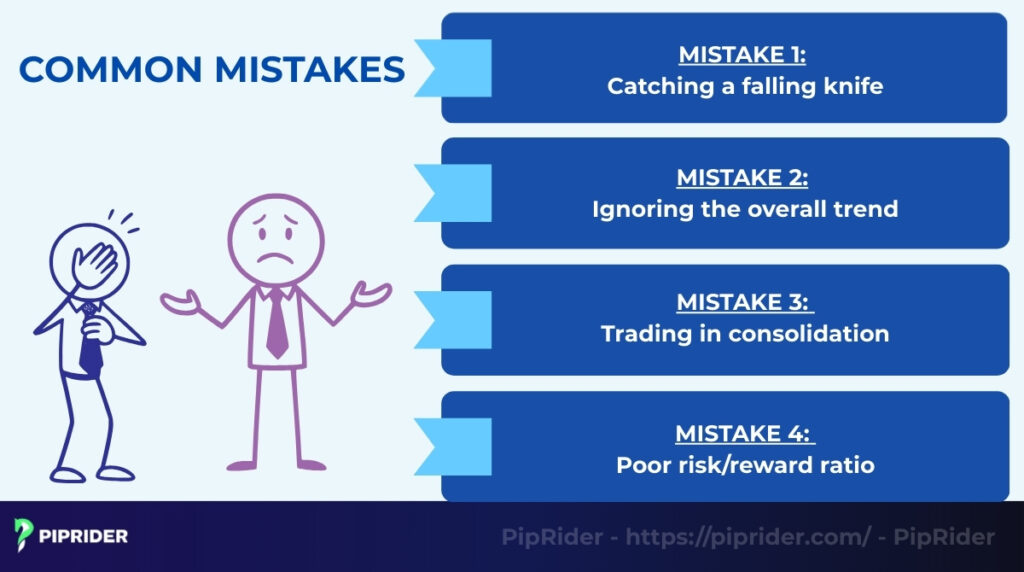
- Catching a falling knife: Buying a Hammer before the confirmation candle has actually closed is a dangerous habit. Sometimes, a candle looks like a perfect hammer during the session but crashes in the final minutes to close as a big red bearish candle. Always wait for the close!
- Ignoring the overall trend: A hammer on a 5-minute chart is meaningless if the daily trend is crashing down hard. Trying to trade a small reversal pattern against a massive institutional trend often leads to being stopped out.
- Trading in consolidation: Hammers are reversal patterns, which means there must be a trend to reverse. If you see a hammer shape in the middle of a sideways choppy range, it is likely just random noise and should be ignored.
- Poor risk/reward ratio: Sometimes the hammer’s tail is extremely long. If the tail is huge, placing your stop loss below it might force you to take a very small position size or accept a poor risk/reward ratio. In these cases, it is often better to wait for a pullback rather than buying immediately.
10. Which Tools Can Automatically Detect the Hammer Pattern?
Spotting hammers manually across dozens of charts is time-consuming. Modern trading platforms offer automated tools to detect these formations instantly, ensuring you never miss a setup.
- TradingView (Built-in Scanner): You don’t need complex code. Simply add the built-in indicator called “All Candlestick Patterns.” In the settings, select “Hammer,” and the software will automatically label every valid Hammer on your chart in real-time.
- MT4/MT5 (Custom Indicators): MetaTrader requires custom tools. You can download “Candlestick Pattern Scanners” from the MQL5 marketplace. These indicators can monitor multiple currency pairs at once and send push notifications to your phone when a Hammer forms.
- FinViz & TrendSpider (Market Screeners): If you want to find stock ideas, use a screener. Finviz (free) has a “Signal” filter where you can select “Hammer.” TrendSpider (paid) uses AI to detect the pattern with higher accuracy, filtering out low-quality shapes.
11. Frequently asked questions about the Hammer Candlestick Pattern
Traders often have questions about reliability and timing. Here are the answers to the most common questions about the Hammer pattern.
12. Conclusion
The Hammer Candlestick Pattern is one of the simplest yet most effective reversal signals in trading. However, its true power is unlocked only when it appears at a key support zone and is confirmed by volume or RSI divergence. This alignment transforms a standard setup into a high-probability trade.
To build long-term success, do not rely on the pattern alone. Always backtest your strategy and use multi-timeframe analysis to verify the trend before entering. Ready to master market reversals? Explore the comprehensive trading guides and strategies at Piprider today.