Learning how to trade earnings is a high-risk, high-reward skill focused on capturing the extreme volatility that occurs around a company’s quarterly financial report. Traders aren’t just looking at the profit (EPS) or revenue; they are betting on the market’s reaction to this news. This guide details the specific strategies for trading before and after the announcement, the key data points to watch, and the critical risk management needed to survive the gaps.
Key Takeaways
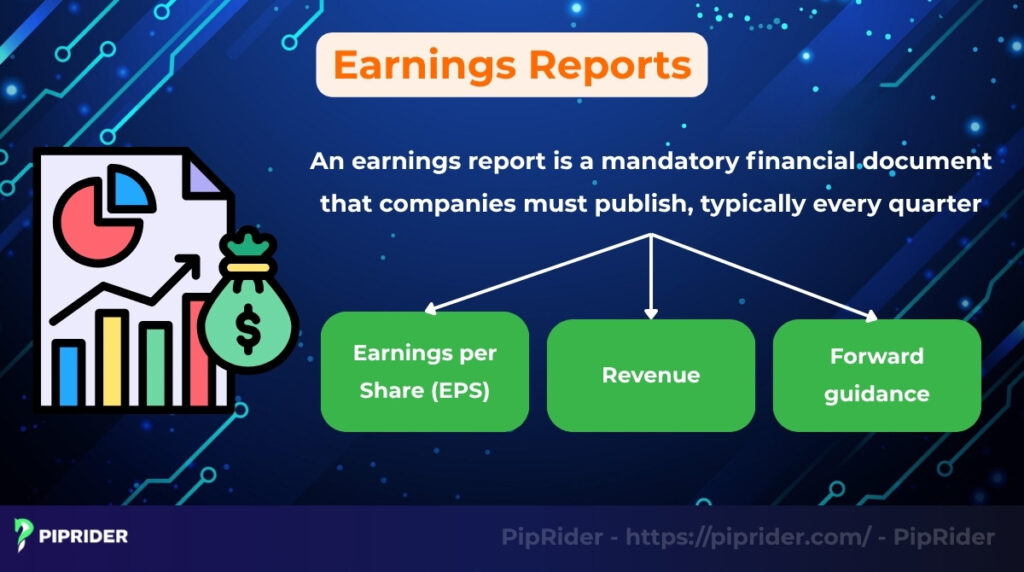
- Earnings reports detail quarterly profit (EPS), revenue, and (most importantly) future guidance.
- The market’s reaction hinges on the “surprise”, the difference between actual results and analyst estimates.
- Strategies involve trading the pre-report momentum or the post-report price gap.
- This is extremely high-risk due to unpredictable volatility and “IV crush” in options.
- Strict risk management (small position sizes, defined stops) is essential for survival.
1. What Are Earnings Reports?
According to the U.S. Securities and Exchange Commission (SEC), public companies are required to file Form 10-Q to provide a continuing view of their financial position. This report is often released as a press release followed by the official filing, acts as a report card on its financial performance.
For traders, the market’s reaction hinges on three key components, often presented in both GAAP (standard) and non-GAAP (adjusted) terms:
- Earnings per Share (EPS): The company’s net profit divided by the number of available stock shares. It is the single most-watched indicator of profitability. Investors also scrutinize cash flow.
- Revenue: The total amount of money the company generated from sales during the quarter, often comparing it to the previous fiscal year.
- Forward guidance: The management’s official forecast for the next quarter or year. Often, this forward-looking statement moves the stock price more than its past results. A strong cash flow statement is also vital.
These reports are released during a specific period known as earnings season. As noted by FINRA, this season typically kicks off one to two weeks after the quarter ends, clustering in January, April, July, and October (usually starting with major banks).
2. Why Does Earnings Season Matter for Stock Traders?
Earnings season is critical for traders because it creates predictable spikes in volatility, liquidity, and volume. For many, an earnings report is a binary event. These reports act as a powerful catalyst, offering distinct short-term trading opportunities that are not present during normal market conditions.
- Volatility spikes: Earnings surprises can cause dramatic overnight price gaps (5-20%+), creating clear short-term trading opportunities.
- Increased liquidity and volume: Increased liquidity and volume: Trading volume surges on and after the report. Knowing how to identify liquidity is crucial here, as this influx allows traders to execute larger orders with tighter spreads (the gap between buy and sell prices).
- Rapid sentiment shifts: The report can instantly change market perception, leading to impulse reactions that define earnings season sentiment regimes, either reinforcing an old trend or starting a new one based on good or bad news.
- Prime time for options traders: High pre-earnings Implied Volatility (IV) allows for strategies like straddles or iron condors to profit from the large price move or the subsequent “IV crush.”
3. The Pre-Earnings Checklist: 4 Steps to Survival
Successful preparation isn’t just about reading news; it’s about quantifying risk. Before placing any trade, run through this 4-step checklist to ensure you aren’t gambling blind.
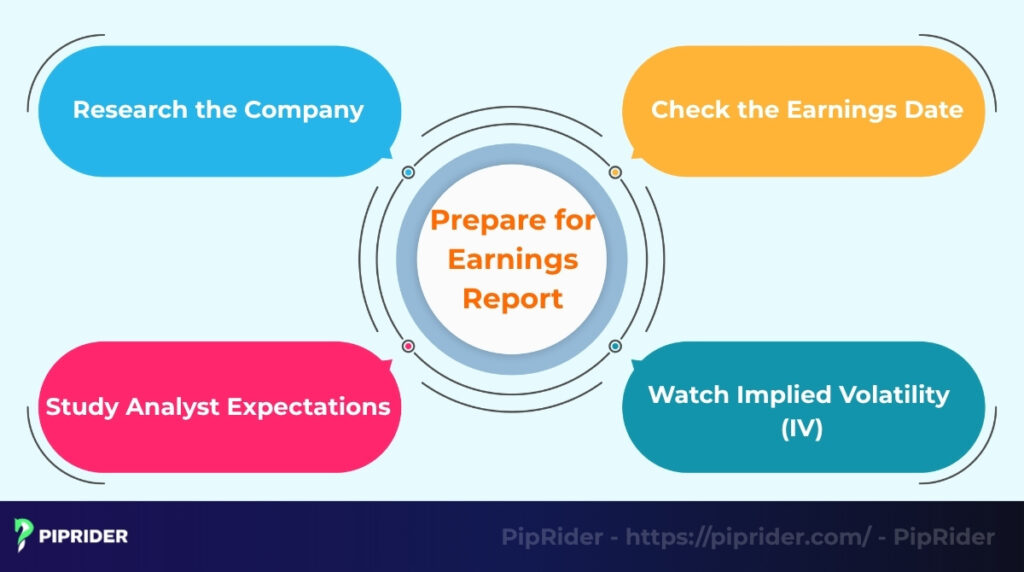
3.1. Confirm Logistics: Date, Time, and “When to Enter”
The exact timing dictates your strategy. A mistake here means missing the move entirely.
- The Date: Verify the confirmed date using a reliable calendar (e.g., Nasdaq or Earnings Whispers).
- The Time (BMO vs. AMC):
- BMO (Before Market Open): The volatility hits at 9:30 AM EST. You must position yourself the day before.
- AMC (After Market Close): The volatility hits at 4:05 PM EST. You have the entire trading day to position yourself.
3.2. Know the “Bar”: Consensus vs. Guidance
The stock price doesn’t react to “good” or “bad” results; it reacts to whether the company cleared the “bar” set by expectations.
- Consensus Estimates: The official Wall St. average for EPS and Revenue.
- The “Whisper” Number: Often, traders expect more than the official consensus. If a company beats the official number but misses the “whisper,” the stock might still drop.
- Forward Guidance (Crucial): This is the game-changer. Even if a company reports record profits today, if they issue a weak forecast for the next quarter, the stock will likely tank.
3.3. Check the Context: Technical Trend & The “Run-Up”
Never trade earnings in a vacuum. Look at the D1 (Daily) chart.
- The Run-Up: Has the stock already rallied significantly (e.g., +10%) in the last week anticipating good news? If so, the good news might already be “priced in,” leading to a “Sell the News” event.
- Key Levels: Identify the nearest Support and Resistance levels. These are your targets if the price gaps up or down.
3.4. Analyze Volatility: IV Rank & Expected Move
This is the most critical step for options traders. You must answer: “Is the market panicking too much, or not enough?”
- Check IV Rank: This metric tells you if Implied Volatility (IV) is high relative to its own history.
- IV Rank > 50%: Options are expensive (Better for selling strategies like Iron Condors).
- IV Rank < 50%: Options are cheap (Better for buying strategies like Straddles).
Don’t guess. Calculate exactly what the market is “pricing in” right now.
The Strategy: Compare this “Implied Move” with the stock’s average “Historical Move” (last 4 quarters).
-
🟢 Buy Premium (Straddle): If Implied Move (e.g., $5) < Historical Move (e.g., $10).
(Market is underestimating the move → Cheap Options). -
🔴 Sell Premium (Iron Condor): If Implied Move (e.g., $15) > Historical Move (e.g., $5).
(Market is fear-mongering → Expensive Options).
4. How to Trade Earnings with the Best Trading Strategies?
Navigating earnings season demands a playbook that matches your risk tolerance and instrument choice. Whether you are trading Stocks/CFDs or Options, strategies generally fall into two camps: speculating on the direction (Bullish/Bearish) or capitalizing on the volatility (Big Move/No Move).
Below are the 5 best strategies, categorized by timing:
- Pre-Earnings: Capitalizing on anticipation momentum (Strategy 4.1).
- During Earnings: Managing the event risk (Strategy 4.2).
- Post-Earnings: Reacting to the confirmed price action (Strategy 4.3).
- Options Volatility: Using defined-risk structures (Strategy 4.4 & 4.5).
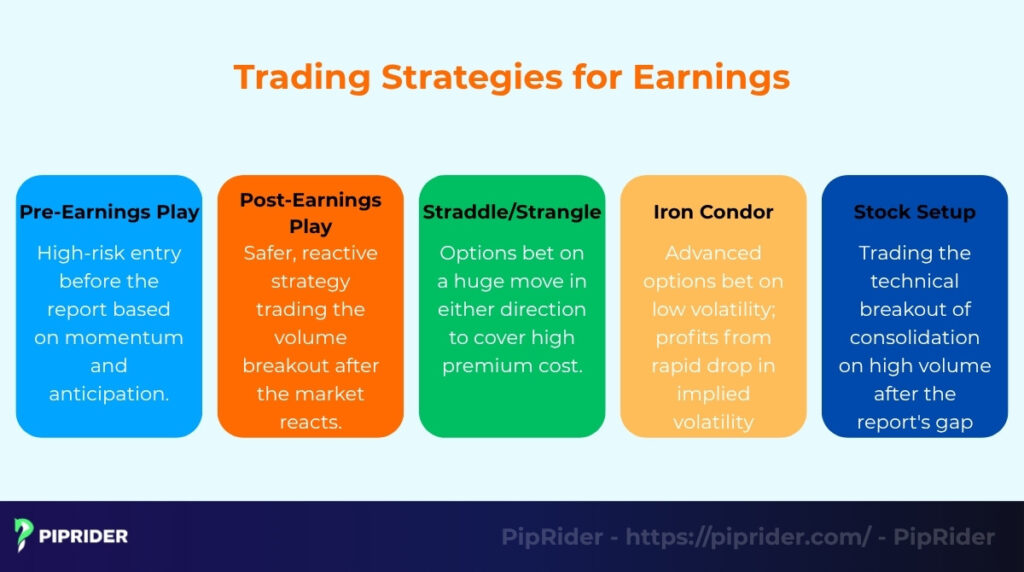
4.1. Pre-Earnings Momentum (The “Run-Up” Play)
The “Run-Up” strategy targets the buying pressure that often builds days before a highly anticipated report. Institutional investors frequently accumulate positions early if they expect strong guidance, driving the price higher.
- The Execution: Enter a position 1–3 days before the scheduled earnings release if the technical trend is clearly bullish.
- The “Hard” Exit Rule: You MUST close the position before the market closes on the day of the announcement.
- Why It Works: Capturing the anticipation trend allows you to profit from the “rumor” while stepping aside before the unpredictable “Event Risk” (Gap Risk) occurs. This approach strictly follows the safety rule: “Avoid Overnight Holds.”
4.2. Holding Through Earnings (Advanced Only)
Carrying a trade through the exact moment of the announcement exposes the account to “Binary Risk.” A surprise miss can cause the stock to gap down 10–20% instantly. Even if you understand how to calculate stop loss for normal market conditions, an earnings gap will often bypass your order entirely (Slippage).
- The Warning: Most beginners should avoid this method entirely.
- The Advanced Rule: If you insist on holding through the event, standard risk management is insufficient. You must modify the plan:
- Drastically Reduce Size: Cut the position size by 75% (e.g., trade 0.25 lots instead of 1.0) to survive a potential gap.
- Switch to Options: Use Defined-Risk Options strategies (like a Long Straddle or Iron Condor). With options, the maximum loss is limited to the premium paid, even if the stock price collapses to zero.
4.3. Post-Earnings Reaction (The “Gap” Strategies)
Strategies focusing on post-earnings reactions avoid guessing the outcome. Instead, traders wait for the market to “show its hand” during the first 15–30 minutes of the session, trading one of two distinct patterns:
A. The “Gap & Go” (Bullish Continuation)
A “Gap & Go” scenario unfolds when the earnings surprise is genuine, prompting buyers to aggressively defend the new higher price levels.
- The Setup: The stock opens significantly higher (gaps up) relative to the previous close.
- The Rule: Price action remains ABOVE the Opening Range Low and holds above the VWAP (Volume Weighted Average Price). Heavy volume on green candles confirms institutional buying.
- The Entry: Buy when the price breaks above the High of the Day (HOD) established in the first 30 minutes. Place the Stop-loss below the VWAP.
B. The “Gap Fill” / Fade (Reversal)
A “Gap Fill” or Fade develops when the initial gap represents an emotional overreaction, and the market lacks the conviction to sustain the higher valuation.
- The Setup: The stock gaps up but immediately stalls, creating long upper wicks (rejection) or failing to extend higher.
- The Rule: Price breaks back BELOW the Opening Range Low and loses the VWAP level. Such weakness indicates that sellers have seized control.
- The Entry: Short the breakdown. The profit target is the “Gap Fill” level (the Closing Price of the previous trading day).
4.4. Options Strategy – Straddle & Strangle (The “Big Move” Play)
Straddles and strangles are strategies for traders who expect a massive price explosion but are unsure of the direction (Up or Down).
- Long Straddle: As defined by Fidelity, this strategy involves buying both a Call and a Put option at the same strike price and expiration date. It is designed to profit from a significant move in either direction.
- Long Strangle: This involves buying a Call and a Put at different strike prices (e.g., Out-of-the-Money). This is cheaper to buy but requires an even larger price move to become profitable.
The “Breakeven” Trap: Getting the direction right is not enough. Because you are buying expensive volatility (High IV) before the report, the stock price must move significantly just to cover the cost of both options.
Example: If you pay $5.00 for a Straddle on a $100 stock, the price must rise above $105 or fall below $95 for you to make a profit. If it lands at $104, you lose money despite the bullish move.
4.5. Iron Condor Strategy (The “IV Crush” Play)
An Iron Condor is a neutral strategy used when you believe the market’s fear is exaggerated.
- The Logic: You are not betting on “zero volatility.” Instead, you are betting that the Realized Move (what the stock actually does) will be smaller than the Implied Move (what the market priced in).
- The Mechanism (IV Crush): According to Option Alpha, IV acts like a balloon inflating before earnings due to uncertainty. Once the news is out, that uncertainty vanishes, causing IV to collapse instantly—a phenomenon known as ‘IV Crush’.
Use this when the Implied Move > Historical Move. (Basically, you are selling “overpriced insurance” to fearful traders when the math suggests the actual move won’t be that scary.)
5. How Do You Analyze the Price Reaction After Earnings?
Traders analyze the post-earnings reaction by confirming price gaps with high volume, watching key technical levels for support or resistance, and comparing the stock’s move to the broad market index. This helps determine the true strength and conviction behind the move.
5.1. Gap and Volume Confirmation
A strong price gap up or down is the first signal, but it requires high volume for confirmation. A gap that forms on low volume is often untrustworthy and may be a false breakout or “gap trap.” True conviction moves, whether bullish or bearish, are almost always accompanied by a significant spike in trading volume compared to the average.
5.2. Technical Levels to Watch
After the initial gap, the price will often test specific technical levels. Pay close attention to:
- Previous highs/lows: Will a gap-up move clear a major prior high, or will a gap-down break a key prior low?
- Major Moving Averages: The 200-day or 50-day EMA (Exponential Moving Average) often acts as a significant level of support or resistance.
- Volume profile levels: High-volume nodes (price levels where significant trading occurred in the past) can also act as magnets or barriers for the price.
5.3. Compare to Market Index (SPX, QQQ)
It’s essential to check if the stock is moving on its own news or just following the overall market. Analyze the price action relative to the index. Ask: Is the stock gapping up while the entire market (like the S&P 500 – SPX or Nasdaq 100 – QQQ) is also rallying? A stock showing strength despite a weak market index is a much stronger bullish signal, and vice versa.
5.4. Critical Check: After-Hours vs. Regular Session
Not all price moves are created equal. You must distinguish between the initial knee-jerk reaction in the after-hours market and the true market sentiment established during the regular session.
- The “Thin” Move (After-Hours/Pre-Market): Most extreme volatility often happens immediately after the report is released (e.g., 4:05 PM EST). However, liquidity is thin, leading to wide bid-ask spreads and bad slippage. The price action here is easily manipulated by small orders and is often misleading.
- The “Real” Move (Regular Session): True price discovery begins at the 9:30 AM EST Open when institutional volume floods the market. This is when mutual funds and hedge funds adjust their massive positions.
- The Rule: Always trust the move that holds during the regular session (supported by the high volume mentioned in Section 5.1) over a pre-market spike that fades at the open.
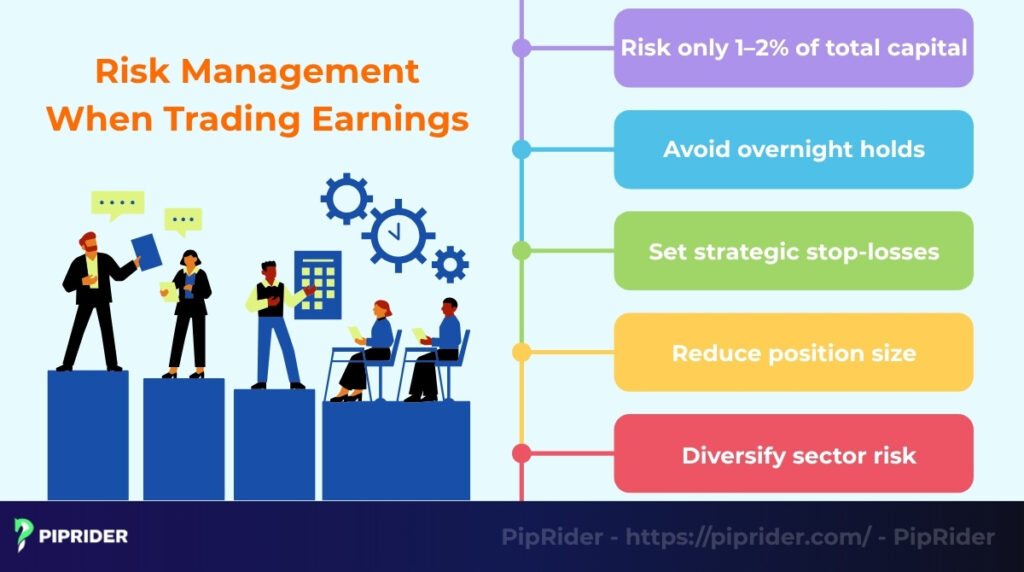
6. Risk Management Strategies: How to Protect Your Capital
Earnings volatility is a double-edged sword: it creates profit opportunities but can also wipe out an account in minutes. To survive, you must apply different rules based on your experience level.
6.1. The Beginner Protocol (Safety First)
If you have been trading for less than 2 years, your primary goal is Capital Preservation.
- The “No Overnight” Rule: Never hold a position through the earnings announcement. You cannot predict the reaction, and you cannot react if the price gaps against you while the market is closed.
- Trade the Reaction Only: Use Strategy 4.3 (Post-Earnings Gap). Wait for the news to come out, let the market digest it, and enter during the regular session when liquidity is high.
- Sector Isolation: Do not trade multiple companies in the same sector simultaneously (e.g., AMD and NVDA). A bad report from one often drags the other down.
6.2. The Advanced Protocol (Managed Exposure)
Experienced traders who choose to hold positions through the event (Strategies 4.4 & 4.5) must accept “Binary Risk.”
- Use Defined-Risk Options: Never buy or sell raw stock. Use Spreads (Iron Condors, Vertical Spreads). This ensures that even if the stock price goes to zero, your maximum loss is mathematically capped at the spread width.
- The “25% Size” Rule: Because volatility is extreme, you must reduce your standard position size by 75%. If you normally trade 10 lots, trade 2.5 lots during earnings.
6.3. The “Stop-Loss” Myth (Critical Warning)
Placing a standard Stop-Loss order will not save you during an earnings release.
If you hold a stock overnight at $100 with a Stop-Loss at $95, and the bad news causes the stock to open the next morning at $80:
- Your Stop-Loss is triggered at the first available price ($80), not $95.
- Result: You lose $20 per share, not the $5 you planned. This is called Slippage.
👉 Solution: The only way to prevent this overnight is by using Options (Defined Risk) or being flat (Cash) before the close.
6.4. The 1% Rule
Regardless of your strategy, never risk more than 1–2% of your total account balance on a single earnings trade. If you have a $10,000 account, your maximum loss (calculated via option premium or stop distance) should never exceed $200.
7. What Are the Most Common Mistakes Traders Make?
The most common mistakes when learning how to trade earnings often stem from poor preparation or emotional reactions. These errors can lead to significant losses.
- Gambling on FOMO: Entering a trade just before the announcement out of a “Fear of Missing Out” is not a strategy. It’s a pure gamble that exposes your position to a massive, unpredictable overnight gap.
- Ignoring “IV Crush”: This costly options mistake occurs when the implied volatility (IV) collapses after the news. The resulting “crush” in the option’s premium can cause a loss, even if the price moved in the expected direction.
- Blindly following analysts: Relying 100% on analyst forecasts while ignoring the technical chart is a trap. The market’s reaction to the news is what matters, not just the news itself.
- Trading without data or volume: Every trade needs confirmation. Avoid trading a post-earnings move without checking the stock’s historical reactions or waiting for high volume to confirm the price gap.
8. What Does an Example of Trading Apple (AAPL) Earnings Look Like?
Putting theory into practice requires a structured thought process. Instead of blindly guessing, a professional trader analyzes the consensus data and implied volatility to construct a scenario.
Below is a hypothetical case study for Apple (AAPL) to demonstrate how to identify an opportunity and—more importantly—the risks of “IV Crush.”
🧪 Hypothetical Case Study: Apple (AAPL)
Note: The figures below (EPS, Revenue, IV) are illustrative only and used to demonstrate the mechanics of the strategy. They do not reflect current market data.
The Scenario: Apple is set to report earnings, and the market is nervous.
- 🔹 Consensus Forecast: EPS $1.50 / Revenue $90B.
- 🔹 Implied Volatility (IV): Spikes to 50% (Market expects a huge move).
- 🔹 The Setup: You buy a Long Straddle because you expect a breakout.
Even if Apple beats the EPS estimate ($1.60 vs $1.50), if the stock price only moves 2%, you might lose money.
Why? Because after the news, IV drops from 50% to 20% instantly. This “crush” deflates the value of your options faster than the small price move can profit.
9. What Are the Best Tools and Resources for Earnings Trading?
Trading earnings without accurate data is essentially gambling. To gain a statistical edge, professional traders rely on three specific categories of tools: Calendars (for timing), Volatility Scanners (for pricing), and Backtesting Platforms (for strategy validation).
9.1. Best Earnings Calendars (Planning Phase)
You need more than just a date; you need to know the specific time (BMO/AMC) and the market sentiment.
- Earnings Whispers: Widely considered the “Gold Standard” for earnings traders. Unlike basic calendars, it provides the “Whisper Number”—the unofficial expectation among traders, which is often more accurate than Wall Street’s consensus.
- Nasdaq.com: The official source for confirmed release dates and regulatory filings. Use this to verify data if other sources show conflicting times.
9.2. Volatility & IV Trackers (Analysis Phase)
For options traders, knowing the Implied Volatility (IV) Rank is mandatory to decide between buying or selling premiums.
- MarketChameleon: A specialized tool for analyzing historical earnings behavior. It answers the critical question: “How much does this stock usually move compared to what the market predicted?”
- OptionStrat: An excellent visualizer for building strategies. It helps you see exactly where your “Breakeven” zones are and how “IV Crush” will affect your Profit & Loss (P&L).
9.3. Backtesting & Charting (Simulation Phase)
Never risk real capital on a setup you haven’t tested against past market conditions.
- TradingView: The best platform for technical analysis. Use the “Earnings” icon on charts to visually inspect past price gaps and determining if a stock typically “fills the gap” or continues the trend.
- Thinkorswim (OnDemand): A feature within the TD Ameritrade platform that allows you to “rewind” time. You can replay past earnings reports tick-by-tick to practice your execution without financial risk.
⚠️ Important Data Warning: Free websites often delay price quotes by 15–20 minutes. While tools like Earnings Whispers are perfect for researching the night before, always use your broker’s platform for execution to ensure you are trading on real-time data.
10. Frequently asked questions about Trade Earnings
11. Conclusion
Trading earnings offers significant profit potential but comes with exceptionally high risk. Success in this field is not based on luck; it requires a deep understanding of the company’s fundamentals, the ability to read the data correctly (comparing actuals to analyst estimates), and strict control over emotions, leverage, and risk management.
Learning how to trade earnings effectively means combining this fundamental analysis with technical trading patterns. Ready to continue your trading journey? Explore our full library of expert guides on strategy and risk management at Piprider to sharpen your knowledge.