Learning how to trade indices means you are speculating on the performance of an entire group of stocks (like the S&P 500 or NASDAQ 100) in a single trade, rather than just one company. Most retail traders use CFDs (Contracts for Difference) to get exposure to these markets, often using leverage.
This guide provides a complete introduction to what indices are and the different ways you can trade them (CFDs, ETFs, Futures). Moreover, Piprider also covers the basic strategies and risk management rules you need to know to get started.
Key Takeaways
- An index (like the S&P 500 or NASDAQ 100) is a “basket” of stocks that measures a market sector’s or country’s overall performance.
- Traders use indices for diversification. It allows you to trade your view on the whole economy with one position.
- The most common way for beginners to trade indices is with CFDs (e.g., symbols like US100 for NASDAQ or US500 for S&P 500).
- Simple strategies and strong risk management are essential for beginners.
- The main risk is leverage. CFDs and futures use leverage, which can amplify both your potential profits and your potential losses.
1. What Are Indices and How Do They Work?
A stock index (or “market index”) is a financial tool that measures the collective performance of a group of stocks. Instead of tracking just one company, an index like the S&P 500 (US500) tracks 500 of the largest U.S. companies. This allows you to trade the entire market with a single position.
An index’s price is a “weighted” average. This weighting determines which companies have the biggest impact:
- Market-cap weighted: Most indices, like the S&P 500 and NASDAQ 100, give more power to companies with a larger market capitalization (e.g., Apple, Microsoft).
- Price-weighted: A few, like the Dow Jones (US30), give more power to stocks with higher share prices, regardless of the company’s actual size (S&P Dow Jones Indices, n.d.).
The main difference between trading an index and a single stock is diversification. A single stock (like Tesla) can collapse from one bad news report. An index (like the NASDAQ 100) holds 100 stocks, so the failure of one company is buffered by the other 99. This is why indices often have smoother price movements and represent the entire market’s sentiment, not just one company’s drama.
2. What Are the Most Popular Indices to Trade?
While there are hundreds of indices, most trading professionals focus on a few major national indices known for their high liquidity and clear personalities. Each index represents a different part of the global economy and is most active during its specific market session.
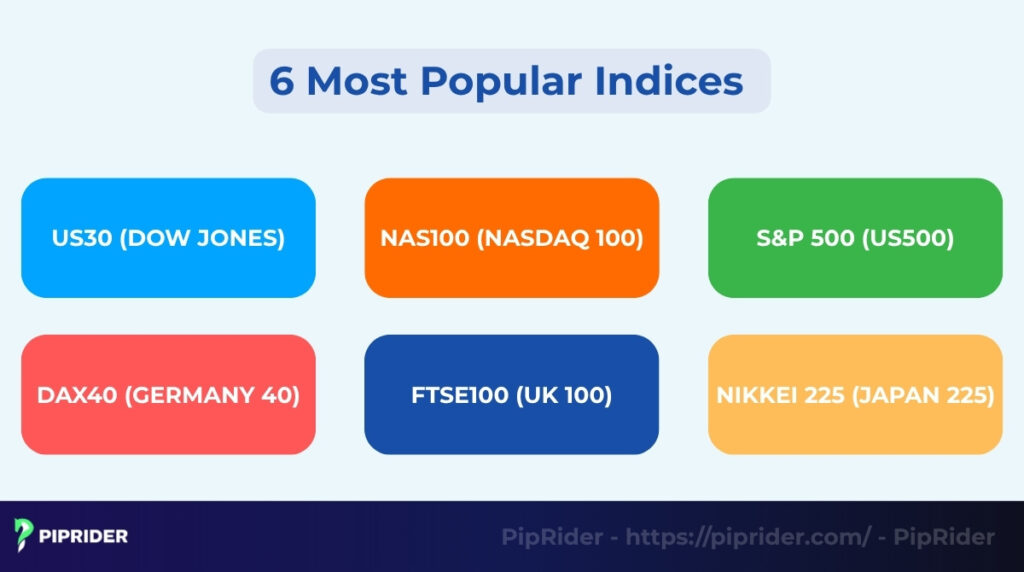
Here is a quick comparison of the most popular indices:
| Index Name | Common CFD Symbol | What It Represents | Trader Profile | Best Session to Trade |
|---|---|---|---|---|
| S&P 500 | US500, SPX500 | Top 500 US Companies (Broad Market) | All-rounders, Beginners | US Session (New York) |
| NASDAQ 100 | US100, NAS100 | Top 100 US Tech & Non-Financials | Volatility & Tech Traders | US Session (New York) |
| Dow Jones | US30, DJ30 | 30 US Blue-Chip Industrials | Stable Trend Traders | US Session (New York) |
| DAX 40 | DE40, GER40 | 40 Major German Companies | European Session Traders | European Session (Frankfurt) |
| FTSE 100 | UK100 | 100 Major UK Companies | UK-focused Traders | European Session (London) |
| Nikkei 225 | JP225, JPN225 | 225 Major Japanese Companies | Asian Session Traders | Asian Session (Tokyo) |
2.1. S&P 500 (US500): The Market Benchmark
Often called the market benchmark, the S&P 500 (US500) is the most-watched index in the world. It tracks 500 of the largest US companies, offering the broadest snapshot of the entire US economy. As an excellent all-around index, it’s popular with both beginners and pros. It sees the most volume and volatility during the US session.
2.2. NAS100 (NASDAQ 100): The Tech Index
The NAS100 (NASDAQ 100) is the go-to index for technology. It tracks the 100 largest non-financial companies on the NASDAQ, meaning it’s packed with giants like Apple, Microsoft, and NVIDIA. This index is perfect for traders who want high volatility and follow the tech sector. It’s most active during the US session, particularly around tech earnings, making a specialized guide to trading NAS100 essential for mastering its unique price action.
2.3. US30 (Dow Jones): The Blue-Chip Index
The US30 (Dow Jones) is a blue-chip index tracking 30 of the largest, most established industrial and financial companies in the United States (like Boeing and Goldman Sachs). Traders who prefer more stable, established trends often look for a detailed manual on how to trade the Dow index, as the US30’s highest volatility occurs during the US session, especially right at the New York open.
2.4. DAX40 (Germany 40): The German Powerhouse
For traders active in the European session, the DAX40 (Germany 40) is the most popular choice. It tracks the 40 largest German companies, with a heavy focus on industrial and automotive brands (like Volkswagen and Siemens). Its volatility peaks at the Frankfurt and London session open.
2.5. FTSE100 (UK 100): The UK Benchmark
The FTSE100 (UK 100) represents the 100 largest companies on the London Stock Exchange, giving a good view of the UK economy. It’s heavily weighted toward banking, energy, and mining sectors. This index is a good choice for traders focusing on UK news, and its main activity is during the London session open.
2.6. Nikkei 225 (Japan 225): The Asian Leader
The Nikkei 225 is the primary index for Japan, tracking 225 top companies on the Tokyo Stock Exchange. It is a key indicator for the Asian session. Notably, its price often has a strong inverse correlation with the value of the Japanese Yen (JPY), making it a favorite for macro traders active during Tokyo trading hours.
3. What Are the Different Ways to Trade Indices?
You cannot buy an index directly. Instead, you get market exposure by trading its value using different financial products. The most common methods are CFDs, futures, ETFs, options, and spread betting. Each product works differently and is designed for a specific type of trader.
Here is a simple comparison:
| Method | Best For | Leverage | Complexity |
|---|---|---|---|
| CFDs | Day Traders / Beginners | Yes | Low-Medium |
| ETFs | Long-Term Investors | No | Low |
| Futures | Pro / High-Volume Traders | Yes | High |
| Options | Advanced Strategists | Yes | Very High |
| Spread Betting | UK Traders | Yes | Low-Medium |
3.1. CFDs (Contract for Difference)
CFDs are the most popular method for retail day traders. A CFD is an agreement with a broker to exchange the difference in an index’s price from the moment the trade is opened to when it is closed.
- Main Feature: Leverage. It allows you to control a large position (e.g., $5,000 of NAS100) with a small margin deposit (e.g., $250).
- Note: While leverage can magnify profits, it also increases the risk of rapid capital loss.
3.2. Futures
Index Futures are standardized contracts traded on regulated exchanges like the CME. Unlike CFDs, futures have set expiration dates and are primarily used by high-volume professional traders (CME Group, n.d.).
Pro Tool: Traders use contracts like “E-mini” or “Micro E-mini” (e.g., ES for S&P 500). Futures pricing is highly transparent but involves specific exchange fees, clearing fees, and margin requirements.
3.3. ETFs (Exchange-Traded Funds)
ETFs are funds that you buy and sell just like a regular stock on an exchange. An index ETF (like the SPY for the S&P 500) actually holds the underlying stocks of that index.
Best For: Long-term investors and swing traders. Standard ETFs typically do not use leverage, allowing you to hold positions for weeks or years without daily financing costs.
3.4. Options on Indices
Index Options give you the right, but not the obligation, to buy or sell an index value at a pre-set price before a specific date.
- Key Concept: Professionals use them for hedging or making high-leverage bets with a fixed risk (the Premium paid).
- The Challenge: They are complex due to Time Decay (Theta)—the contract’s value decreases daily as it approaches expiration.
3.5. Spread Betting
Popular in the UK and Ireland, spread betting is a tax-efficient way to speculate on market movements. CFDs vs spread betting work similarly, where you are not buying the asset but are betting a certain amount of money per “point” of the index’s movement (either up or down).
Important: Regardless of the method you choose, each carries unique “hidden costs” and contract mechanics. We will break down these crucial details in the next section.
4. What Moves Index Prices?
Index prices are moved by “big picture” economic events, company performance, and overall investor sentiment, which is key for index trading.
- Economic news: The most powerful short-term movements are caused by major economic data releases, especially CPI (inflation), NFP (jobs), FOMC (interest rate decisions), and GDP reports.
- Earnings seasons: Indices are made of stocks. Strong or weak company financial results (earnings) from major “heavyweight” companies (like Apple or Microsoft) can cause the entire NAS100 or S&P 500 to move significantly.
- Interest rates & Fed policy: The single most important driver is interest rate policy. Higher rates are generally bad for indices, while lower rates are good. All markets react strongly to FOMC announcements (Investopedia, n.d.).
- Market Sentiment (Risk-On/Risk-Off): Investor feeling is a key driver. When investors are fearful (“Risk-Off”), they often sell indices and buy “safe” assets like the US Dollar. To analyze this visually, traders use Index Heatmaps to see which specific sectors (like Tech or Banking) are driving the entire index’s performance. Understanding these forex and index correlations is vital for anticipating how currency fluctuations might impact your positions.
- Global events: Large-scale events can cause major trading volatility, including geopolitical conflicts, an oil crisis, or unexpected waves of inflation.
5. How Do You Analyze Indices Before Trading?
A successful trade is based on a plan, not a guess. Before trading, professionals analyze the market using three main types of analysis: fundamental, technical, and volatility.
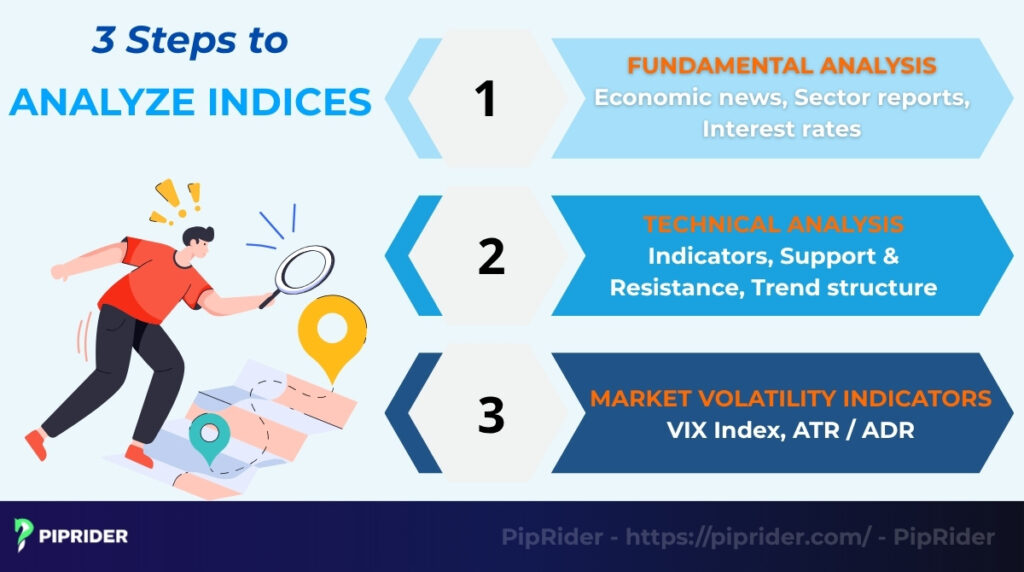
5.1. Fundamental Analysis
Fundamental analysis looks at “big picture” economic health to determine the long-term direction. This includes:
- Economic news: Is the economic data (like CPI or NFP) better or worse than expected?
- Sector reports: How is the overall industry doing? (e.g., are tech companies growing or shrinking?)
- Interest rates: Are interest rates rising (which is bad for indices) or falling (which is good for indices)?
5.2. Technical Analysis
Technical analysis involves reading the chart to find patterns and clear entry/exit points. Beyond basic indicators, professional index traders use volume-based tools to see where the “big money” is moving.
- Core Indicators: Using tools like EMAs (EMA20/50) to define the market trend and RSI or MACD to measure momentum and exhaustion.
- Volume & Market Profile: Volume shows how much trading is happening, while Market Profile shows at what price the most volume was traded. These tools help you find strong support/resistance zones based on actual institutional activity.
- VWAP (Volume-Weighted Average Price): This is a critical intraday indicator, especially during the US session. Many pros use it as a “line in the sand”: if the price is above VWAP, sentiment is bullish; if below, it is bearish.
- Support & Resistance: Finding key price “floors” and “ceilings” where the price has historically reacted.
5.3. Market Volatility Indicators
Volatility analysis helps you understand how much the market is likely to move, which is the “secret sauce” for setting an effective stop-loss.
- The VIX Index: Often called the “Fear Index,” a high VIX signals that investors are nervous and high volatility is expected (Encyclopedia Britannica, n.d.). When the VIX spikes, indices often drop sharply.
- ATR / ADR: The Average True Range (ATR) or Average Daily Range (ADR) tells you the average number of points an index moves in a single day.
- Pro Tip: Use 1x or 1.5x the ATR to set your stop-loss. This ensures your “exit” is outside the normal market “noise” and won’t be hit by minor price fluctuations.
6. How to Trade Indices: A Step-by-Step Guide
A successful trade follows a clear 5-step process. This framework helps you move from analysis to trading execution while managing your risk.
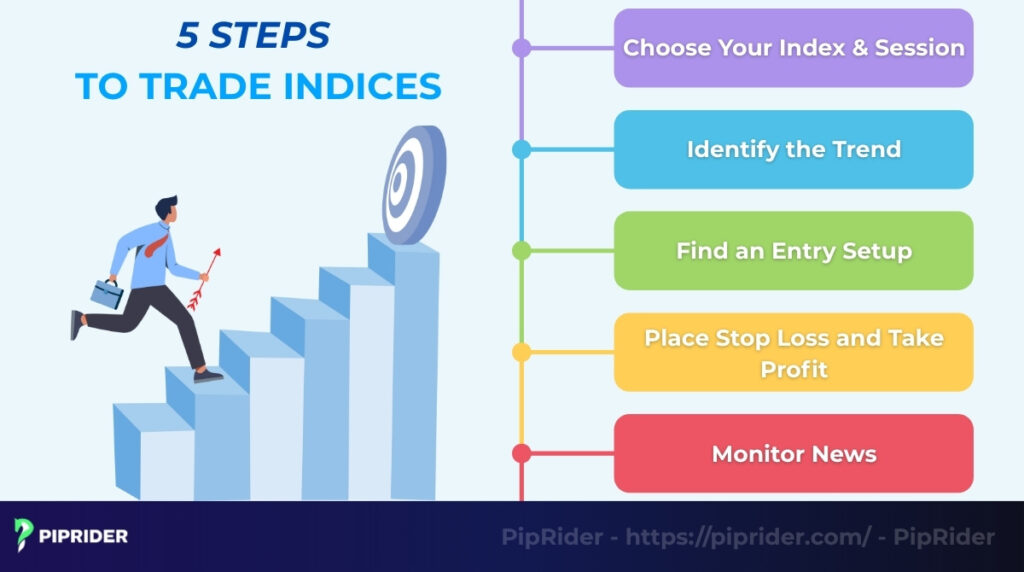
6.1. Step 1: Choose Your Index & Session
First, choose an index that matches your trading schedule. Trade an index when its home market is open and volatility is high.
- The NAS100 (US Tech) is most volatile during the US session.
- The DAX40 (Germany) is most volatile during the London/Frankfurt session.
6.2. Step 2: Identify the Trend
Second, never trade “blind.” You must identify the main trend. A simple way is to use the 50-period EMA (Exponential Moving Average) on a 1-hour or 4-hour chart.
- If the price is above the EMA50, the trend is up (look for buys).
- If the price is below the EMA50, the trend is down (look for sells).
- You should also check the market structure (is the price making higher highs or lower lows?). Mastering these techniques to identify stock market trends will help you filter out noise and focus on high-probability setups.
6.3. Step 3: Find an Entry Setup
Third, once you know the trend, find your entry setup. Do not just buy or sell randomly. Wait for a clear signal that matches your strategy:
- Breakout: The price breaks above a key resistance level (to take a long position in an uptrend).
- Pullback: The price pulls back to a support level (like the EMA50) within an uptrend.
- Reversal: The price hits a major support or resistance zone and shows a strong reversal signal (to take a short position).
6.4. Step 4: Place Stop Loss and Take Profit
Fourth, before you enter, you must define your exits.
- Stop Loss (SL): Set your SL based on volatility (like 1x the ATR) or just below the last swing low (for a buy).
- Take Profit (TP): Set your TP (often as a limit order) at a level that gives you a Risk/Reward (R:R) ratio of at least 1:2. A good target is the next major supply or demand zone.
6.5. Step 5: Monitor News
Finally, always check the Economic Calendar before and during your trade. If you are an experienced trader, you might trade the news spikes. However, if you are a beginner, do not hold a position right before high-impact events like the FOMC or NFP. Always use an Economic Calendar to identify these events early, as the resulting volatility can be extreme and move past your stop-loss.
7. What Are the Best Strategies for Index Trading?
Professional traders rarely rely on complex indicators. Instead, they use simple, repeatable systems tailored to the unique characteristics of indices—such as their inherent long-term bullish bias and massive session-specific liquidity.
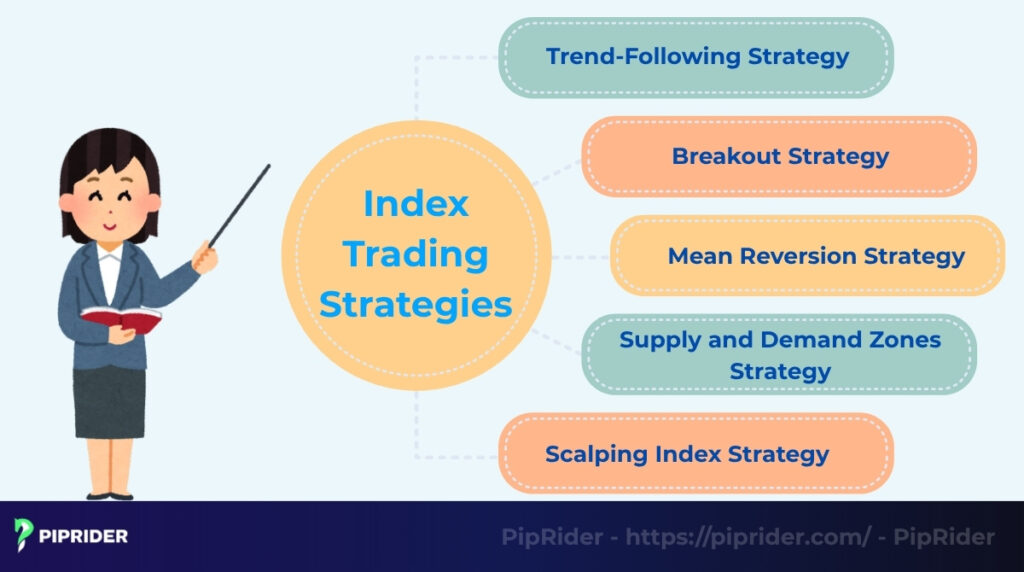
7.1. The Trend-Following Strategy
Trend-following remains the most reliable approach for beginners because major indices like the S&P 500 tend to trend more consistently than volatile currency pairs.
- The Setup: Use the EMA 20 and EMA 50 (Exponential Moving Averages) to identify the dominant market direction.
- The Entry: In a confirmed uptrend, wait for the price to pull back (dip) to the EMA, which acts as a dynamic support level.
- Pro Insight: The trend-following method is most effective when the M15 trend aligns with the H4 timeframe, ensuring you aren’t trading against the “big money” flow.
7.2. The Breakout Strategy
Indices are famous for explosive moves during the first hour of the market open. The Breakout strategy capitalizes on this surge in institutional participation.
- The Setup: Identify the “US Open Range”—the high and low established during the first 30 minutes of the New York session.
- The Entry: Enter a trade in the direction of the break (e.g., Buy if the price breaks above the 30-minute high).
- Confirmation: Breakouts often look cleaner with increased market participation. However, be aware that the “volume” indicator on a standard retail CFD chart only reflects that specific broker’s tick activity, not the true global market. To confirm a genuine breakout with real volume, professional traders monitor the actual Index Futures contracts (such as ES for the S&P 500, NQ for the NASDAQ, or YM for the Dow Jones) or rely on market internals.
7.3. The Mean Reversion (Countertrend) Strategy
Mean reversion assumes that if an index moves too far, too fast, it must eventually “snap back” to its average value.
- The Setup: Look for the price to be “overextended” beyond its Average Daily Range (ADR) or touching the outer Bollinger Bands.
- The Entry: Use RSI divergence (where price makes a new high, but RSI makes a lower high) as a signal of momentum exhaustion. The Mean Reversion approach works best during sideways markets or after a major news event has been fully absorbed.
7.4. The Supply and Demand Zones Strategy
Indices react heavily to institutional levels where significant buy or sell orders were previously executed. The Supply and Demand strategy targets these areas of “imbalance.”
- The Setup: Identify a fresh “Demand” or “Supply” zone on the H1 or H4 charts where a rapid price expansion originally began.
- The Entry: Wait for the price to return to the zone and look for a rejection candle (like a pin bar or engulfing pattern). This zone-based entry is particularly effective for high-volume indices like the US30 and DAX40.
7.5. The Scalping Index Strategy (M1–M5)
Scalping is a high-speed strategy used to capture many small moves during peak volatility windows.
- The Setup: Scalpers utilize momentum tools like the VWAP indicator (Volume-Weighted Average Price) or Order Blocks to find high-probability entries.
- Critical Warning: The scalping model requires extreme discipline and a broker with ultra-low spreads. Because you are targeting small point gains, even a minor spread widening can turn a winning strategy into a net loss.
8. What Does a NAS100 Day Trade Example Look Like?
Here is a practical example that puts all the concepts together for a day trade on the NAS100 (NASDAQ 100) index.
| Component | Setup Detail |
|---|---|
| Session | US Open (High volatility) |
| Trend | Bullish (Price is trading above the H1 50-period EMA) |
| Strategy | Pullback to EMA20 (for a long position) |
| Entry | A “Buy” trade is taken after the price pulls back to and finds support at the 20-period EMA. |
| Stop Loss (SL) | Placed just below the most recent swing low. |
| Take Profit (TP) | Placed at the previous high. |
| R:R Target | The setup must offer at least a 1:2 Risk/Reward ratio. |
This trade is a high-probability setup because it aligns the session (US open volatility), the main trend (bullish), and a clear entry rule (pullback to EMA20) with good risk management.
9. Contract Specs & Hidden Costs (CFDs/Futures)
Before you place your first trade, you must understand the specific “mechanics” of the instrument you are trading. Failure to check the contract specifications is one of the fastest ways for beginners to lose capital rapidly.
9.1. Point Value and Contract Size
Unlike Forex, where a “lot” is heavily standardized, index contract sizes vary wildly between brokers. On some platforms, 1 lot of the NAS100 might mean $1 per point move, while on others, it could mean $10 or $100 per point.
- The Math Example: Imagine you buy 1 lot of US30. If the point value is $1 and the index moves 100 points, you profit/lose $100. However, if the point value is $10, that same 100-point move results in a $1,000 swing.
- The Golden Rule: Always check your broker’s “Contract Specifications” table. If you don’t know the “Point Value,” your risk management math will be wrong, leading to accidental overleveraging.
9.2. Spreads: The Immediate Cost
The spread is the difference between the Buy (Ask) and Sell (Bid) price. While indices often have competitive spreads during peak New York or London sessions, they can widen significantly during “off-hours” or major news events (like NFP or FOMC). Entering a trade with a wide spread means you start with a larger immediate loss.
9.3. Financing and Holding Costs
Trading isn’t just about the spread; you must account for the costs of keeping a position open:
- CFD Overnight Fees (Swaps): Brokers charge interest (swaps) for holding leveraged positions past the daily market close.
- Dividend Adjustments: This is a “hidden” cost/benefit. If you hold a Long (Buy) CFD position on an index, you may receive a dividend adjustment when a major company in that index pays out. Conversely, if you are Short (Sell), the dividend amount may be deducted from your account.
- Futures Expiry and Rollover: Futures contracts have expiration dates. To keep a position, you must “roll” it to the next contract, which may involve price adjustments and fees.
- ETF Expense Ratios: ETFs carry an annual management fee. While usually low, it can impact long-term returns.
9.4. Regulatory Warning (High-Risk Products)
The Financial Conduct Authority (FCA) explicitly warns that CFDs are complex instruments and come with a high risk of losing money rapidly due to leverage (FCA, n.d.). According to various regulatory studies, a vast majority of retail investor accounts lose money when trading CFDs. These products are not suitable for all investors; ensure you fully understand the mechanics of leverage before participating.
10. What Is Position Sizing and Risk Management for Indices?
Position sizing and risk management are the most important rules when learning how to trade indices. Because indices can move significantly in a single day, you must have a plan to protect your capital and limit your market exposure. This plan involves choosing the right position size for the index’s specific volatility and never risking too much on one trade.
10.1. Volatility Consideration
Not all indices are equal. You must adjust your risk based on the index’s personality. The NASDAQ 100 (NAS100) is famously volatile and can move very fast, making it high-risk. The S&P 500 (US500) is generally the most stable of the three, while the Dow Jones (US30) can experience large point swings due to its price-weighted structure. You should typically use a smaller position size for the NAS100 than you would for the US500.
10.2. Position Sizing: The Pro Formula
You should never “guess” your position size. Instead, use this 4-step mathematical approach to ensure you risk the exact same dollar amount on every trade, regardless of the index’s volatility.
The 4-Step Calculation:
- Account Risk ($): Account Balance × Risk % (e.g., $10,000 × 1% = $100)
- Stop Distance (Points): | Entry Price − Stop Loss Price | (e.g., 5,000 − 4,980 = 20 points)
- Point Value ($): The dollar value of a 1-point move for 1 contract.
- Position Size (Contracts/Lots): Account Risk / (Stop Distance × Point Value)
Practical Example: Imagine you are trading the S&P 500 (US500):
- Risk Amount: $100
- Stop Distance: 20 points
- Broker Point Value: $1 (meaning 1 contract gains/loses $1 for every 1-point move).
- Calculation: $100 / (20 points × $1) = 5 Contracts.
Crucial Warning on Broker Specs: Unlike Forex, index contract sizes are not standardized. On Broker A, 1 lot of NAS100 might be 1 contract ($1/point), but on Broker B, it could be 10 or 100 contracts ($10 or $100/point). Always verify the Point Value in your broker’s “Contract Specifications” or on a demo account before risking real capital.
10.3. Risk Per Trade
A professional trader typically adheres to the 1-2% rule. This means you should aim to never risk more than 1% or 2% of your total account balance on a single trade. For example, on a $1,000 account, a 1% risk is only $10. While following this rule dramatically reduces the chance of ruin, you must still be cautious. Market anomalies such as weekend gaps, sudden spread widening, or severe slippage (especially during major news events or the market open) can sometimes execute your stop-loss at a worse price than intended.
10.4. Avoid Overleveraging
Leverage is a tool that lets you control a large position with small capital, but it is a double-edged sword. When trading indices, it is easy to get stopped out by sudden volatility spikes or liquidity sweeps, especially when spreads widen during news releases or at the market open. Using excessive leverage is one of the most common and costly mistakes beginners make.
11. What Are the Most Common Mistakes When Trading Indices?
Most beginners make the same few trading traps. Knowing these traps is the first step to avoiding them.
- Trading during major news: Entering a trade 10 seconds before a big news event (like FOMC or NFP) is gambling, not trading. The volatility is extreme, spreads widen, and you can be stopped out instantly.
- Ignoring volatility (Tight stop-loss): Using a 20-point stop-loss on the NAS100 (which can move 20 points in seconds) is a common mistake. Your stop-loss must respect the index’s volatility (e.g., be based on the ATR); otherwise, it is too tight and will be hit by normal “noise.”
- Fighting the main trend: Trying to “short” (sell) a strong uptrend on the H4 or Daily chart is one of the hardest and most expensive ways to trade. It is much easier to trade with the Higher Timeframe (HTF) trend.
- Overtrading: Taking too many trades because you are bored, angry (revenge trading), or trying to “catch” every small move. A professional trader waits patiently for their one or two “A+” setups per day.
- Using a lot size that is too large: This is the #1 account killer. Using a large lot size (overleveraging) means a single trade that goes against you can wipe out a huge part of your account.
12. Frequently asked questions about Trading Indices
13. Conclusion
How to trade indices successfully requires a clear strategy, a deep understanding of the market, and disciplined risk management.
Indices are an excellent choice for traders looking for markets that are often liquid with competitive spreads during main sessions. However, it is vital to remember that volatility can spike significantly around news releases or the market open, requiring careful attention to stop-loss placement. To be successful, you must follow the main trend, trade during the correct high-volume session, and never overleverage your account.
To learn more expert trading strategies and improve your analysis, explore the free guides at Piprider.com.