
If you’ve ever felt overwhelmed staring at a trading chart cluttered with lines, especially as a beginner, you’re not alone. With hundreds of technical indicators available, it’s easy to fall into the trap of analysis paralysis. But the secret of professional traders isn’t using dozens of tools at once; it’s mastering a select few that work for their strategy.
In this guide, Piprider will cut through the noise. We won’t just list the best technical indicators; we’ll explain how they work in simple terms and help you build a clean, effective analytical process. Think of this as your essential roadmap to understanding what’s really happening on your charts!
Key Takeaways
- Technical indicators use past price/volume data to provide market insights, not guaranteed future predictions.
- Most indicators fall into Trend-Following, Momentum Oscillators, Volatility, or Volume categories, each serving a distinct purpose.
- Combining a few non-correlated indicators from different groups often yields stronger signals than relying on just one.
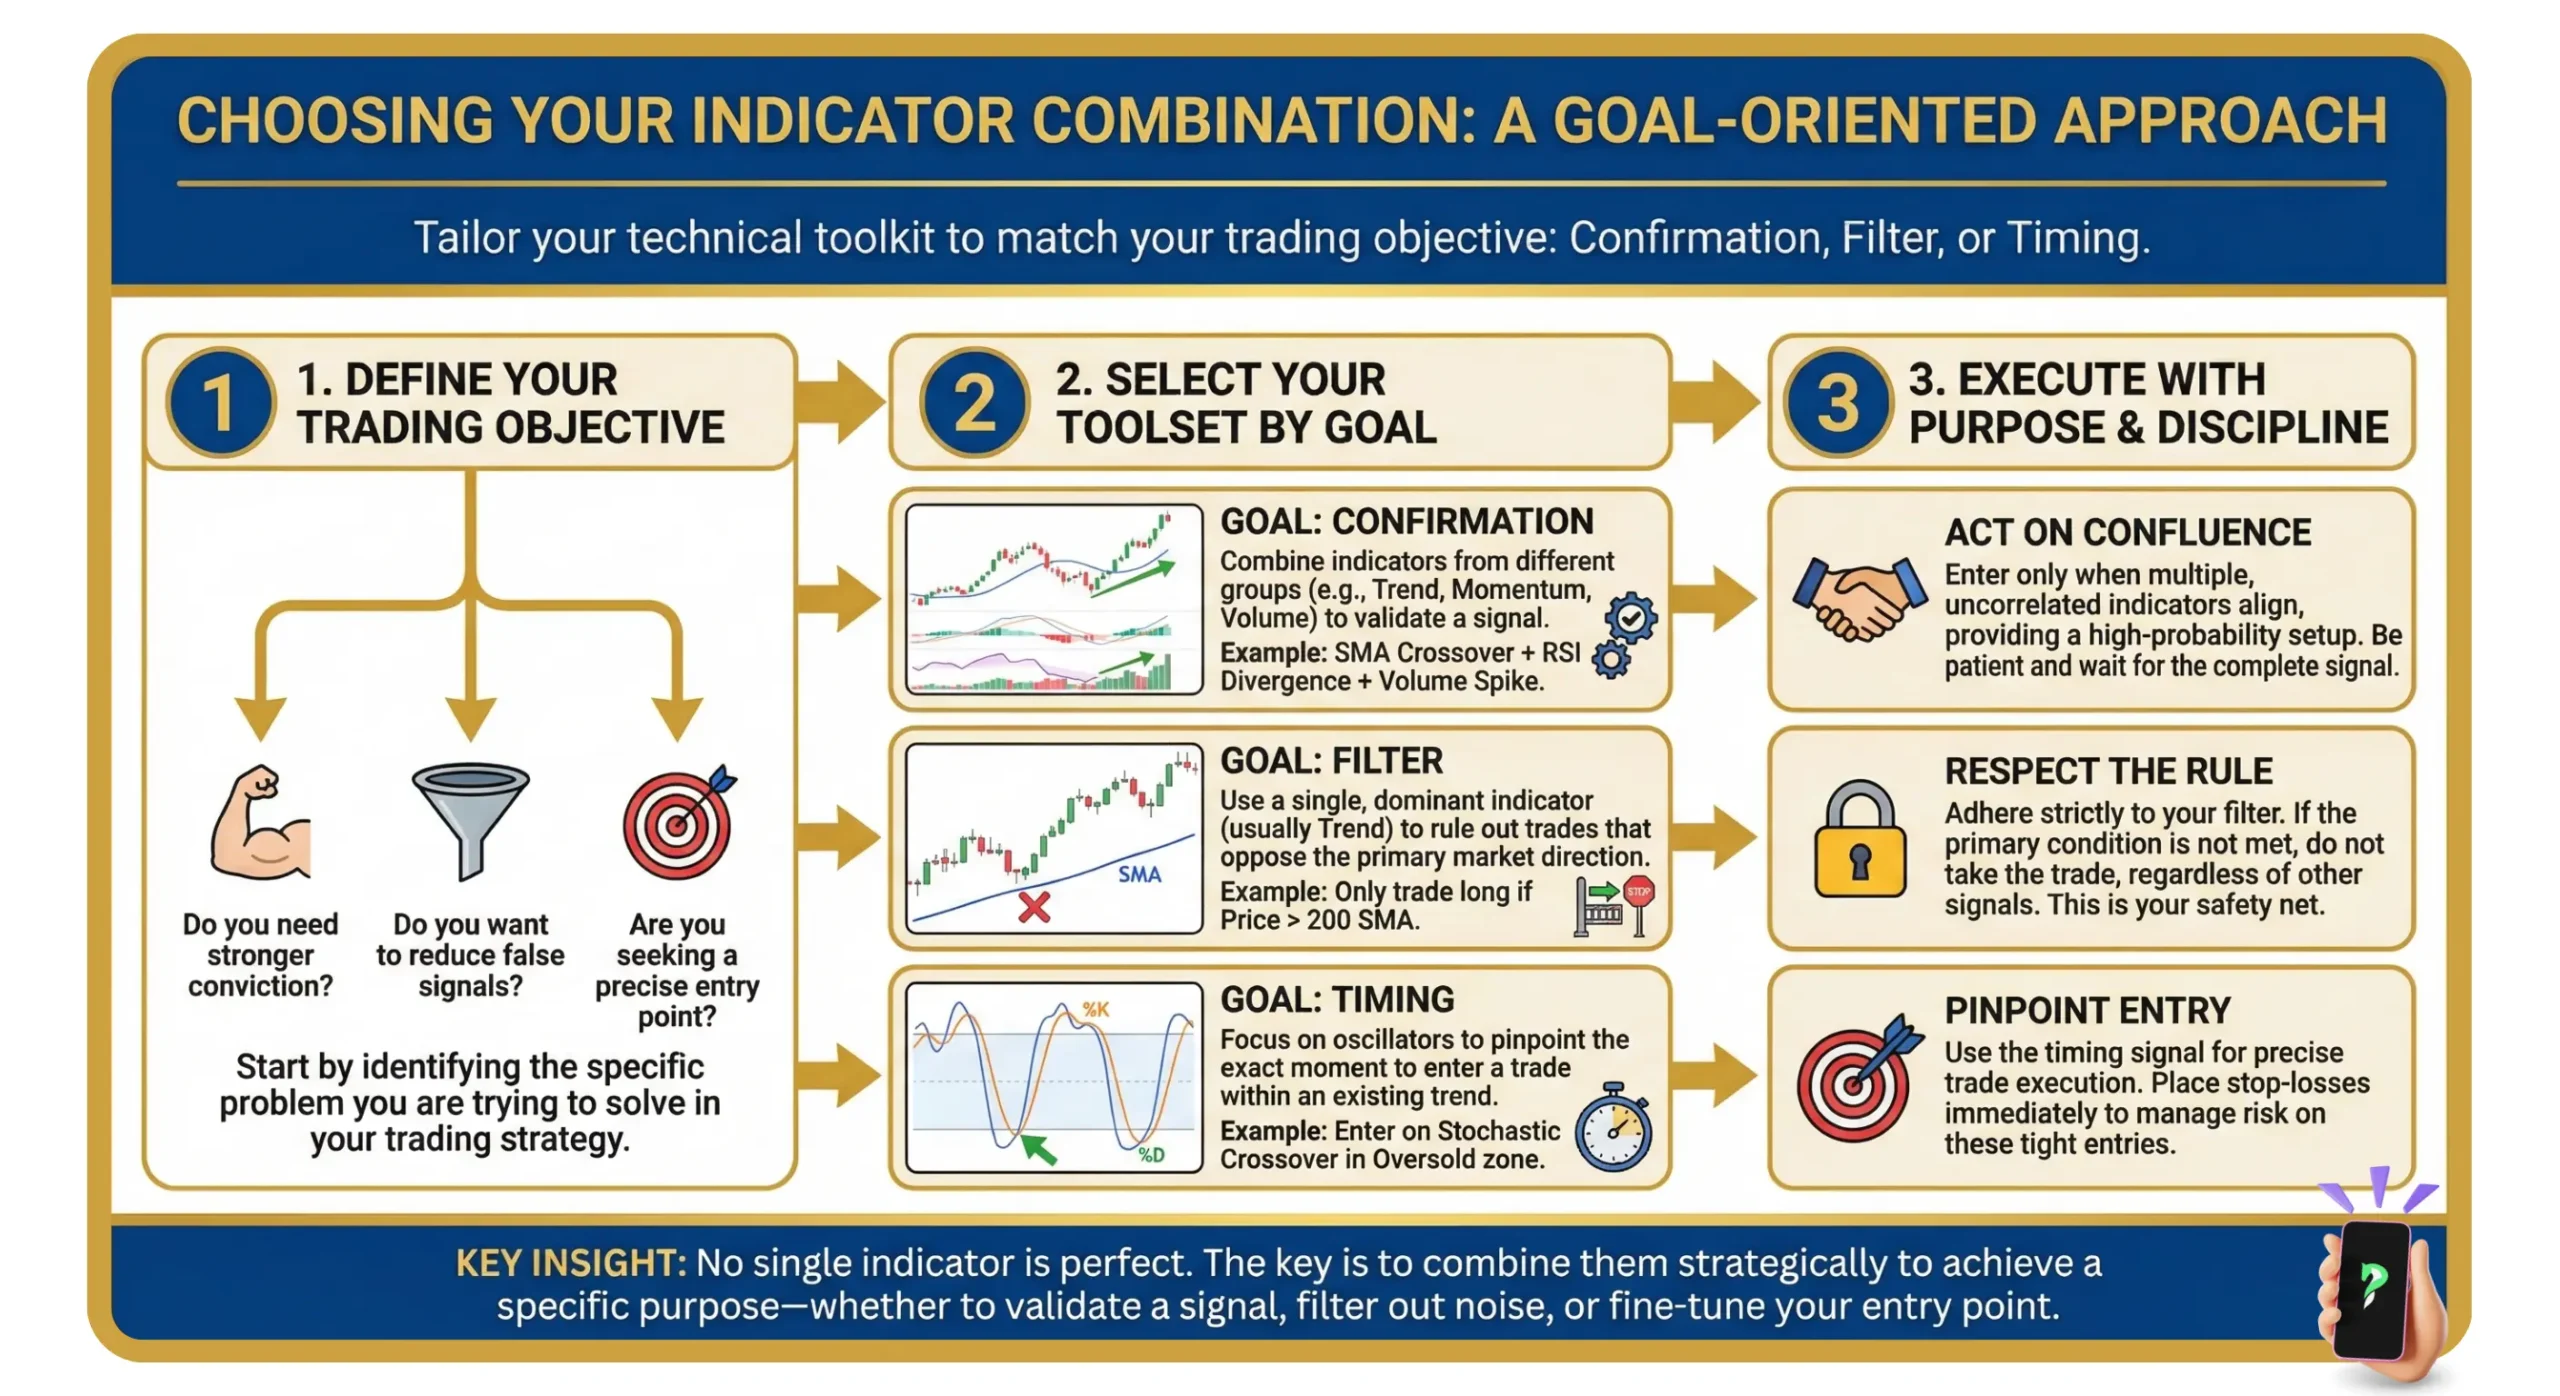
- Don’t overload charts with redundant indicators, always consider price action, and understand no single indicator is a “holy grail.”
- Professional trading relies on deeply understanding a few chosen indicators within a disciplined strategy, not using dozens superficially.
1. What is a technical indicator? – Basic definition
In essence, a technical indicator runs a mathematical calculation on historical price or volume data, transforming raw numbers into visual market clues.
Think of them less as predictive crystal balls and more as analytical co-pilots. Their job is to help you objectively assess market conditions by:
- Identifying the prevailing trend and its strength.
- Gauging the momentum behind price moves.
- Highlighting potential entry and exit zones.
- Understanding market volatility to manage risk.
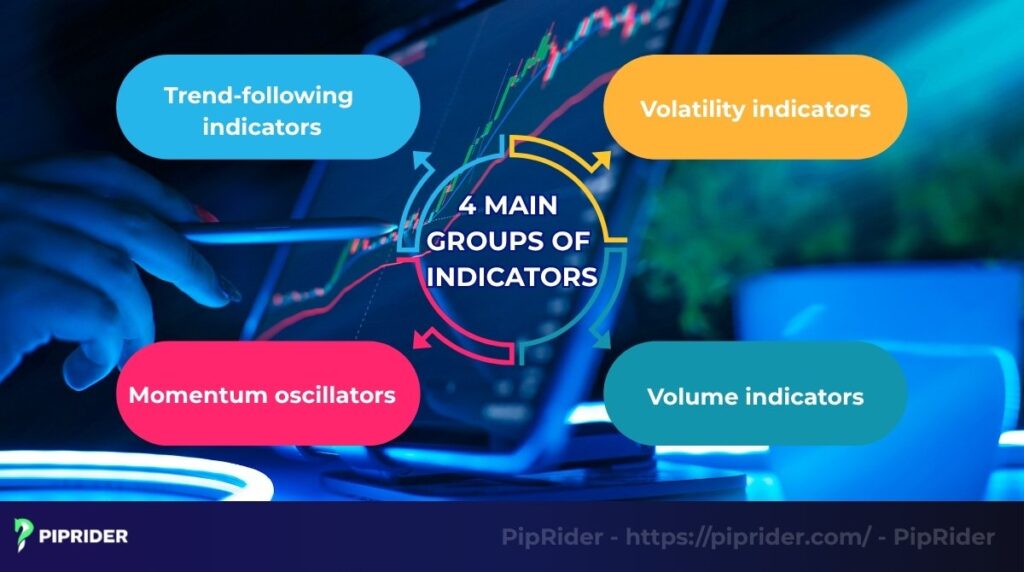
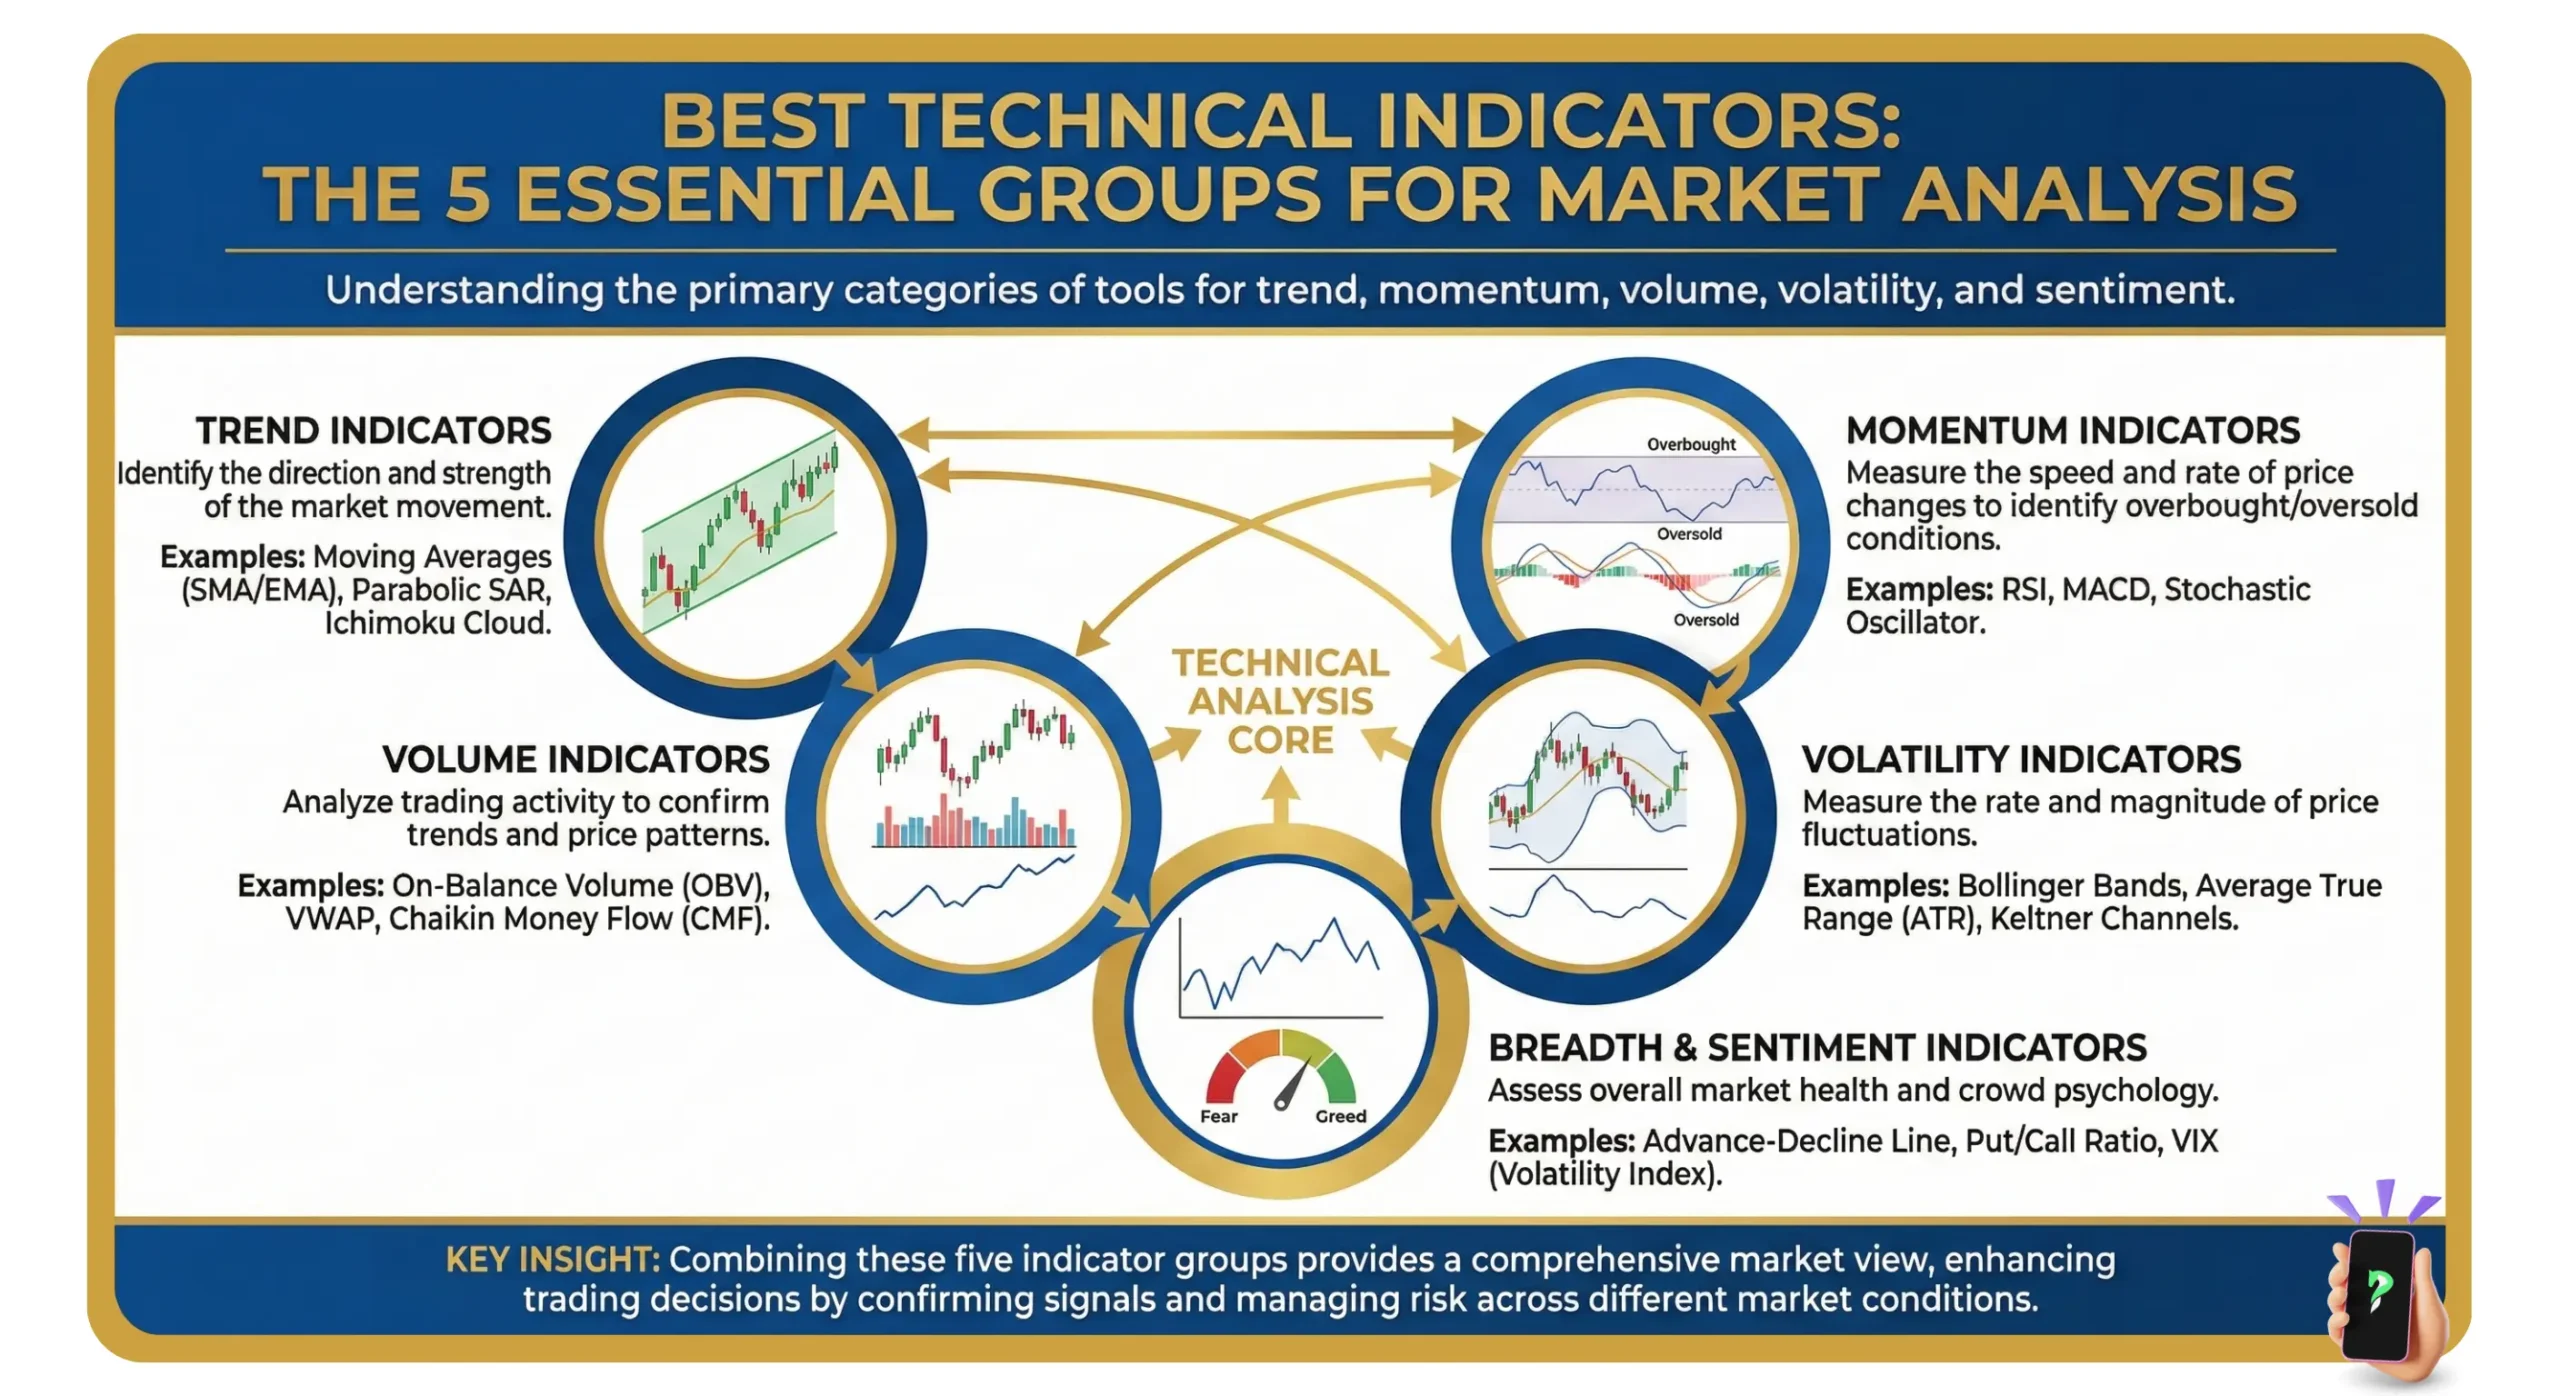
2. The 4 main groups of indicators: A simple classification
To build a coherent trading strategy, it helps to know that most indicators fit into one of four families. Each has a different job, and real insight comes from combining them thoughtfully.
- Trend-following indicators: Their sole purpose is to tell you which direction the market is heading.
- Momentum oscillators: These measure the speed and strength of price changes, often signaling when a market is overbought or oversold.
- Volatility indicators: These tell you how calm or explosive a market is, which is crucial for risk management.
- Volume indicators: These act as a lie detector, using trading volume to confirm whether a trend has real conviction behind it.
3. Top 15 best technical indicators for every strategy
Here are the top 15 technical indicators, clearly categorized into four main groups: Trend-Following Indicators, Momentum Oscillators, Volatility Indicators, and Volume Indicators, along with some important supplementary tools.
3.1. Trend-Following Indicators
These indicators are designed to help you identify the direction of the prevailing market trend, allowing you to trade in alignment with the market’s momentum.
3.1.1. Moving Average (MA)
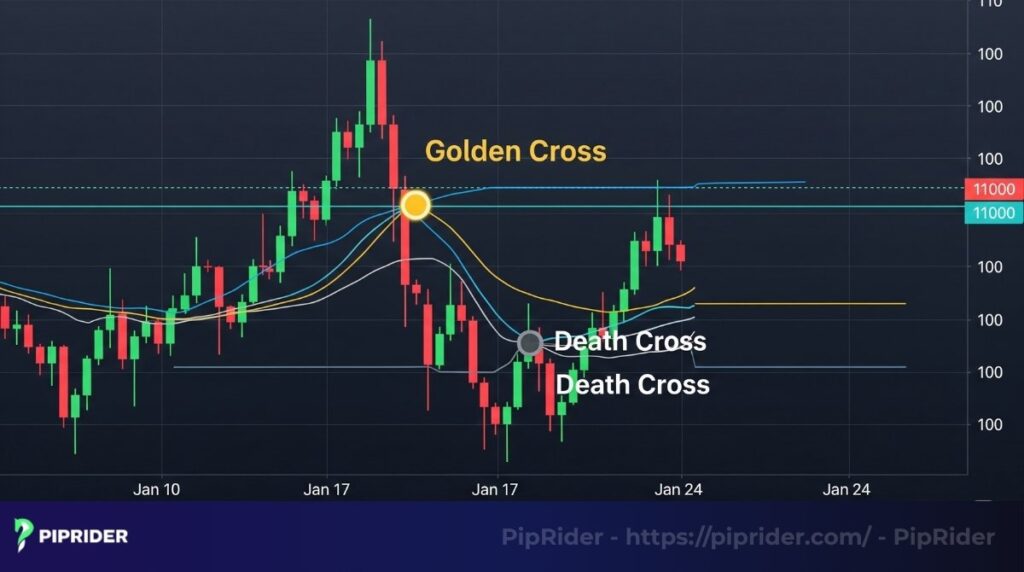
A Moving Average smooths out price data to create one clear, flowing line, making it far easier to see the underlying trend. As a general rule, a bullish trend is indicated when price action stays consistently above the MA, whereas a bearish trend is suggested by price action remaining below it.
Traders often look for the well-known ‘Golden Cross’, when a shorter-period MA moves over a longer-period one, as a major bullish event. Its bearish counterpart, the ‘Death Cross,’ is treated as a serious sell warning.
How to use: Use it to smooth the price and identify the main trend. Price above MA suggests an uptrend; below MA suggests a downtrend. Look for a “Golden Cross” to buy or a “Death Cross” to sell.
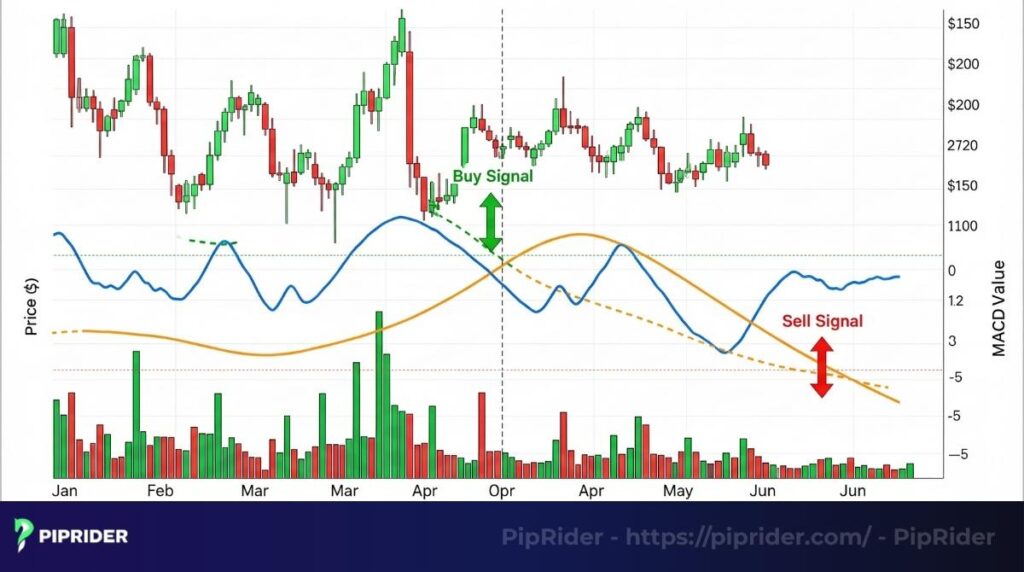
3.1.2. Moving Average Convergence Divergence (MACD)
This versatile indicator captures both trend and momentum by tracking the relationship between two moving averages. While the MACD is an excellent all-rounder, it can sometimes lag in very short-term setups due to its calculation method.
For faster momentum signals, particularly in day trading scenarios, some traders may prefer the Stochastic oscillator. However, for swing trading on daily charts, the MACD is widely regarded for its reliability in identifying sustained moves.
How to use: Identify momentum and trend changes. A buy signal occurs when the MACD line crosses above the signal line; a sell signal when it crosses below. Also, look for divergence between the price and the MACD.
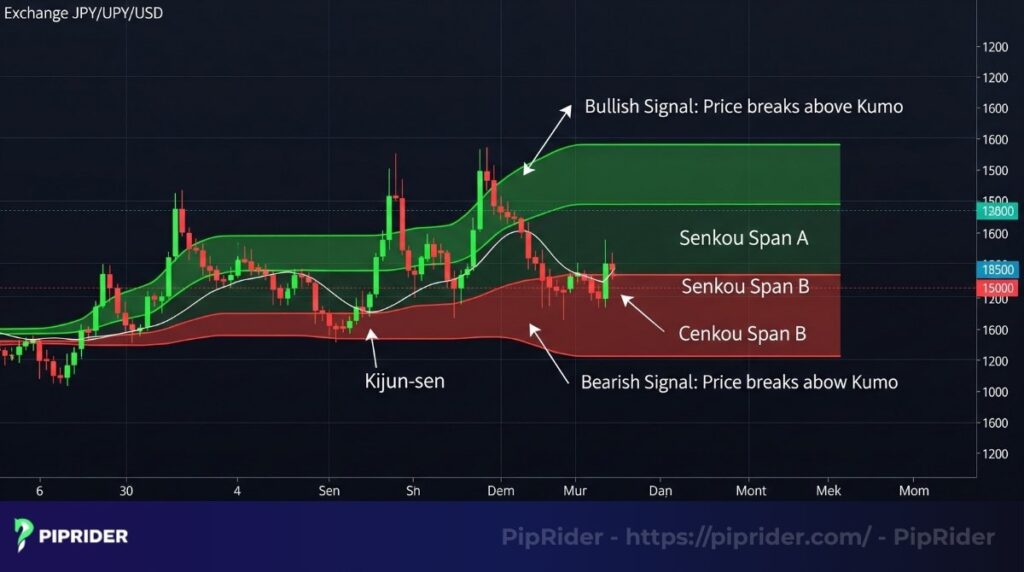
3.1.3. Ichimoku Cloud (Kumo)
Despite its seemingly complex appearance with multiple lines, the Ichimoku Cloud is a comprehensive indicator designed to provide a complete market snapshot on a single chart. It simultaneously defines the prevailing trend, gauges momentum, and identifies key dynamic support and resistance zones.
A primary signal is the price’s position relative to the “Cloud” (Kumo) itself. A clean price break above the Cloud is considered a strong bullish signal, while a break below the Cloud suggests bearish control.
How to use: Provides a holistic view of trend, momentum, support, and resistance. Price above the Cloud indicates an uptrend; price below the Cloud indicates a downtrend.
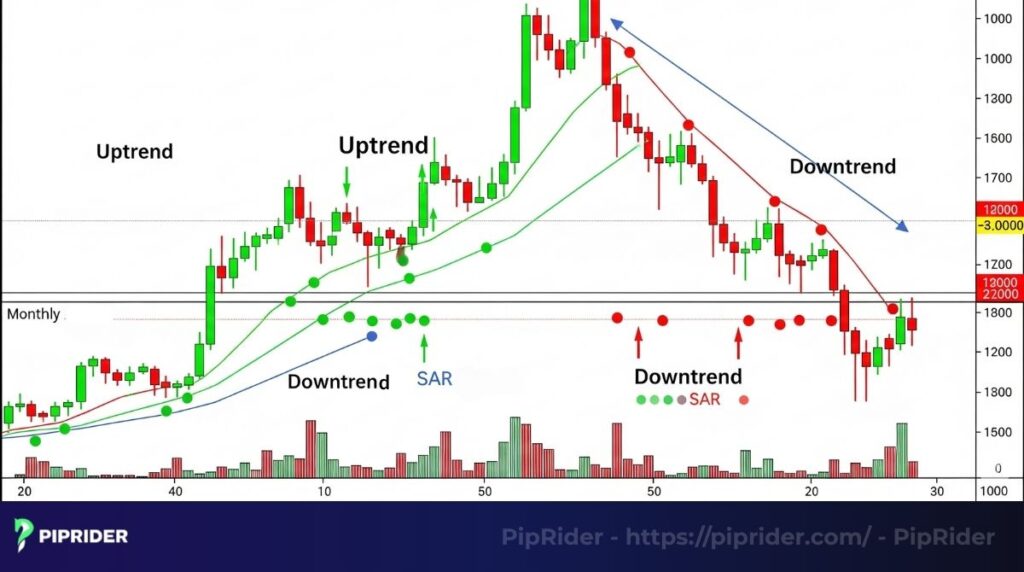
3.1.4. Parabolic SAR
The Parabolic Stop and Reverse appears as a series of dots on a chart, either above or below the price candles. While it can be used to signal potential entries, its primary strength is often considered to be in trade management.
It provides a dynamic trailing stop-loss level that automatically adjusts as the trend progresses. This offers a systematic, non-emotional method for protecting profits during a sustained move.
How to use: Use to track trends and manage stop-losses. Dots below the price indicate an uptrend; dots above the price indicate a downtrend. A flip in the dots’ position signals a potential stop and reverse point.
3.2. Momentum Oscillators
These indicators measure the speed and strength of price movements, helping you identify when a market might be overextended or ripe for a reversal.
3.2.1. Relative Strength Index (RSI)
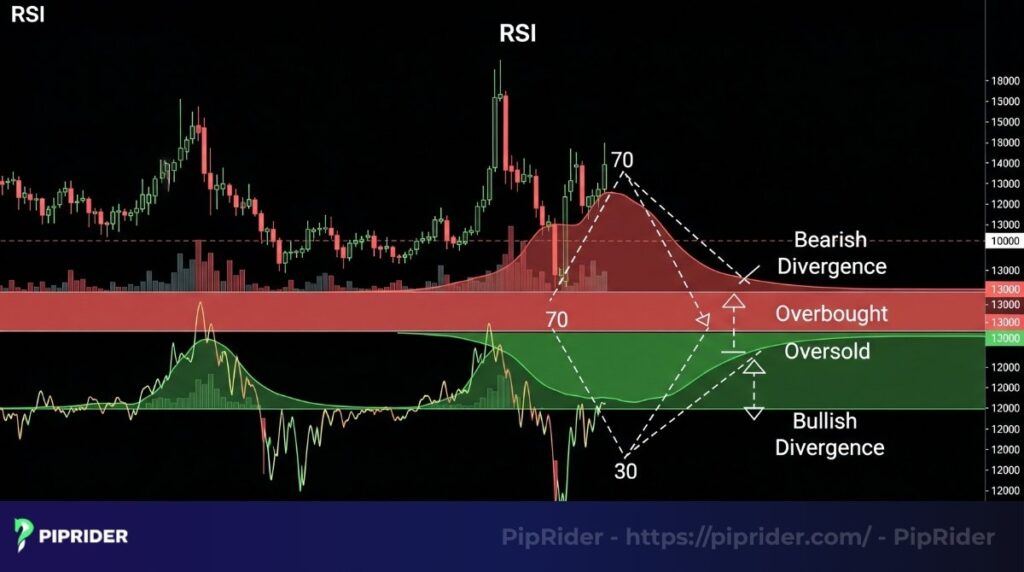
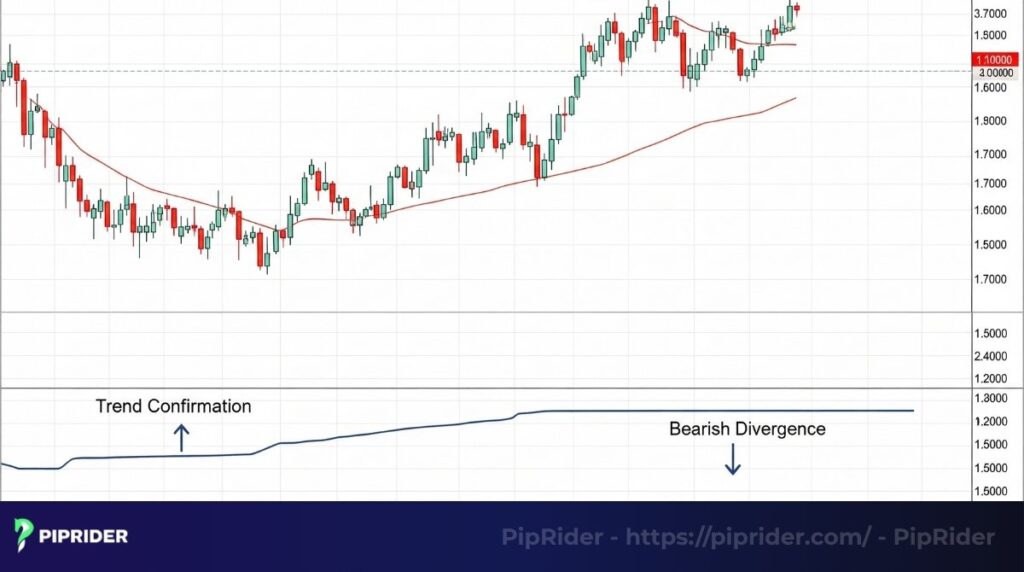
The RSI acts like a momentum speedometer for the market, measuring the speed and magnitude of recent price changes on a scale of 0 to 100. While beginners often focus on the classic overbought (>70) and oversold (<30) levels, divergence is considered its most powerful signal.
For example, during a strong rally, if the price makes new highs while the RSI simultaneously makes lower highs (bearish divergence), it signals weakening momentum and warns of a potential reversal. This divergence can provide early indication to protect profits or consider counter-trend opportunities.
How to use: Measures the speed and change of price movements. Readings above 70 are typically considered overbought, while readings below 30 are considered oversold. Look for divergence between the RSI and price action for strong reversal signals.
3.2.2. Stochastic Oscillator
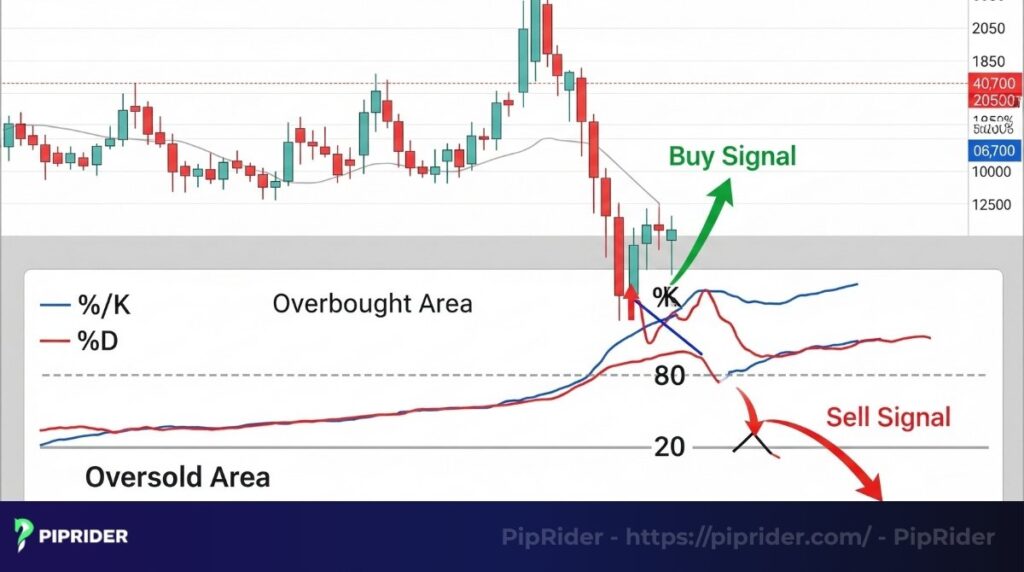
The Stochastic Oscillator is another momentum indicator, often considered more sensitive than the RSI. It also identifies overbought (typically >80) and oversold (typically <20) conditions by comparing a closing price to its price range over a specific period.
Due to its calculation method, the Stochastic tends to react more quickly to price changes than indicators like the MACD. This responsiveness makes it a popular choice among traders focusing on shorter timeframes.
How to use: Identifies overbought (>80) and oversold (<20) conditions. Look for crossovers of the %K line (fast line) and %D line (slow line) within these extreme zones as potential entry or exit signals.
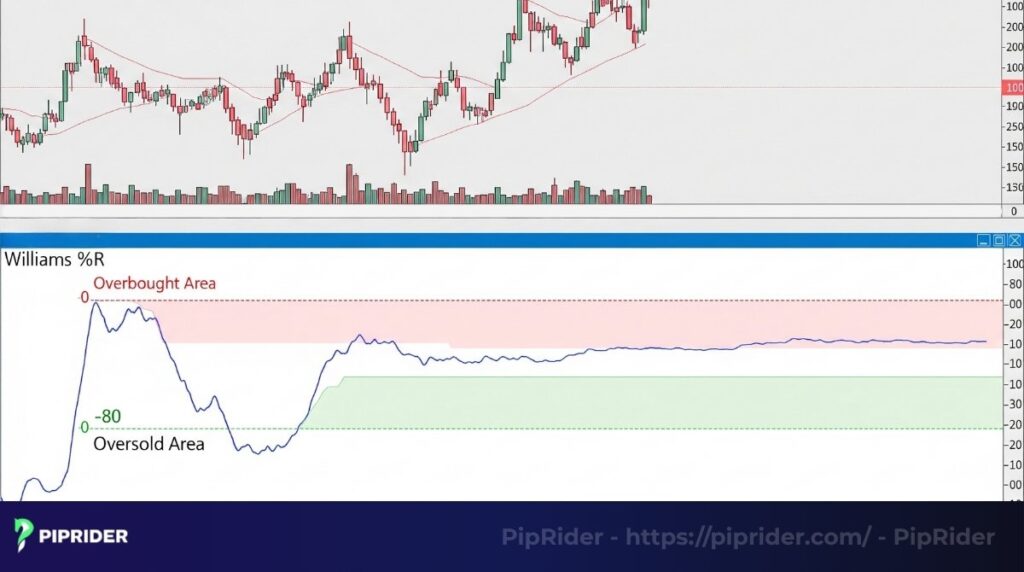
3.2.3. Williams %R
The Williams %R is a fast and sensitive momentum oscillator that operates similarly to the Stochastic Oscillator but uses an inverted scale ranging from 0 to -100.
Its calculation makes it particularly responsive to recent price changes, often providing earlier signals of potential overbought (typically >-20) and oversold (typically <-80) conditions compared to other oscillators. This sensitivity makes it a frequently used tool among short-term traders who require quick feedback on momentum shifts.
How to use: A sensitive oscillator (0 to -100). Readings above -20 are considered overbought; readings below -80 are considered oversold. Often provides earlier momentum signals.
3.3. Volatility Indicators
The following indicators tell you how calm or explosive a market is, which is crucial for risk management.
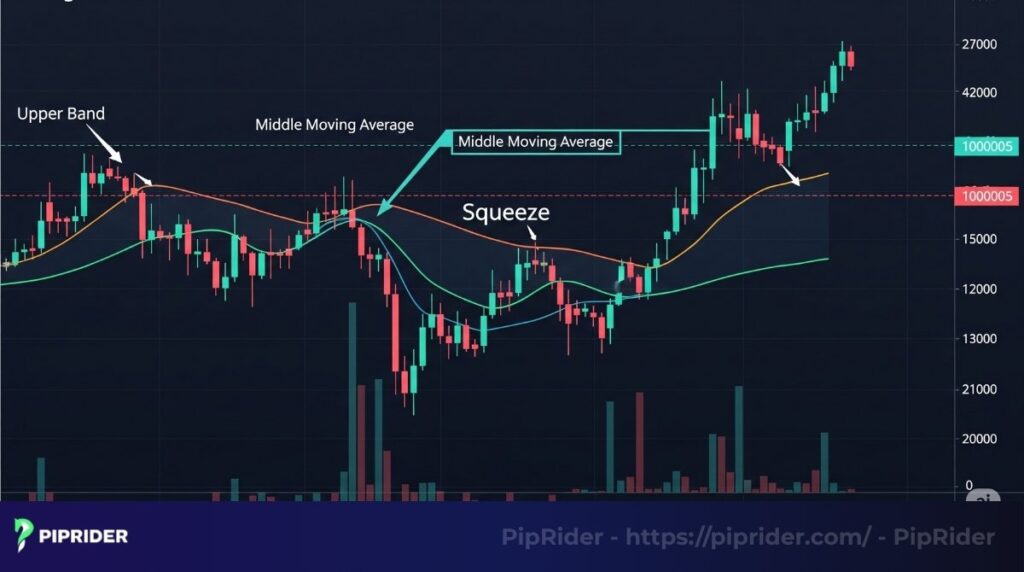
3.3.1. Bollinger Bands
Bollinger Bands are a widely used volatility indicator composed of three lines plotted directly on the price chart:
- A middle band, which is typically a Simple Moving Average (SMA).
- An upper band and a lower band, positioned a set number of standard deviations away from the middle band (usually two).
The distance between the upper and lower bands visually represents market volatility.
- When the bands tighten (move closer together), it signals low volatility and is known as a “Squeeze.” This often precedes a significant price move or breakout.
- When the bands widen (move far apart), it indicates high volatility.
How to use: Measures volatility. Band “Squeezes” often precede large price moves. Price touching the outer bands can indicate temporary overbought/oversold conditions relative to the recent average.
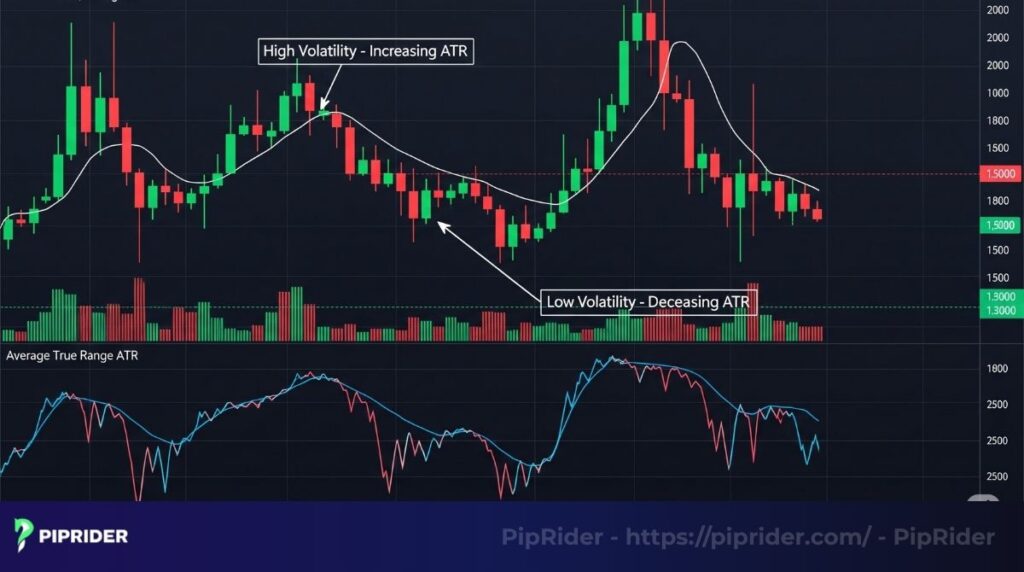
3.3.2. Average True Range (ATR)
The Average True Range (ATR) is a volatility indicator primarily used for risk management, not for generating direct buy or sell signals. It measures the average range between high and low prices over a specific period, factoring in any gaps.
Its primary application is to help traders set stop-losses and take-profit levels that are adaptive to the market’s current volatility. Using an ATR-based stop-loss, for example, allows the stop level to widen during volatile periods and tighten during calmer ones, potentially reducing the chance of being stopped out by normal market “noise.”
How to use: Measures market volatility. Essential for setting dynamic stop-losses and take-profits that adapt to the asset’s true volatility.
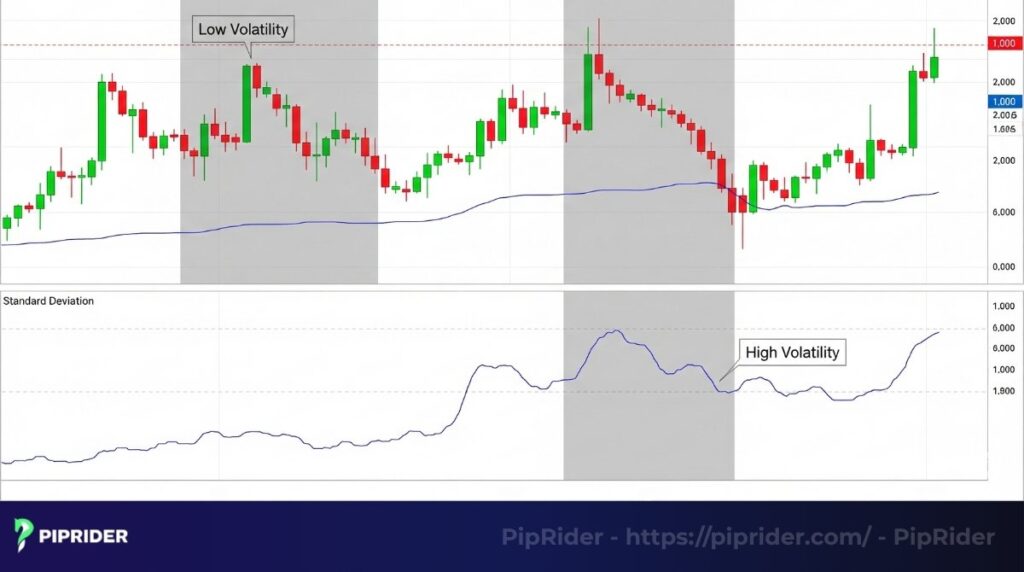
3.3.3. Standard Deviation
Standard Deviation is a statistical indicator that measures the dispersion or volatility of price action around its average (mean). It forms the mathematical basis for Bollinger Bands.
A low Standard Deviation reading indicates that price is trading within a tight range, suggesting low volatility and potential consolidation. Conversely, a high reading signifies that price is spread out over a wider range, indicating elevated volatility.
Traders often monitor for shifts from low to high standard deviation as a potential signal that a period of consolidation is ending and a significant price move or breakout may be imminent.
How to use: Measures price dispersion (volatility). Low standard deviation suggests a quiet, consolidating market; high suggests elevated volatility. Look for shifts from low to high to anticipate large price moves.
3.4. Volume Indicators
These indicators use trading volume data to confirm the strength of a trend or to spot signs that money flow is changing.
3.4.1. On-Balance Volume (OBV)
The On-Balance Volume (OBV) is a momentum indicator that uses volume flow to predict changes in stock price. Developed by Joseph Granville, it works by keeping a running total of volume: adding volume on days when the price closes higher and subtracting volume on days when the price closes lower.
The primary use of OBV is to confirm price trends or identify divergences.
- A rising OBV alongside a rising price confirms bullish momentum.
- A falling OBV alongside a falling price confirms bearish momentum.
- Divergence occurs when price and OBV move in opposite directions (e.g., price rising but OBV falling). This can signal that the current trend lacks volume support and may be weakening.
How to use: Tracks volume flow relative to price. A rising OBV helps confirm an uptrend. Divergence between price and OBV (e.g., rising price but flat/falling OBV) warns of a potentially weak trend.
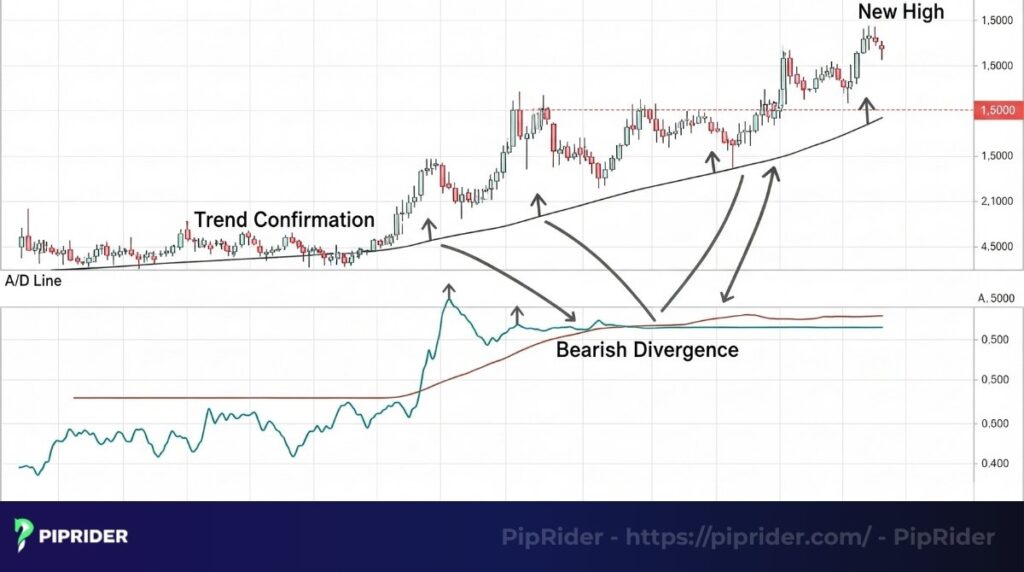
3.4.2. Accumulation/Distribution Line (A/D Line)
The Accumulation/Distribution Line (A/D Line) is a volume-based indicator designed to measure the cumulative flow of money into or out of an asset. Similar in concept to OBV, it assesses whether traders are primarily accumulating (buying) or distributing (selling).
It achieves this by considering the relationship between the closing price and the high-low range for a period, weighted by volume.
- When the A/D Line trends upwards along with price, it suggests strong buying pressure is supporting the uptrend (accumulation).
- When the A/D Line trends downwards while price falls, it confirms selling pressure (distribution).
- Divergence between the A/D Line and price (e.g., price rising but A/D falling) can indicate underlying weakness in the trend, suggesting a potential shift in money flow.
How to use: Helps determine if institutional money is accumulating or distributing. A rising A/D line confirms strong buying pressure. Divergence between the A/D line and price indicates a potential shift in underlying money flow.
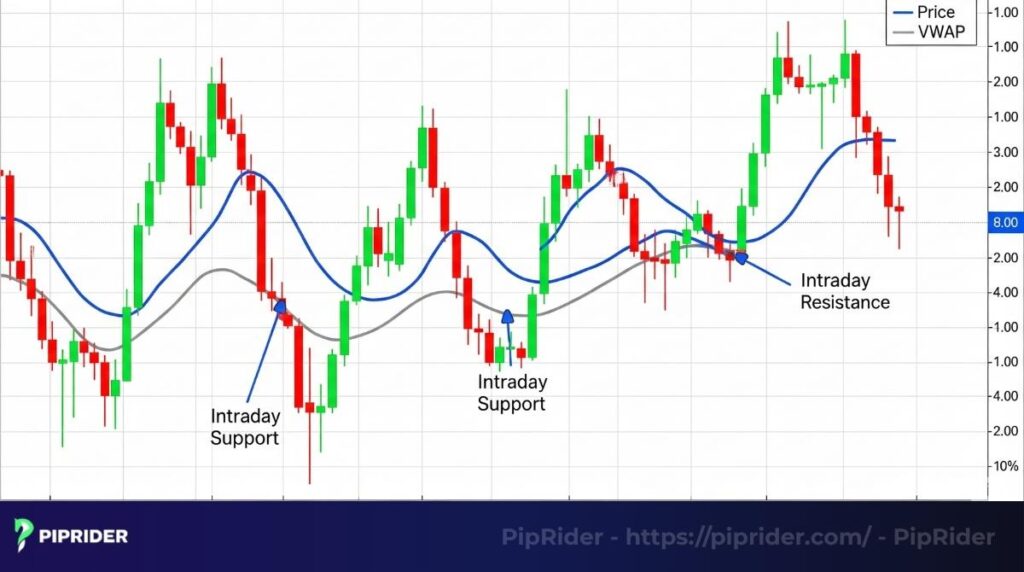
3.4.3. Volume-Weighted Average Price (VWAP)
The Volume-Weighted Average Price (VWAP) calculates the average price of an asset over a specific time period (typically one day), weighted by the volume traded at each price level. It appears as a single line on intraday charts.
VWAP serves as a crucial intraday benchmark, representing the ‘true’ average price paid per share or contract for the session so far.
- Many traders view prices below VWAP as relatively inexpensive or potentially undervalued for the day.
- Prices above VWAP are often seen as relatively expensive or potentially overvalued for the day.
Because of its calculation method, the VWAP line can also function as a significant level of intraday support or resistance.
How to use: Represents the volume-weighted average price for the day. Acts as a key intraday benchmark and can serve as strong intraday support or resistance.
3.5. Supplementary & Cross-Functional Indicators
These indicators don’t strictly fit into one of the four main categories, but they are incredibly important and can add significant depth to your analysis.
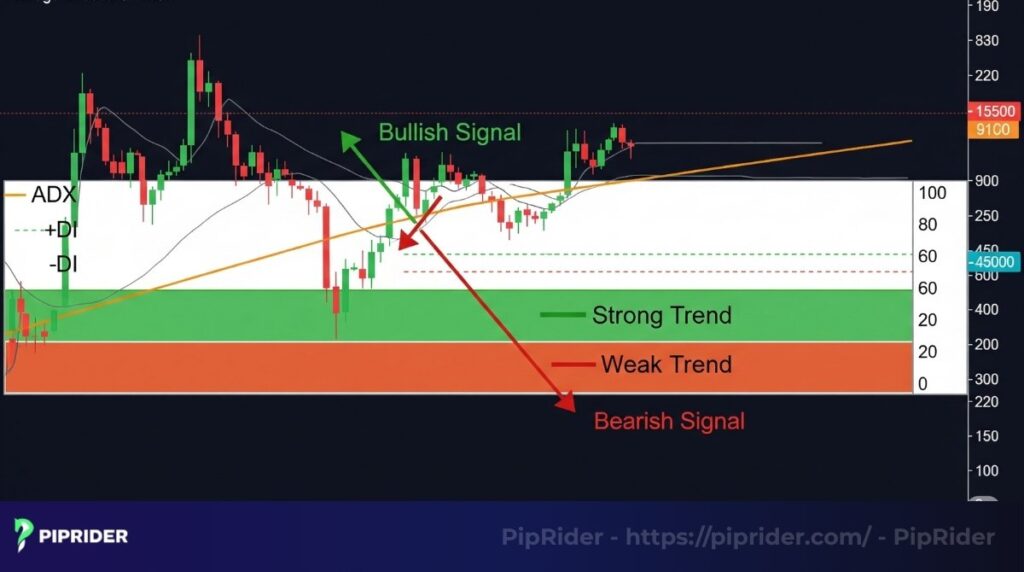
3.5.1. Average Directional Index (ADX)
The Average Directional Index (ADX) is an indicator designed specifically to quantify the strength of a prevailing market trend, irrespective of its direction (up or down). It is plotted as a single line, typically ranging from 0 to 100.
The ADX reading helps traders gauge whether a market is trending strongly or moving sideways:
- A reading above 25 generally indicates a strong, established trend (either bullish or bearish) that might be suitable for trend-following strategies.
- A reading below 20 typically signals a weak, non-trending, or ranging market, suggesting that trend-following approaches may be less effective.
How to use: Measures trend strength, not direction. ADX above 25 indicates a strong trend; ADX below 20 suggests a weak or sideways market.
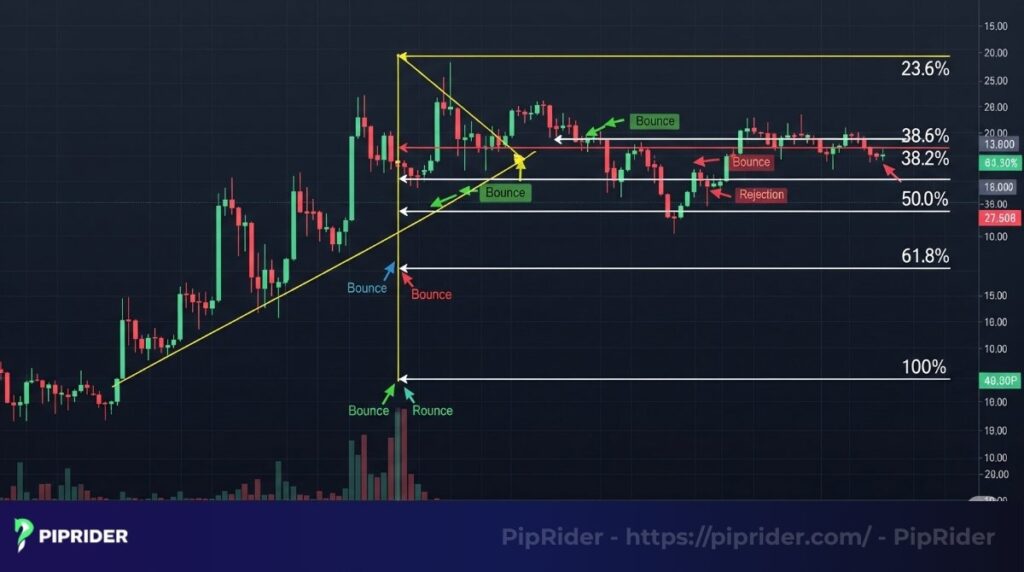
3.5.2. Fibonacci Retracement
Fibonacci Retracement is a popular technical analysis tool used to identify potential support and resistance levels. It is based on key numbers from the Fibonacci sequence, which translate into percentage levels (commonly 23.6%, 38.2%, 50%, 61.8%, and 78.6%).
Traders observe that prices often pause or reverse near these calculated levels during a pullback within a larger trend. The tool is applied by drawing it between a significant swing high and swing low on the chart. The resulting horizontal lines indicate potential zones where the price correction might end before resuming the primary trend.
How to use: Identifies potential support and resistance levels based on Fibonacci ratios. Draw between a significant swing high and low to find price zones where a reversal or consolidation might occur.
4. Quick trading signals table for new traders
Here are the common Buy and Sell signals for each indicator, presented in a condensed format.
| Technical Indicator | BUY Signal | SELL Signal |
| Moving Average (MA) | Golden Cross (Short MA crosses above Long MA) | Death Cross (Short MA crosses below Long MA) |
| MACD | MACD crosses above Signal Line | MACD crosses below Signal Line |
| Ichimoku Cloud | Price/Tenkan crosses above Kumo | Price/Tenkan crosses below Kumo |
| Parabolic SAR | SAR dots flip from above to below price | SAR dots flip from below to above price |
| RSI (14) | RSI moves above 30 (from oversold) | RSI moves below 70 (from overbought) |
| Stochastic Oscillator | %K crosses above %D in oversold zone (<20) | %K crosses below %D in overbought zone (>80) |
| Williams %R | %R crosses above -80 (from oversold) | %R crosses below -20 (from overbought) |
| Bollinger Bands | Price touches/breaks lower band & reverses up | Price touches/breaks upper band & reverses down |
| Average True Range (ATR) | No direct buy/sell signal; used for risk management (stop-loss). | No direct buy/sell signal; used for risk management (stop-loss). |
| Standard Deviation | No direct buy/sell signal; used to measure volatility. | No direct buy/sell signal; used to measure volatility. |
| On-Balance Volume (OBV) | OBV rising with price; or bullish divergence | OBV falling with price; or bearish divergence |
| Accumulation/Distribution Line | A/D rising with price; or bullish divergence | A/D falling with price; or bearish divergence |
| Volume-Weighted Average Price (VWAP) | Price crosses above VWAP (intraday) | Price crosses below VWAP (intraday) |
| Average Directional Index (ADX) | ADX above 25 & +DI crosses above -DI | ADX above 25 & -DI crosses above +DI |
| Fibonacci Retracement | Price finds support & bounces from Fibo level | Price finds resistance & retreats from Fibo level |
We hope this consolidated table proves to be a valuable tool in your trading journey! Remember, no single indicator is perfect, and combining multiple indicators with overall market analysis will yield the best results.
5. Deadly mistakes to avoid when using indicators
How you don’t use indicators is just as important as how you do.
- Mistake 1: Redundant signals. Using an RSI, a Stochastic, and a Williams %R on the same chart is a common beginner mistake. They are all momentum oscillators and will tell you the same thing, creating a false sense of confirmation.
- Mistake 2: Ignoring price action. Indicators are derived from price; they are not more important than price itself. A bearish divergence on the MACD is far more powerful if it’s accompanied by a bearish candlestick pattern on the chart.
- Mistake 3: The “holy grail” hunt. It’s crucial to remember that no single indicator is infallible. They are tools of probability. Your long-term success will depend on combining them with disciplined risk management.
Read more:
Confluence in Trading: Mastering Multi-Factor Strategies
6. Frequently asked questions about the technical indicators
7. Conclusion
Mastering technical analysis is a journey of discovery. By understanding the core job of each of these tools, new traders can move from a cluttered, confusing chart to a clean dashboard that gives them clear, actionable information.
The goal is never to predict the future, but to put the probabilities on your side. The best technical indicators are simply the ones you understand deeply and can trust to inform your trading decisions as part of a complete, disciplined strategy.
Don’t forget to follow Piprider to learn more useful knowledge in our Learn Forex category.
Infographic Section
-
The 5 Essential Groups for Market Analysis -
Choosing Your Indicator Combination -
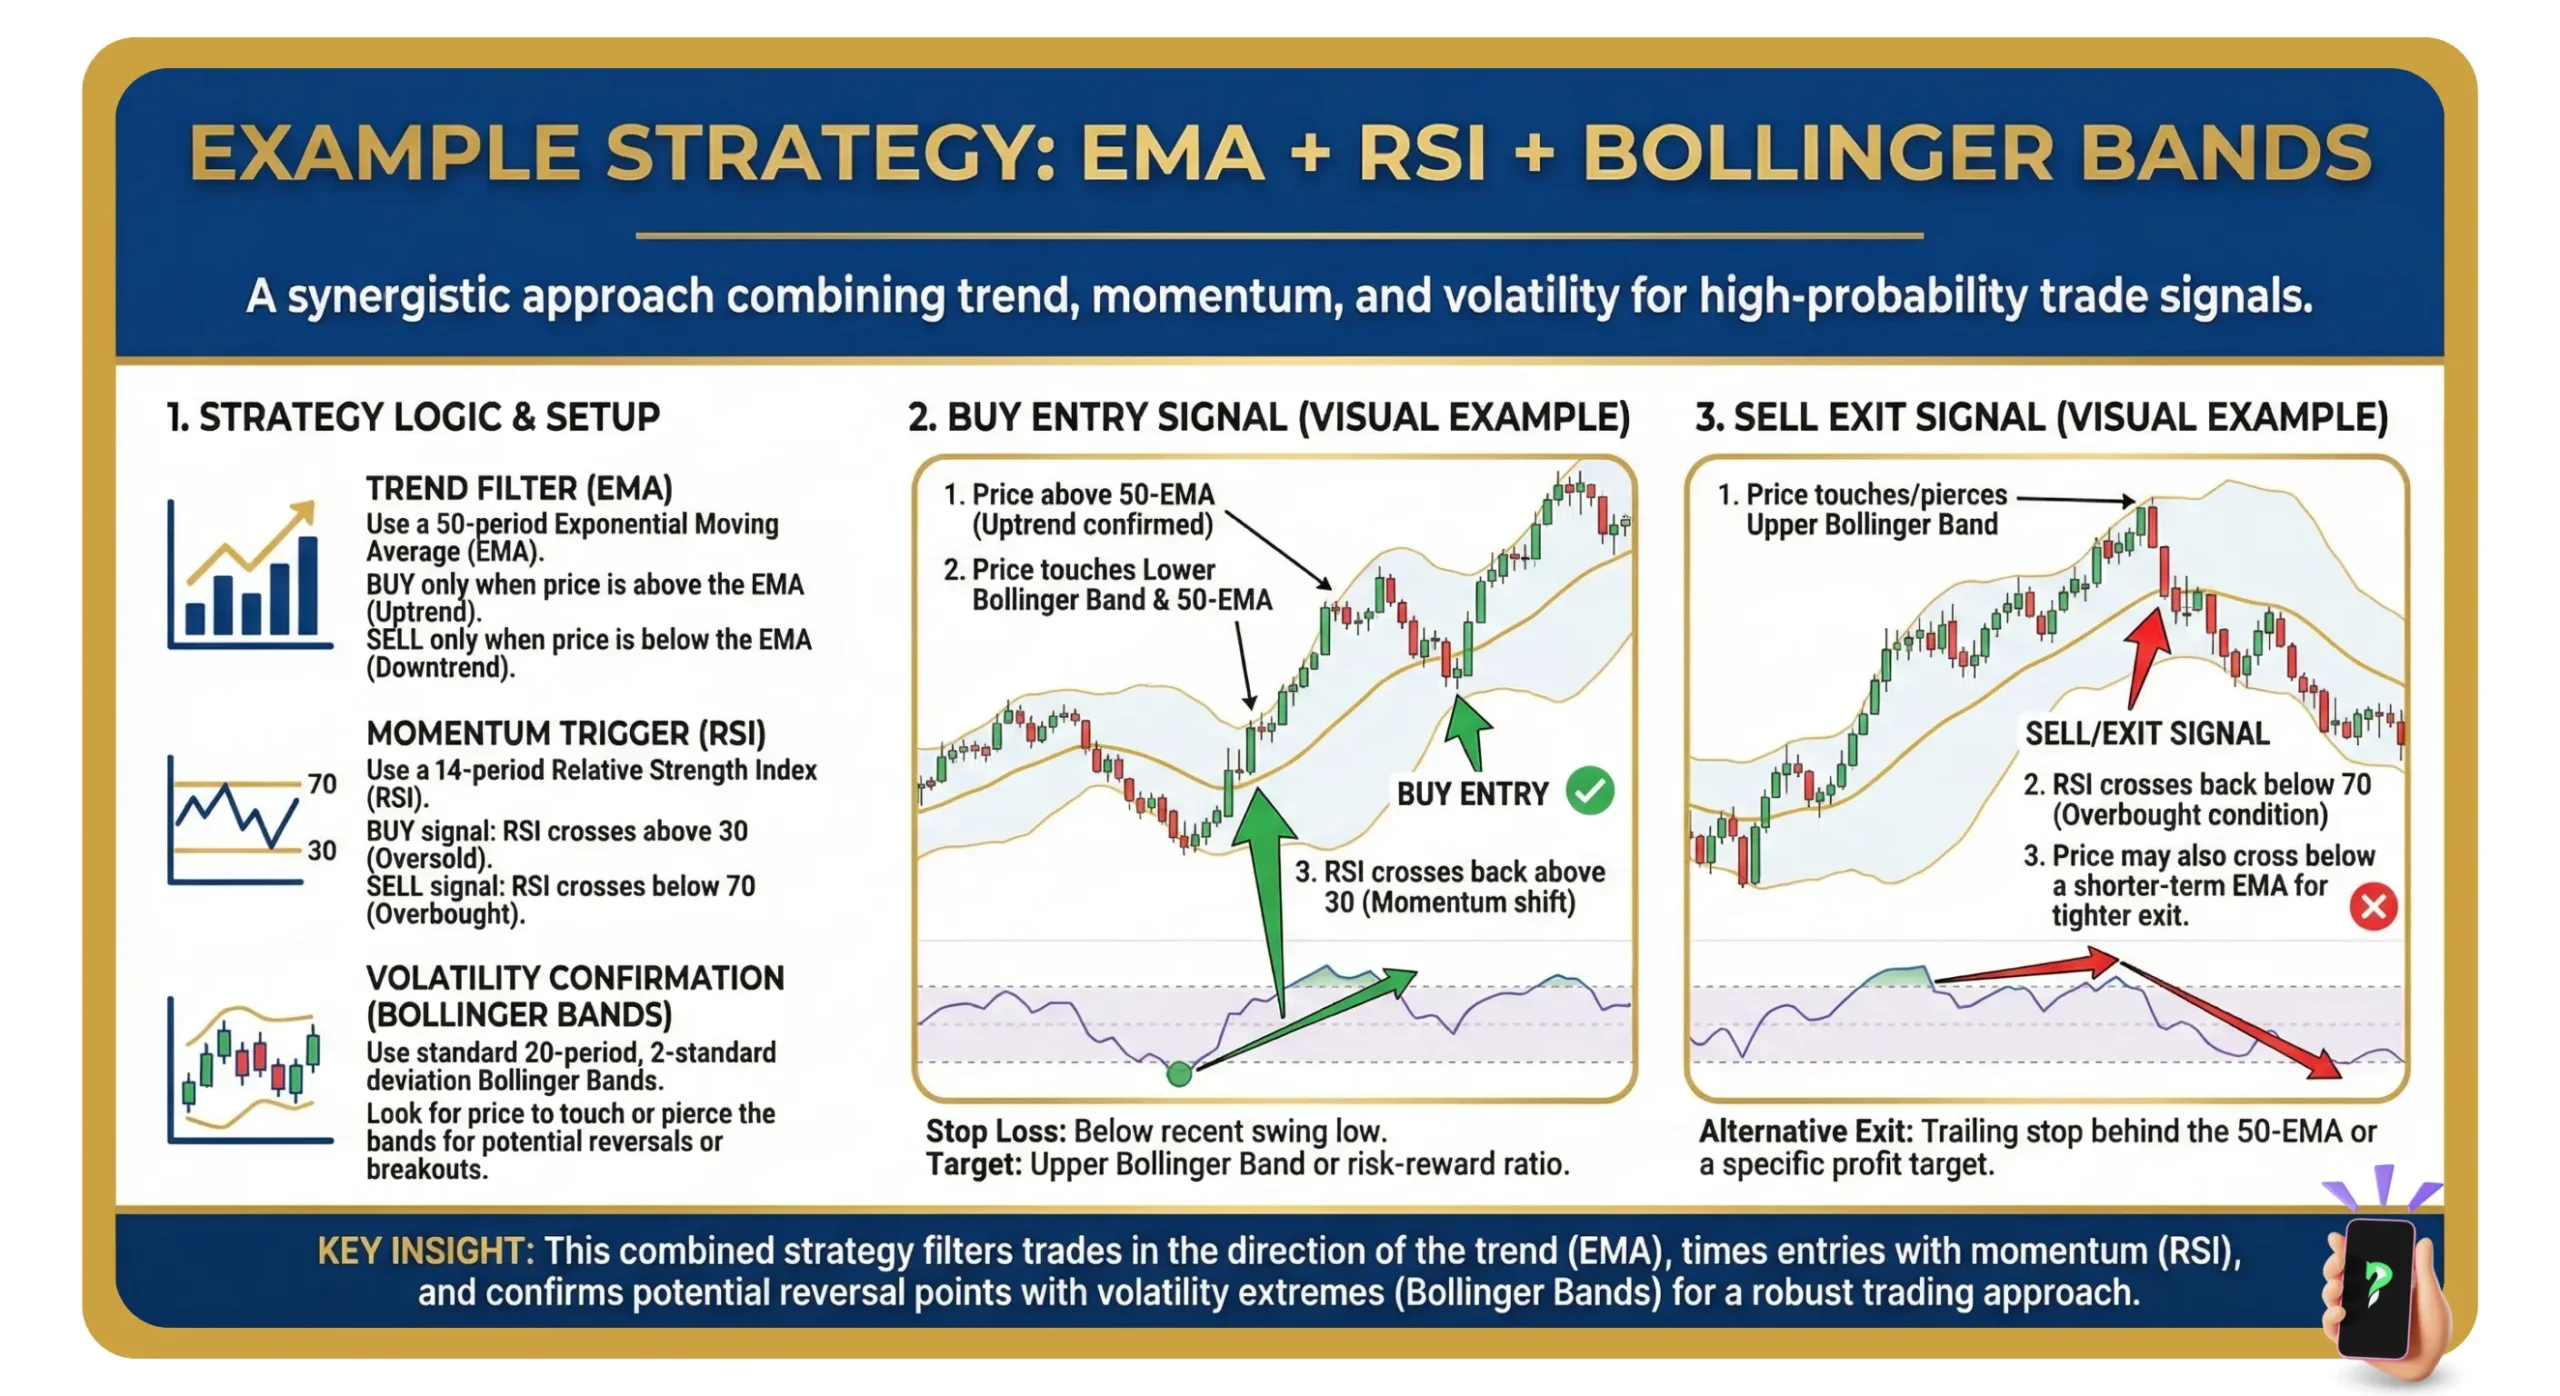
EMA + RSI + Bollinger Bands


