The Golden Cross Pattern is one of the most trusted bullish reversal signals used by traders across stock, forex, and crypto markets to identify strong uptrends. Learning how to trade the golden cross involves spotting when short-term momentum overtakes the long-term average. This guide explains how to identify valid signals and avoid costly fakeouts.
Key Takeaways
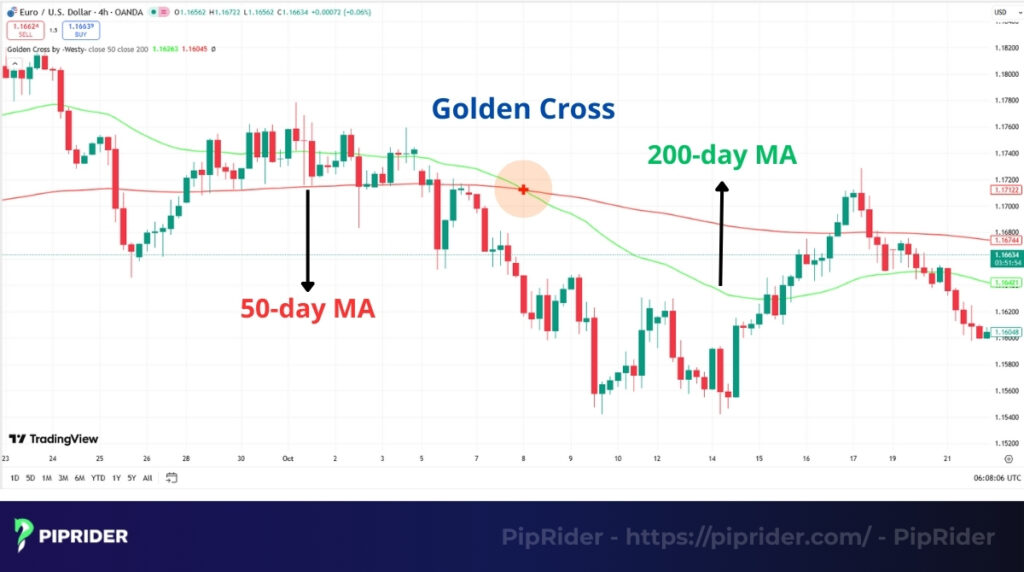
- A Golden Cross occurs when the 50-day moving average crosses above the 200-day moving average.
- It signals the potential start of a long-term bullish market.
- The signal is strongest when confirmed by high trading volume, RSI, and MACD.
- Traders should avoid using this pattern in sideways markets to prevent “whipsaw” losses.
- Popular strategies include buying the breakout, waiting for a pullback, or using it for trend-following.
1. What Is the Golden Cross Pattern?
The Golden Cross Pattern is a bullish technical chart pattern that signals a potential market rally or the start of a long-term uptrend. It occurs when a security’s short-term moving average crosses above its long-term moving average.
Traders view this as a strong “buy” signal because it indicates that recent price momentum has overpowered the long-term trend.
The classic Golden Cross consists of two specific Moving Averages (MA):
- The 50-day MA: Represents the short-term trend.
- The 200-day MA: Represents the long-term trend.
The signal triggers exactly when the 50-day moving average crosses up and over the 200-day moving average.
Psychologically, this crossover represents a shift in market sentiment. The 200-day MA is often viewed as a heavy “resistance” level. When short-term buyers are aggressive enough to push the average price above this long-term moving average, it confirms that buyers have taken control from sellers.
Golden Cross vs. Death Cross
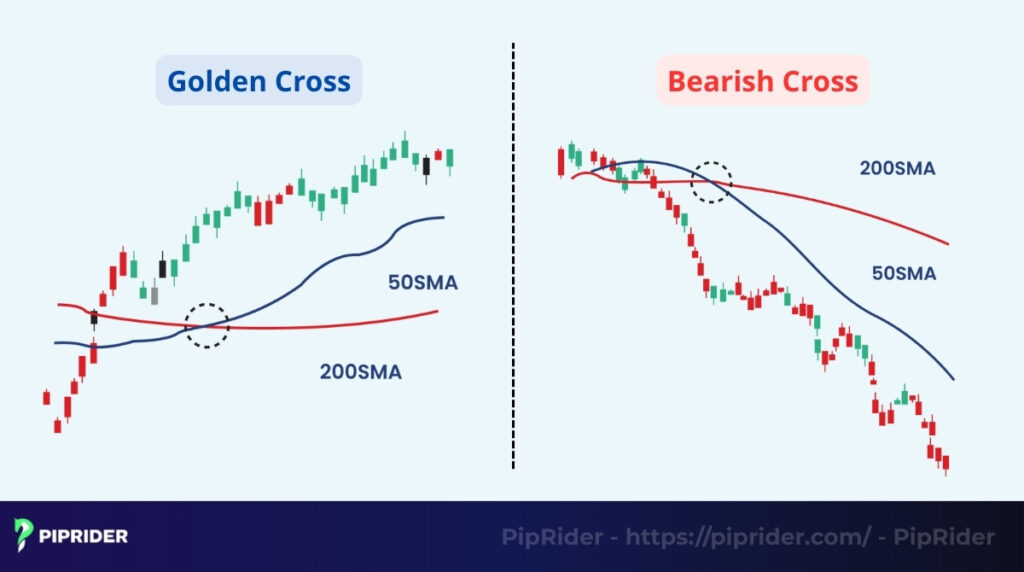
To understand the Golden Cross, traders should compare it to its opposite, the Death Cross.
- Golden Cross: 50MA crosses above 200MA (Bullish Signal).
- Death Cross: 50MA crosses below 200MA (Bearish Signal).
While the Golden Cross signals the birth of an uptrend, understanding death cross pattern signals is equally important as they warn of a potential crash.
2. How Does the Golden Cross Pattern Work?
The Golden Cross is not just a single moment; it is the final confirmation of a trend shift that happens over time. To trade it effectively, you must understand the three distinct phases of its formation.
2.1. Phase 1: Downtrend Weakening (The Setup)
Before a Golden Cross can happen, the previous downtrend must die out. In this phase, selling pressure is exhausted. You will see the price stop making lower lows and start to form a sideways base or even a higher low. The moving average lines begin to flatten out.
2.2. Phase 2: The Convergence (Building Momentum)
As buyers step in, the price starts to rise. This causes the short-term moving average to curve upwards and approach the long-term moving average from below. The gap between the two lines narrows. This “convergence” is a sign that short-term momentum is building strength.
2.3. Phase 3: The Breakout (The Crossover)
This is the signal event. The 50-day moving average crosses decisively above the 200-day moving average. This creates a bullish breakout on the chart. At this point, the long-term trend is officially considered bullish. Often, the 200-day line will then become a new dynamic area of support levels for the price as the upward trend continues.
Read more:
Top 21 Trading Patterns Every Trader Should Master in 2025
Continuation Candlestick Patterns: Definition And Strategies
3. What Are the Different Types of Golden Cross Patterns?
While the 50/200 day combination is the standard, traders often adjust the settings to fit their specific moving average strategy. Here are the four most common variations you will see.
- The Classic Golden Cross (50/200 MA) is the industry standard watched by banks, funds, and long-term investors. It is highly reliable but very slow (lagging).
- The Short-Term Golden Cross (20/50 MA): Swing traders use this faster combination (20-day crossing 50-day) to catch medium-term trends. The signals appear much earlier than the classic cross, but false signals are more common.
- The Multi-Timeframe Golden Cross involves looking for a Golden Cross on the weekly chart (e.g., 10-week crossing 40-week). A weekly Golden Cross is an incredibly powerful signal.
- The High-Volume Golden Cross isn’t a different setting but a different quality of signal. A Golden Cross that happens on double or triple the average volume is considered a “Type 1” signal, the strongest available.
4. How to Identify a Valid Golden Cross Pattern
Identifying the cross is easy, but identifying a valid one takes skill. Because the Golden Cross is a lagging indicator, it can produce false signals in choppy markets. Follow this 5-step checklist to filter out the noise and find high-probability setups.

4.1. Step 1: Plot the 50MA and 200MA
Start by setting up your chart correctly. Open your trading platform and add two “Simple Moving Average” indicators. Set the short-term period to 50 (often colored green or blue) and the long-term period to 200 (often colored red). Ensure you are viewing the daily timeframe.
4.2. Step 2: Confirm the Slope
The angle of the lines tells you the strength of the trend. For a high-quality signal, the 50-day moving average must be sloping upwards clearly. Ideally, the 200-day moving average should also be flattening out or turning up. If it is still pointing steeply downward, the long-term bearish trend is still too strong, and the cross may fail.
4.3. Step 3: Check for Volume Confirmation
Volume acts as the fuel for the trend. Look at the volume bars on the day (or week) the crossover happens. You want to see a noticeable spike in trading volume. This confirms that institutional buyers (mutual funds, banks) are stepping in to support the higher prices. A cross on low volume is often a trap.
4.4. Step 4: Confirm Market Structure
Indicators should follow price, not the other way around. Before the cross even happens, look at the price action. The market should already be forming a higher high and higher low structure. This price action proves the trend has physically changed before the lagging moving average indicator confirms it.
Mastering stock market trend analysis allows you to see these structural shifts in real-time.
4.5. Step 5: Avoid Sideways Markets
This is the most common trap. If the price is chopping sideways in a range, the 50 and 200 lines will become flat and “braid” together, crossing back and forth repeatedly. Ignore all signals in a sideways market. A valid Golden Cross must come from a clear bottoming base.
5. How to Trade the Golden Cross Pattern
Once traders have identified a valid cross, they need a plan to enter and exit. Different traders use different tactics depending on their patience, risk appetite and many integrate the Golden Cross into their overall forex trading strategy.
Here are the four most effective strategies to capitalize on this signal.
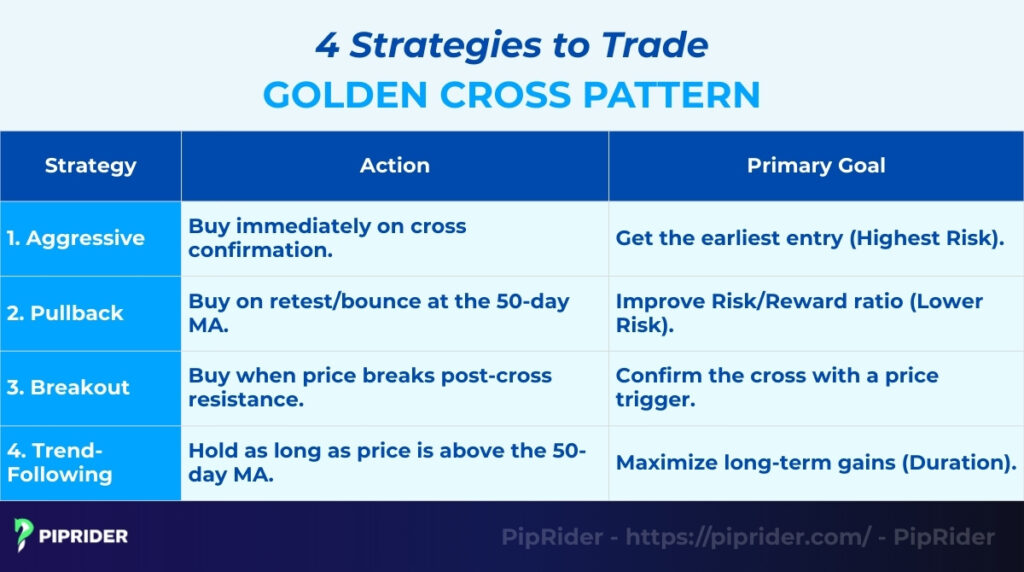
5.1. Strategy 1: The Aggressive Entry (Buy Immediately)
Swing traders who don’t want to miss the initial move often use this method. It assumes that the breakout momentum is strong enough to carry the price higher without looking back.
- The Action: Enter a “Long” (Buy) position as soon as the daily candle closes, confirming the short-term moving average has crossed above the long-term moving average.
- The Logic: Traders are betting on immediate continuation. This gets them in early but carries a higher risk of a “whipsaw.”
5.2. Strategy 2: The Pullback Entry (Buy the Retest)
Conservative traders prefer this safer approach. Since prices rarely go up in a straight line, they often return to “test” the average.
- The Action: After the cross, wait patiently for the price to dip back down to touch the 50-day moving average. When the price touches the line and bounces (shows a green candle), enter your buy trade.
- The Logic: This strategy significantly improves the risk-to-reward ratio by allowing traders to place a tighter stop-loss just below the moving average.
5.3. Strategy 3: The Breakout Confirmation
This strategy combines the lagging moving average signal with leading Price Action to filter out false signals. It waits for the market to prove that it can break through local resistance.
- The Action: Identify the most recent resistance level (high point) formed after the Golden Cross occurred. Do not buy until the price breaks and closes above that resistance level.
- The Logic: The cross gives you the “bias” (Up), but the breakout gives traders the “trigger,” confirming that buyers have officially overpowered sellers.
5.4. Strategy 4: The Trend-Following Ride
Long-term investors use this strategy to maximize gains from a multi-year bull run. The goal is not to find a quick profit but to stay in the trade for as long as the major trend remains intact.
- The Action: Once in a trade, do not set a fixed profit target. Instead, hold the position as long as the price stays above the moving average line.
- The Logic: Traders treat the line as dynamic support. Traders only sell when the price closes decisively below this line, which signals that the trend is finally weakening.
5.5. Where to Place Your Stop Loss
Risk management is non-negotiable. Because the Golden Cross is a lagging indicator, the price can sometimes reverse against traders. Traders must define exit before entering.
- Conservative Stop: Place it just below the 200-day moving average. This gives the trade plenty of room to breathe.
- Tight Stop: Place it just below the most recent swing low. If the price makes a new low, the uptrend structure is broken.
5.6. How to Set Take Profit Levels
Since a Golden Cross can lead to a long trend, avoid capping the profits too early.
- Key Resistance: Target the next major resistance zone on the weekly chart.
- Fibonacci Extension: Use levels like the 1.272 or 1.618 extension.
- ATR Trailing Stop: Use a trailing stop to lock in profits as the price rises.
6. Which Indicators Best Confirm the Golden Cross Pattern?
A Golden Cross is a powerful signal, but it is lagging. To avoid buying at a short-term top, professional traders use confluence in trading. They look for secondary indicators to confirm that the momentum is real and sustainable.
Here is a quick confirmation cheat sheet:
| Indicator | What to Look For | Why It Matters |
| Volume | Increasing on the crossover | Confirms institutional buying pressure. |
| RSI | Above 50 (but not >70) | Shows bullish momentum without being overbought. |
| MACD | Bullish Crossover | Confirms momentum direction matches the trend. |
| ADX | Above 25 | Confirms the trend is strong enough to trade. |
6.1. Volume (The Fuel)
Volume is the most critical confirmation tool. A Golden Cross that happens on low or declining volume is suspicious; it suggests a lack of institutional interest.
Traders want to see the crossover day (or week) accompanied by higher-than-average volume. This proves that big money is supporting the move.
6.2. RSI (Relative Strength Index)
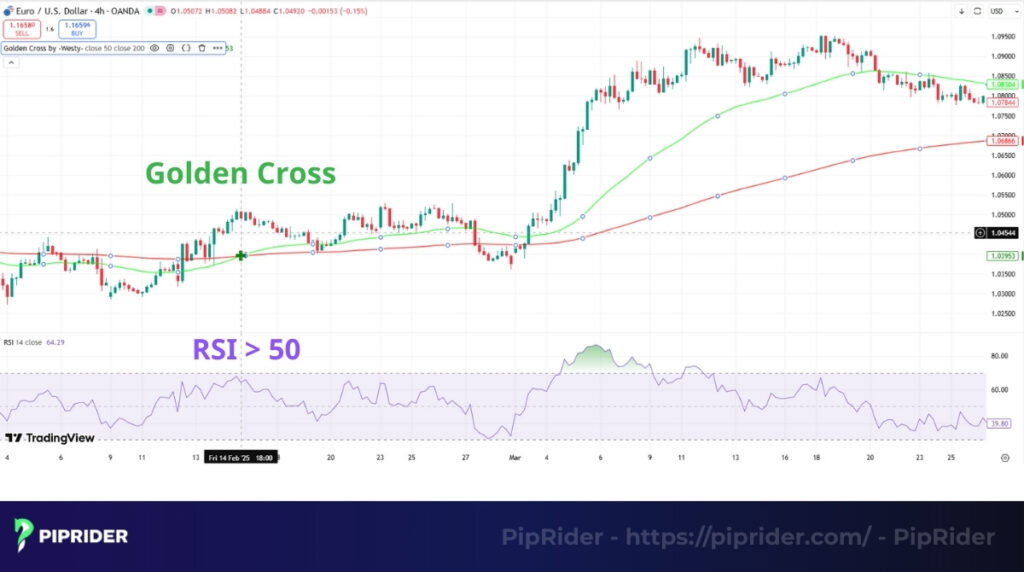
The RSI helps traders gauge momentum and avoid buying a “tired” move.
When the cross happens, the RSI should be in bullish territory (above 50). However, use caution if the RSI is already above 70 (Overbought). This often means the price has moved too fast, and a short-term pullback is likely before the trend continues.
6.3. MACD (Moving Average Convergence Divergence)
The MACD is a momentum indicator that often leads price, giving traders an early warning.
Look for the MACD line to cross above the Signal line (a bullish crossover). Ideally, this MACD cross should happen slightly before or at the same time as the Golden Cross, confirming that momentum is shifting in the favor.
6.4. ADX (Average Directional Index)
The ADX measures the strength of a trend, which is vital because moving averages fail in sideways markets.
Ensure the ADX line is above 25 and rising. This simple check confirms that a real trend is forming and the market is not just chopping sideways, protecting traders from whipsaws.
7. How Does the Golden Cross Compare to Similar Signals?
Traders often confuse the Golden Cross with other bullish signals. While they all suggest buying, they work on different principles and timeframes. Understanding these differences helps you choose the right tool for the job.
Here is a quick comparison:
| Signal | Type | Key Difference |
| Golden Cross | Trend | Specific 50/200 day crossover. Long-term. |
| General MA Cross | Trend | Can use any settings (e.g., 9/21). Often faster/noisier. |
| Trendline Break | Price Action | Leading signal. Happens before the Golden Cross. |
| Momentum (MACD) | Momentum | Measures speed of change, not just direction. |
7.1. Golden Cross vs. General Bullish MA Crossover
Not every crossover is a Golden Cross. The term “Golden Cross” is reserved strictly for the specific short-term moving average and long-term moving average combination.
A general moving average crossover (like a 9-day crossing a 21-day) is a short-term swing trading signal. It happens frequently and produces many false signals. The Golden Cross is a major, long-term event that carries significantly more weight with institutional investors.
7.2. Golden Cross vs. Trendline Breakout
These two signals often work together, but they happen at different times.
A trendline breakout is a leading price action signal. Price will usually break a diagonal trendline weeks before the moving averages cross, which is why learning how to draw trend lines for confirmation can provide an earlier entry point.
Smart traders often buy the trendline break first, then add to their position later when the Golden Cross confirms the trend is real.
7.3. Golden Cross vs. Momentum Boost (MACD/RSI)
While the Golden Cross tracks the direction of the trend, indicators like MACD and RSI track the speed (momentum) of the move.
It is possible to have a Golden Cross (bullish trend) happen while momentum is falling (bearish divergence). The Golden Cross tells you the “big picture” is up, while momentum indicators tell you if the “current leg” is running out of gas. Use them together for the full picture.
8. What Do Real Historical Examples Look Like?
History is the best teacher. While past performance does not guarantee future results, looking at famous Golden Cross events helps us understand the potential of this trend reversal pattern.
8.1. S&P 500 (The 2020 Post-COVID Recovery)
Following the rapid COVID-19 crash in March 2020, the market recovered quicker than many expected. According to Investopedia (2020), by July 2020, the S&P 500 printed a clear Golden Cross.
This signal was crucial because it confirmed to institutional investors that the “bear market” was officially over. Golden Cross patterns like this remain foundational in index trading strategies for long-term investors. Investors who trusted this lagging signal and bought the cross rode a massive, steady rally that lasted throughout 2021.
8.2. Bitcoin (The 2020 Bull Run Start)
Crypto markets are volatile, but the Golden Cross in May 2020 remains legendary. After the March crash, Bitcoin stabilized around $9,000. When the 50-day MA crossed back above the 200-day MA, it signaled the start of the post-halving bull run. Unlike a fakeout, this trend held firm. Bitcoin climbed from around $9,500 at the cross to to over $23,000 in the following half-year (Phemex Academy, 2020)
8.3. Tesla (The 2019 Mega-Rally)
Before Tesla became a trillion-dollar company, it flashed a textbook Golden Cross in late 2019. Following a long slump, the stock triggered this signal in November 2019, shortly after a surprise earnings rally. Buying pressure exploded, and the stock rallied aggressively, gaining over 900% by mid-2021 and splitting its stock in 2020 (Markets Insider, 2021)
9. What Are the Common Mistakes Traders Make with the Golden Cross?
Even with a reliable chart pattern, traders often lose money due to poor execution or ignoring market context. Avoiding these four common traps will significantly improve your success rate.
- Assuming a guaranteed bull run: The Golden Cross is a lagging indicator, not a crystal ball. It reacts to past data. In a bear market rally, a cross can sometimes occur just before the price rolls over again (a “bull trap”). Never trade it blindly without other confirmation.
- Ignoring volume: Volume is the fuel for any trend. A crossover that happens on low or declining volume lacks institutional support. If big money isn’t buying, the breakout is likely to fail.
- Trading in a sideways market: Moving averages are designed for trends, not ranges. If the price is chopping horizontally, the 50 and 200 MAs will cross back and forth repeatedly. Trading these “whipsaws” results in a series of frustrating small losses.
- Chasing the trade (late entry): By the time the Golden Cross physically appears on the chart, the price has often already rallied 10% or 20% from the bottom. Buying immediately at the peak of this move leaves you vulnerable to a pullback. It is often smarter to wait for the price to cool off before entering.
10. Which Tools Can Help You Detect the Golden Cross Automatically?
Scanning thousands of charts manually is impossible. Fortunately, modern trading platforms have built-in tools to scan moving average setups for you instantly.
- TradingView Alerts: This is the best tool for monitoring specific assets. You can set a simple alert on any chart (e.g., Bitcoin or Apple) to notify you via pop-up or email the exact moment the short-term moving average crosses greater than the 200 MA.
- TrendSpider (Algorithmic Detection): This platform is designed for automated technical analysis. Its “Market Scanner” can search the entire S&P 500 in seconds to find any stock that has triggered a Golden Cross within the last 24 hours.
- Finviz Stock Screener: Finviz is a powerful (and free) web-based scanner. Under the “Technical” tab, you can select the moving average signal “SMA 50 crossed above SMA 200” to get a list of all stocks currently showing this bullish pattern.
- MT4/MT5 Indicators: For Forex traders, the MetaTrader marketplace offers hundreds of custom indicators. You can download a “Golden Cross Dashboard” that monitors every currency pair and timeframe, placing an arrow on the chart when a signal appears.
11. Frequently asked questions about Golden Cross Pattern Strategy
Traders often have questions about reliability and timeframes. Here are the answers to the most common questions.
12. Conclusion
The Golden Cross Pattern is a reliable signal for confirming major uptrends, but it requires patience. To avoid fakeouts, always confirm the moving average cross with volume and market structure, and prioritize buying on pullbacks rather than chasing the initial breakout.
Ready to master trend trading? Access our comprehensive library of educational guides and market analysis at Piprider to sharpen your skills today.